Copyright
©The Author(s) 2025.
World J Gastrointest Surg. Mar 27, 2025; 17(3): 98947
Published online Mar 27, 2025. doi: 10.4240/wjgs.v17.i3.98947
Published online Mar 27, 2025. doi: 10.4240/wjgs.v17.i3.98947
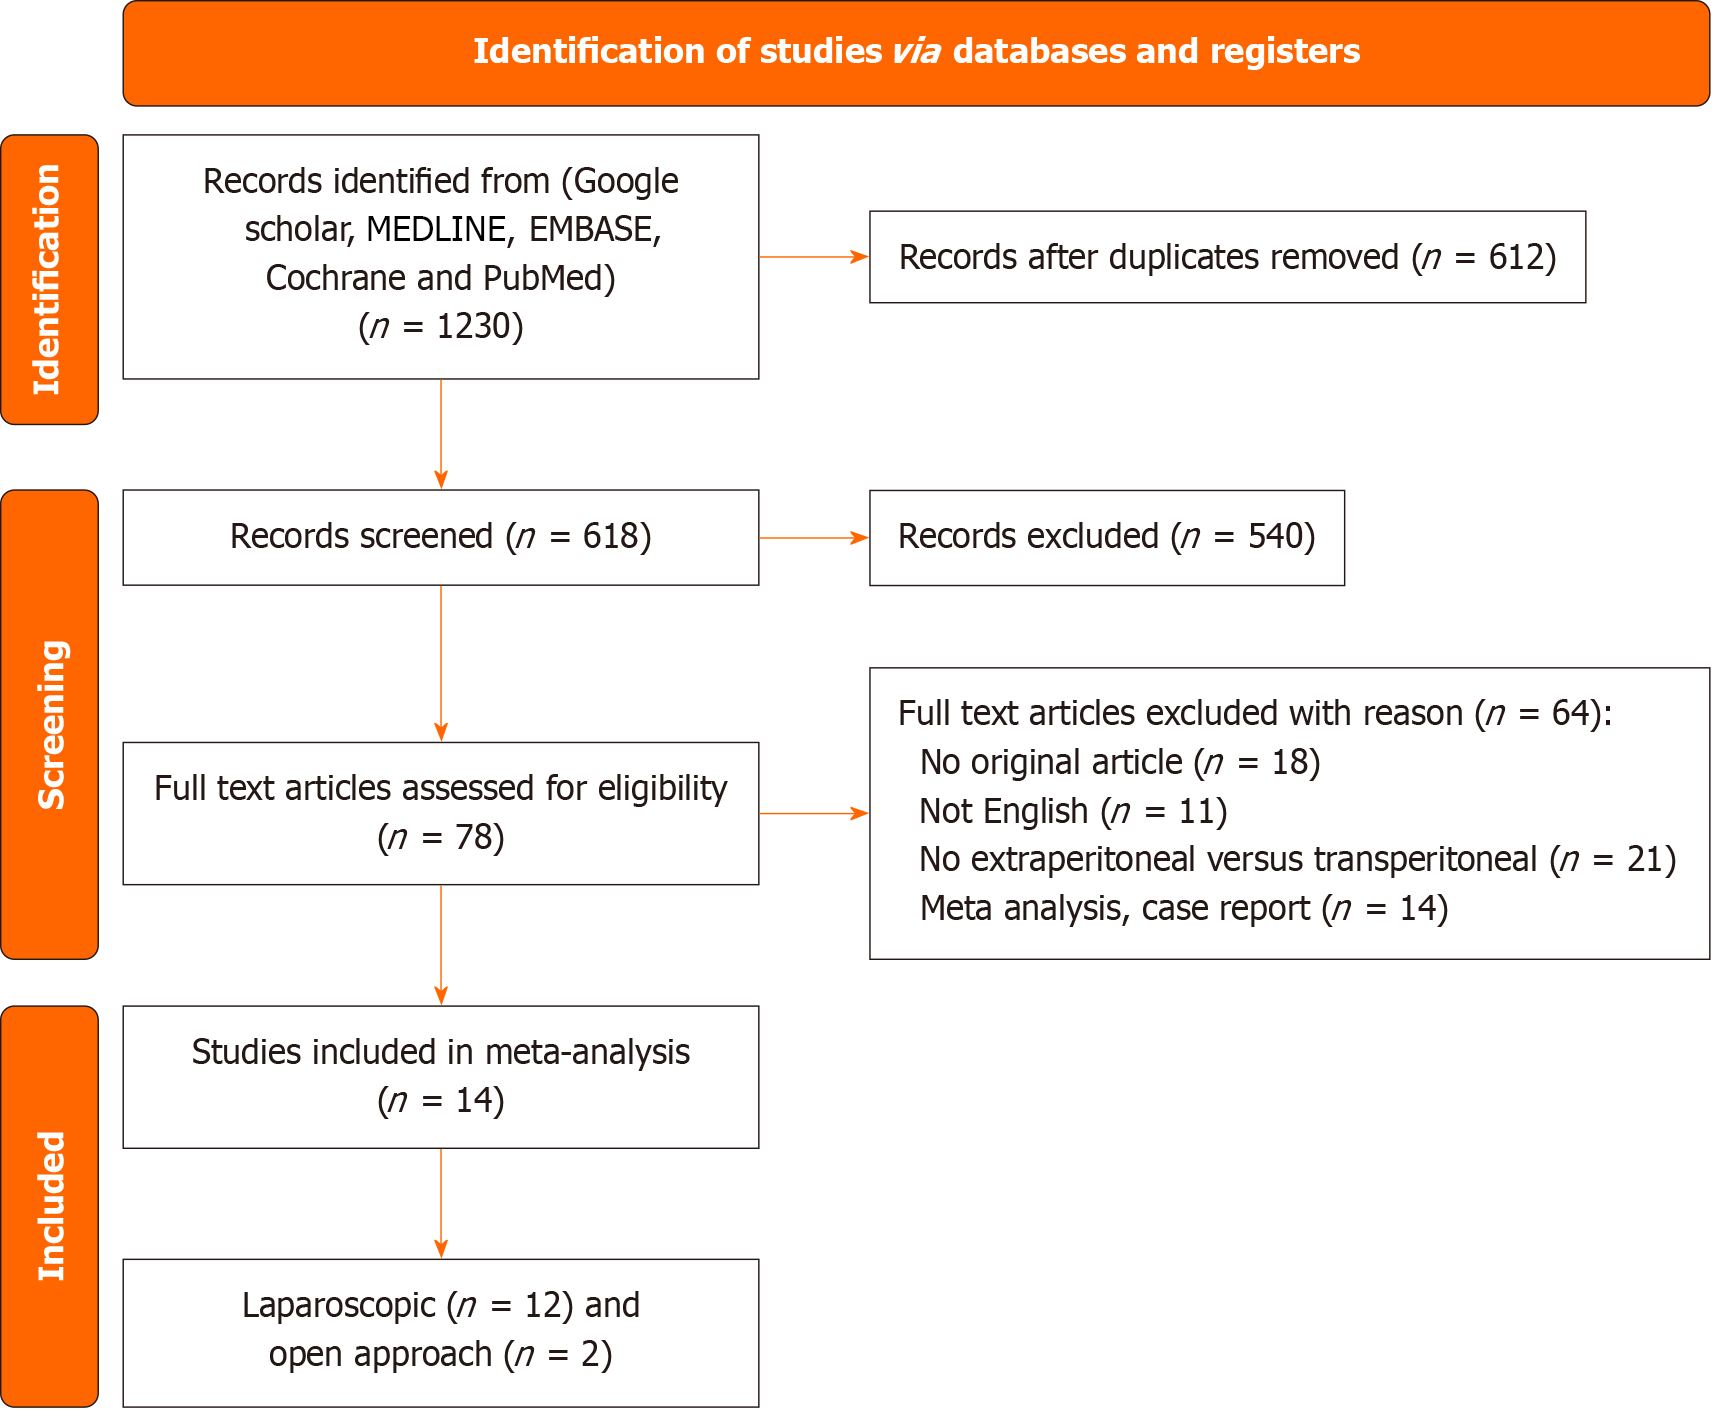
Figure 1
Literature screening process.
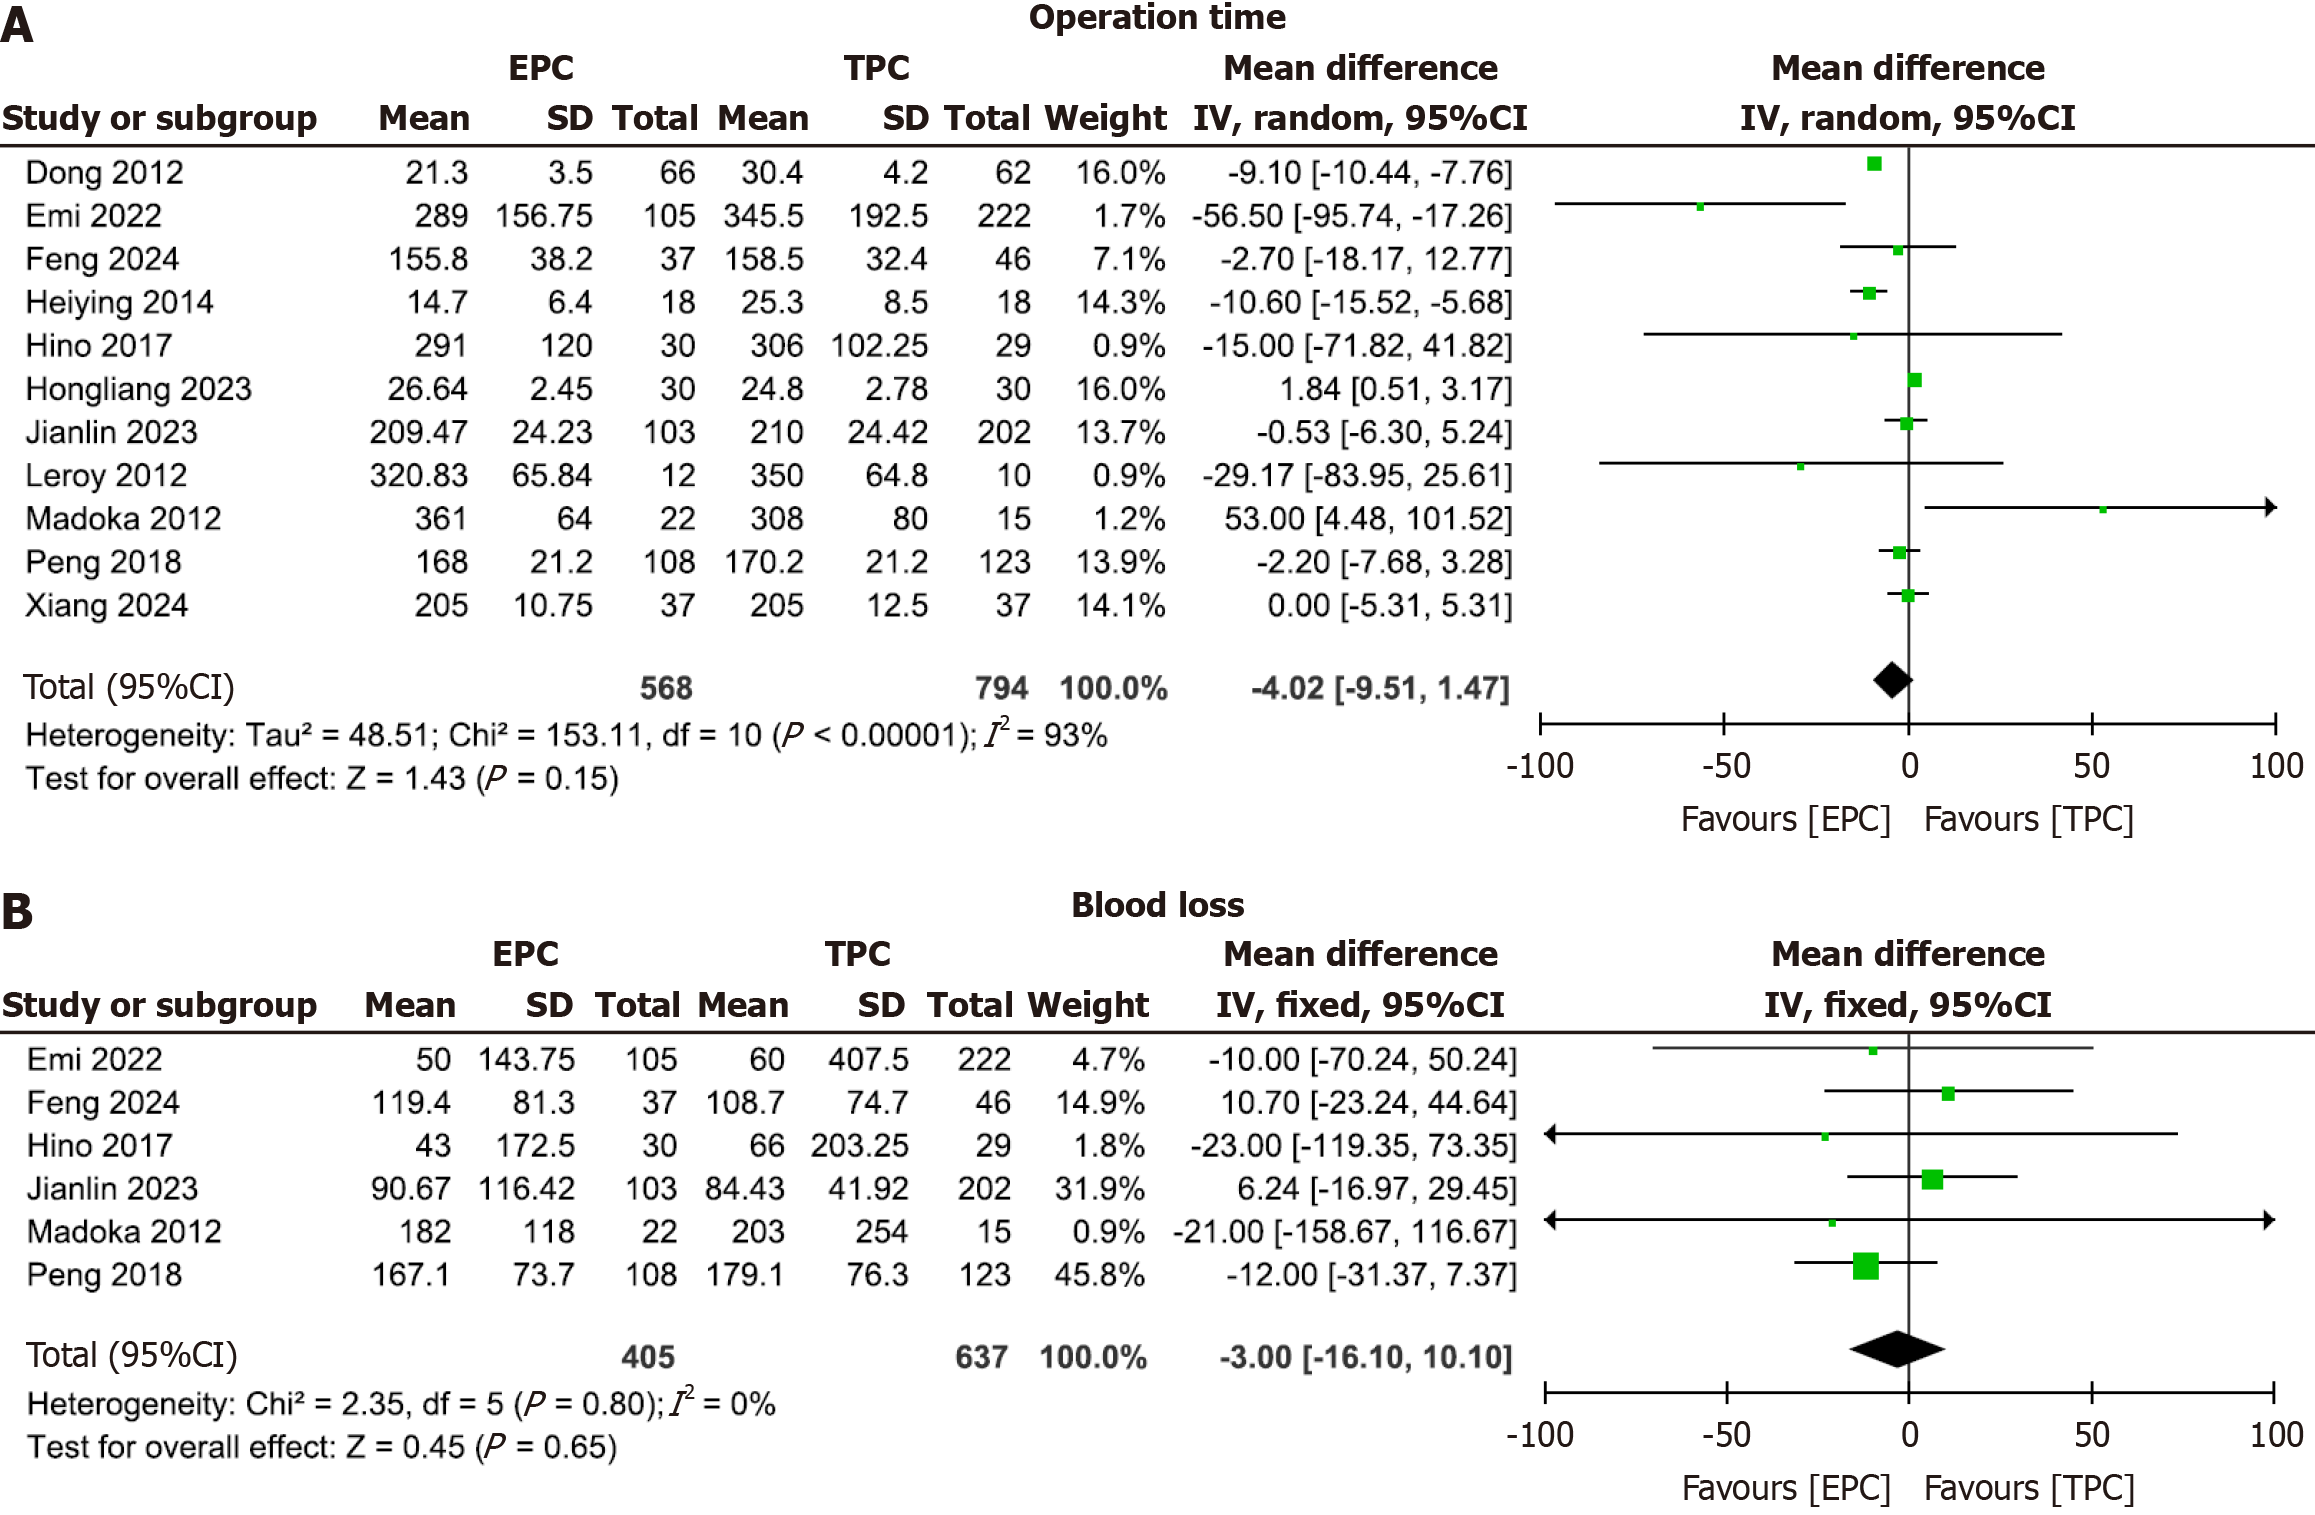
Figure 2 Forest plot of operation time and blood loss.
A: Operation time; B: Blood loss after laparoscopic approach. EPC: Extraperitoneal colostomy; TPC: Transperitoneal colostomy.
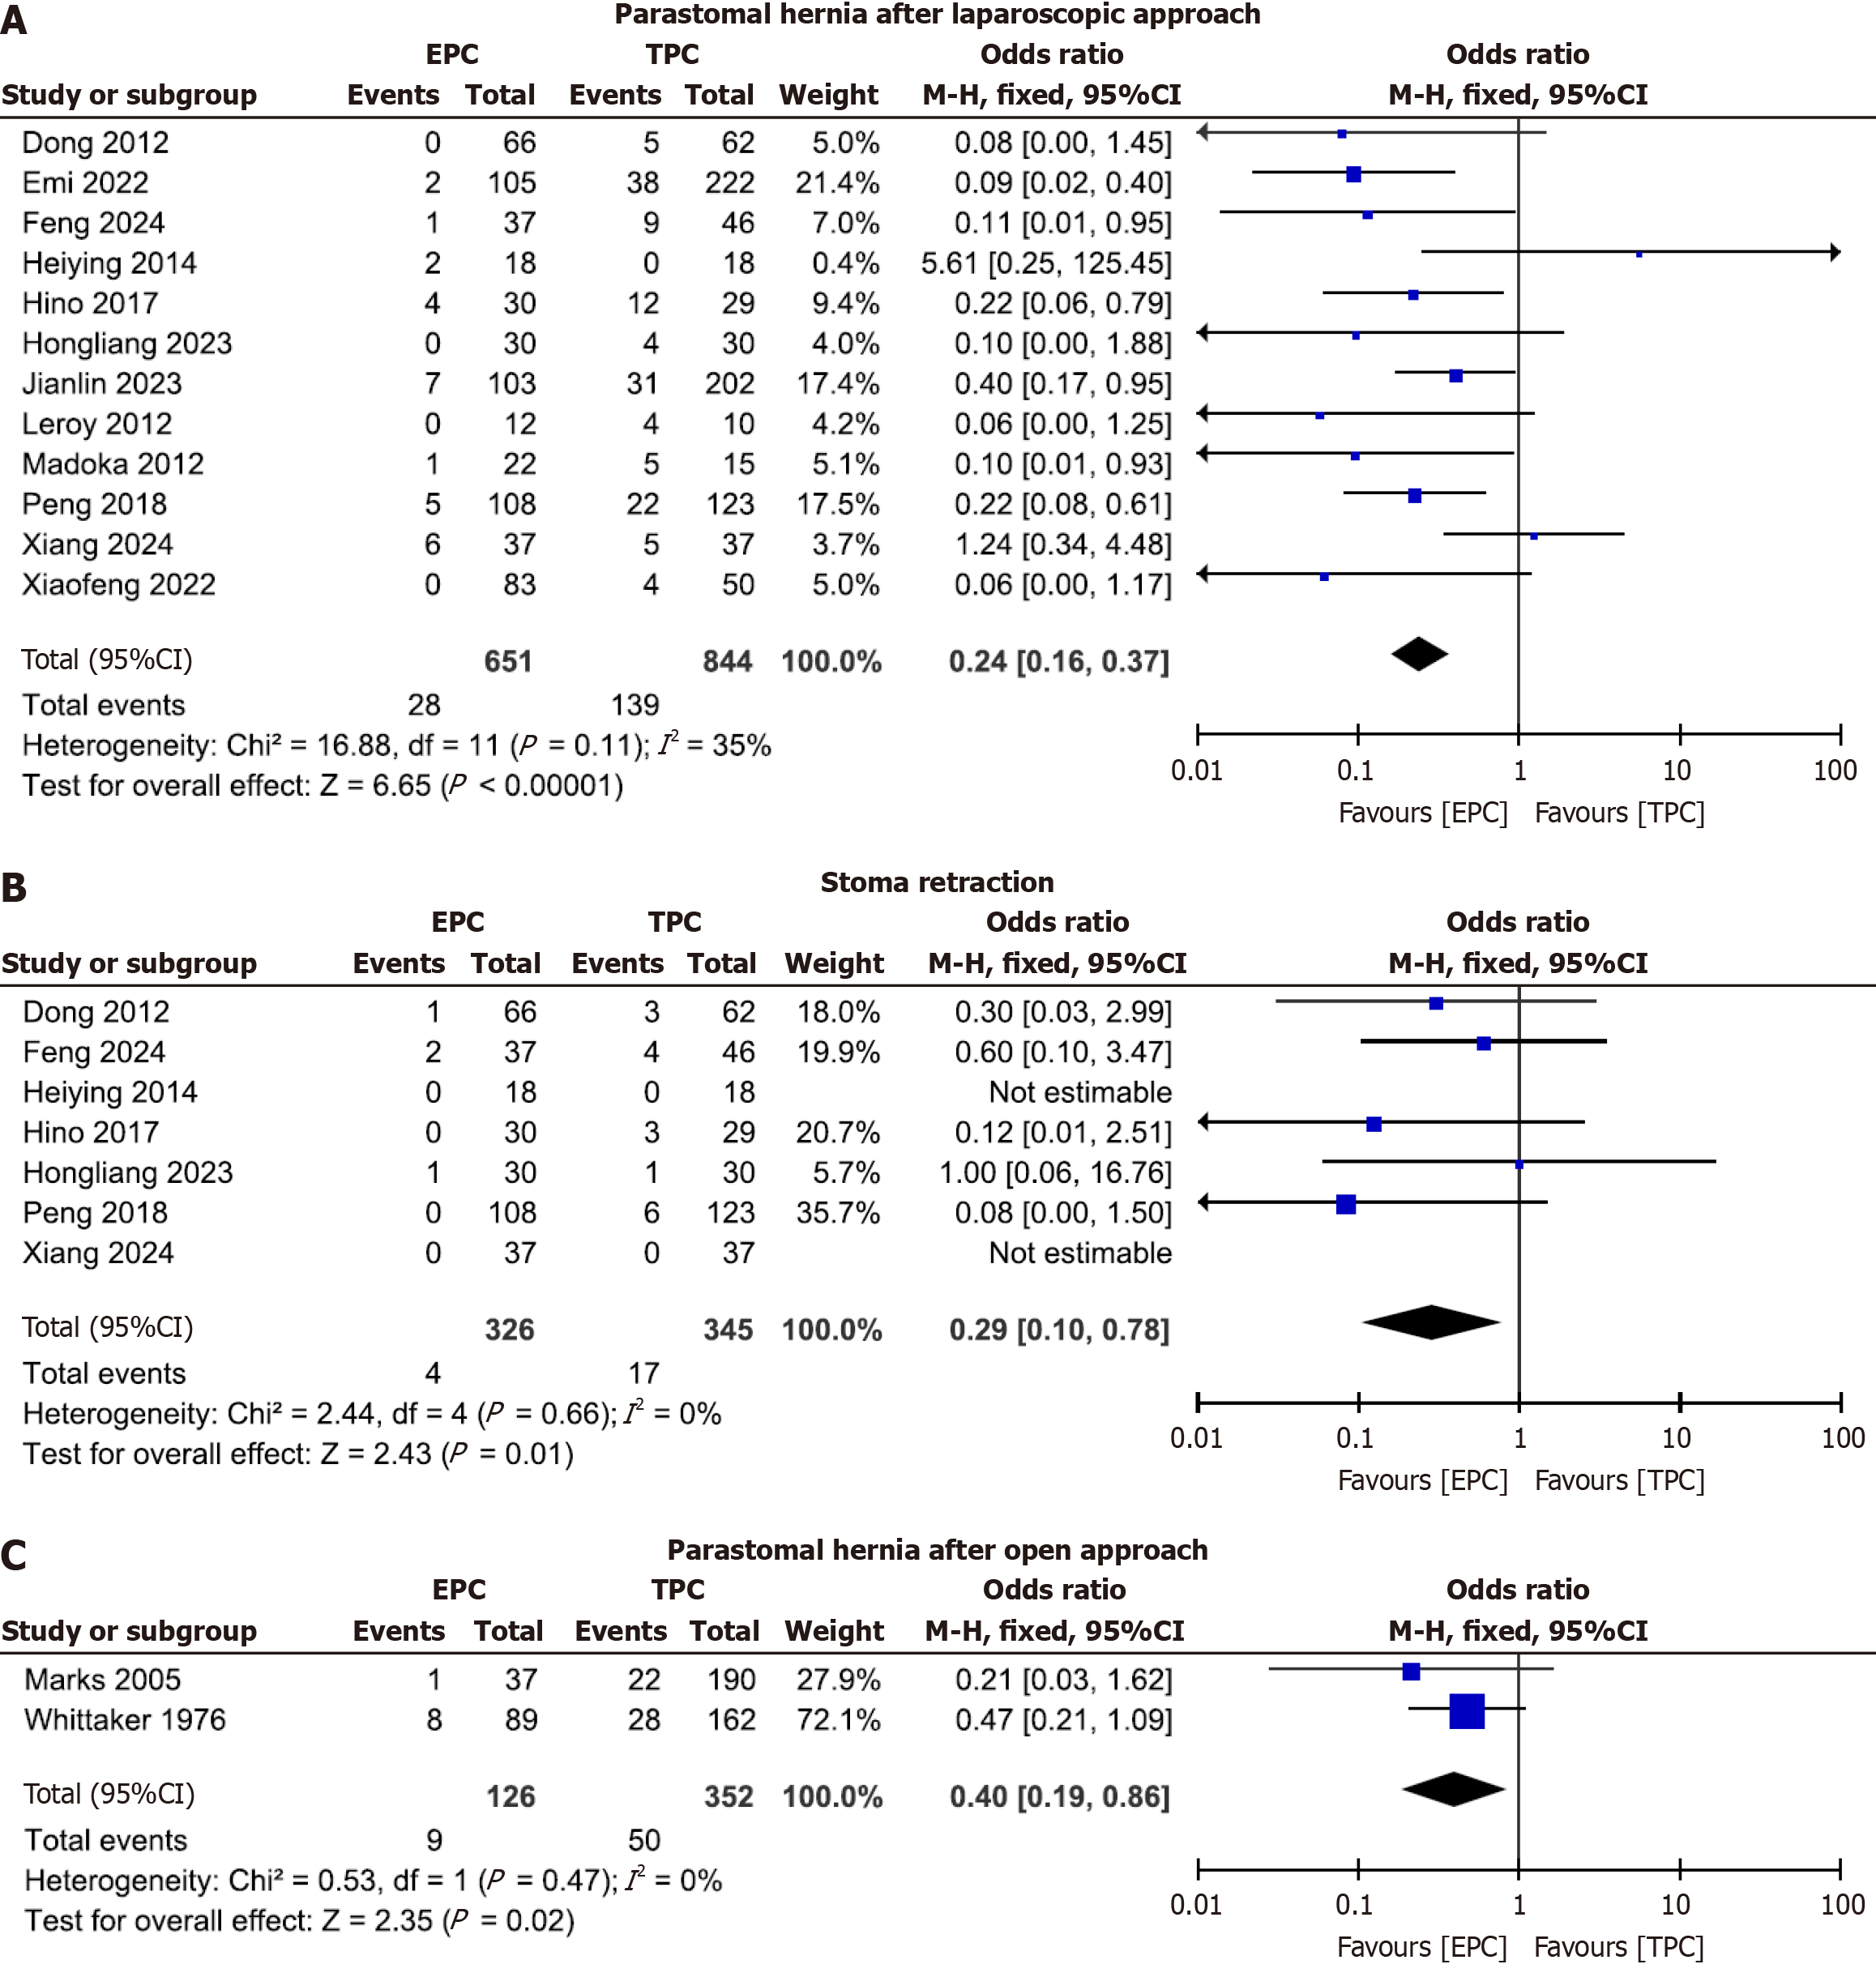
Figure 3 Forest plot of parastomal hernia after laparoscopic approach, stoma retraction, and parastomal hernia after open approach.
A: Parastomal hernia after laparoscopic approach; B: Stoma retraction after laparoscopic approach; C: Parastomal hernia after open approach. EPC: Extraperitoneal colostomy; TPC: Transperitoneal colostomy.
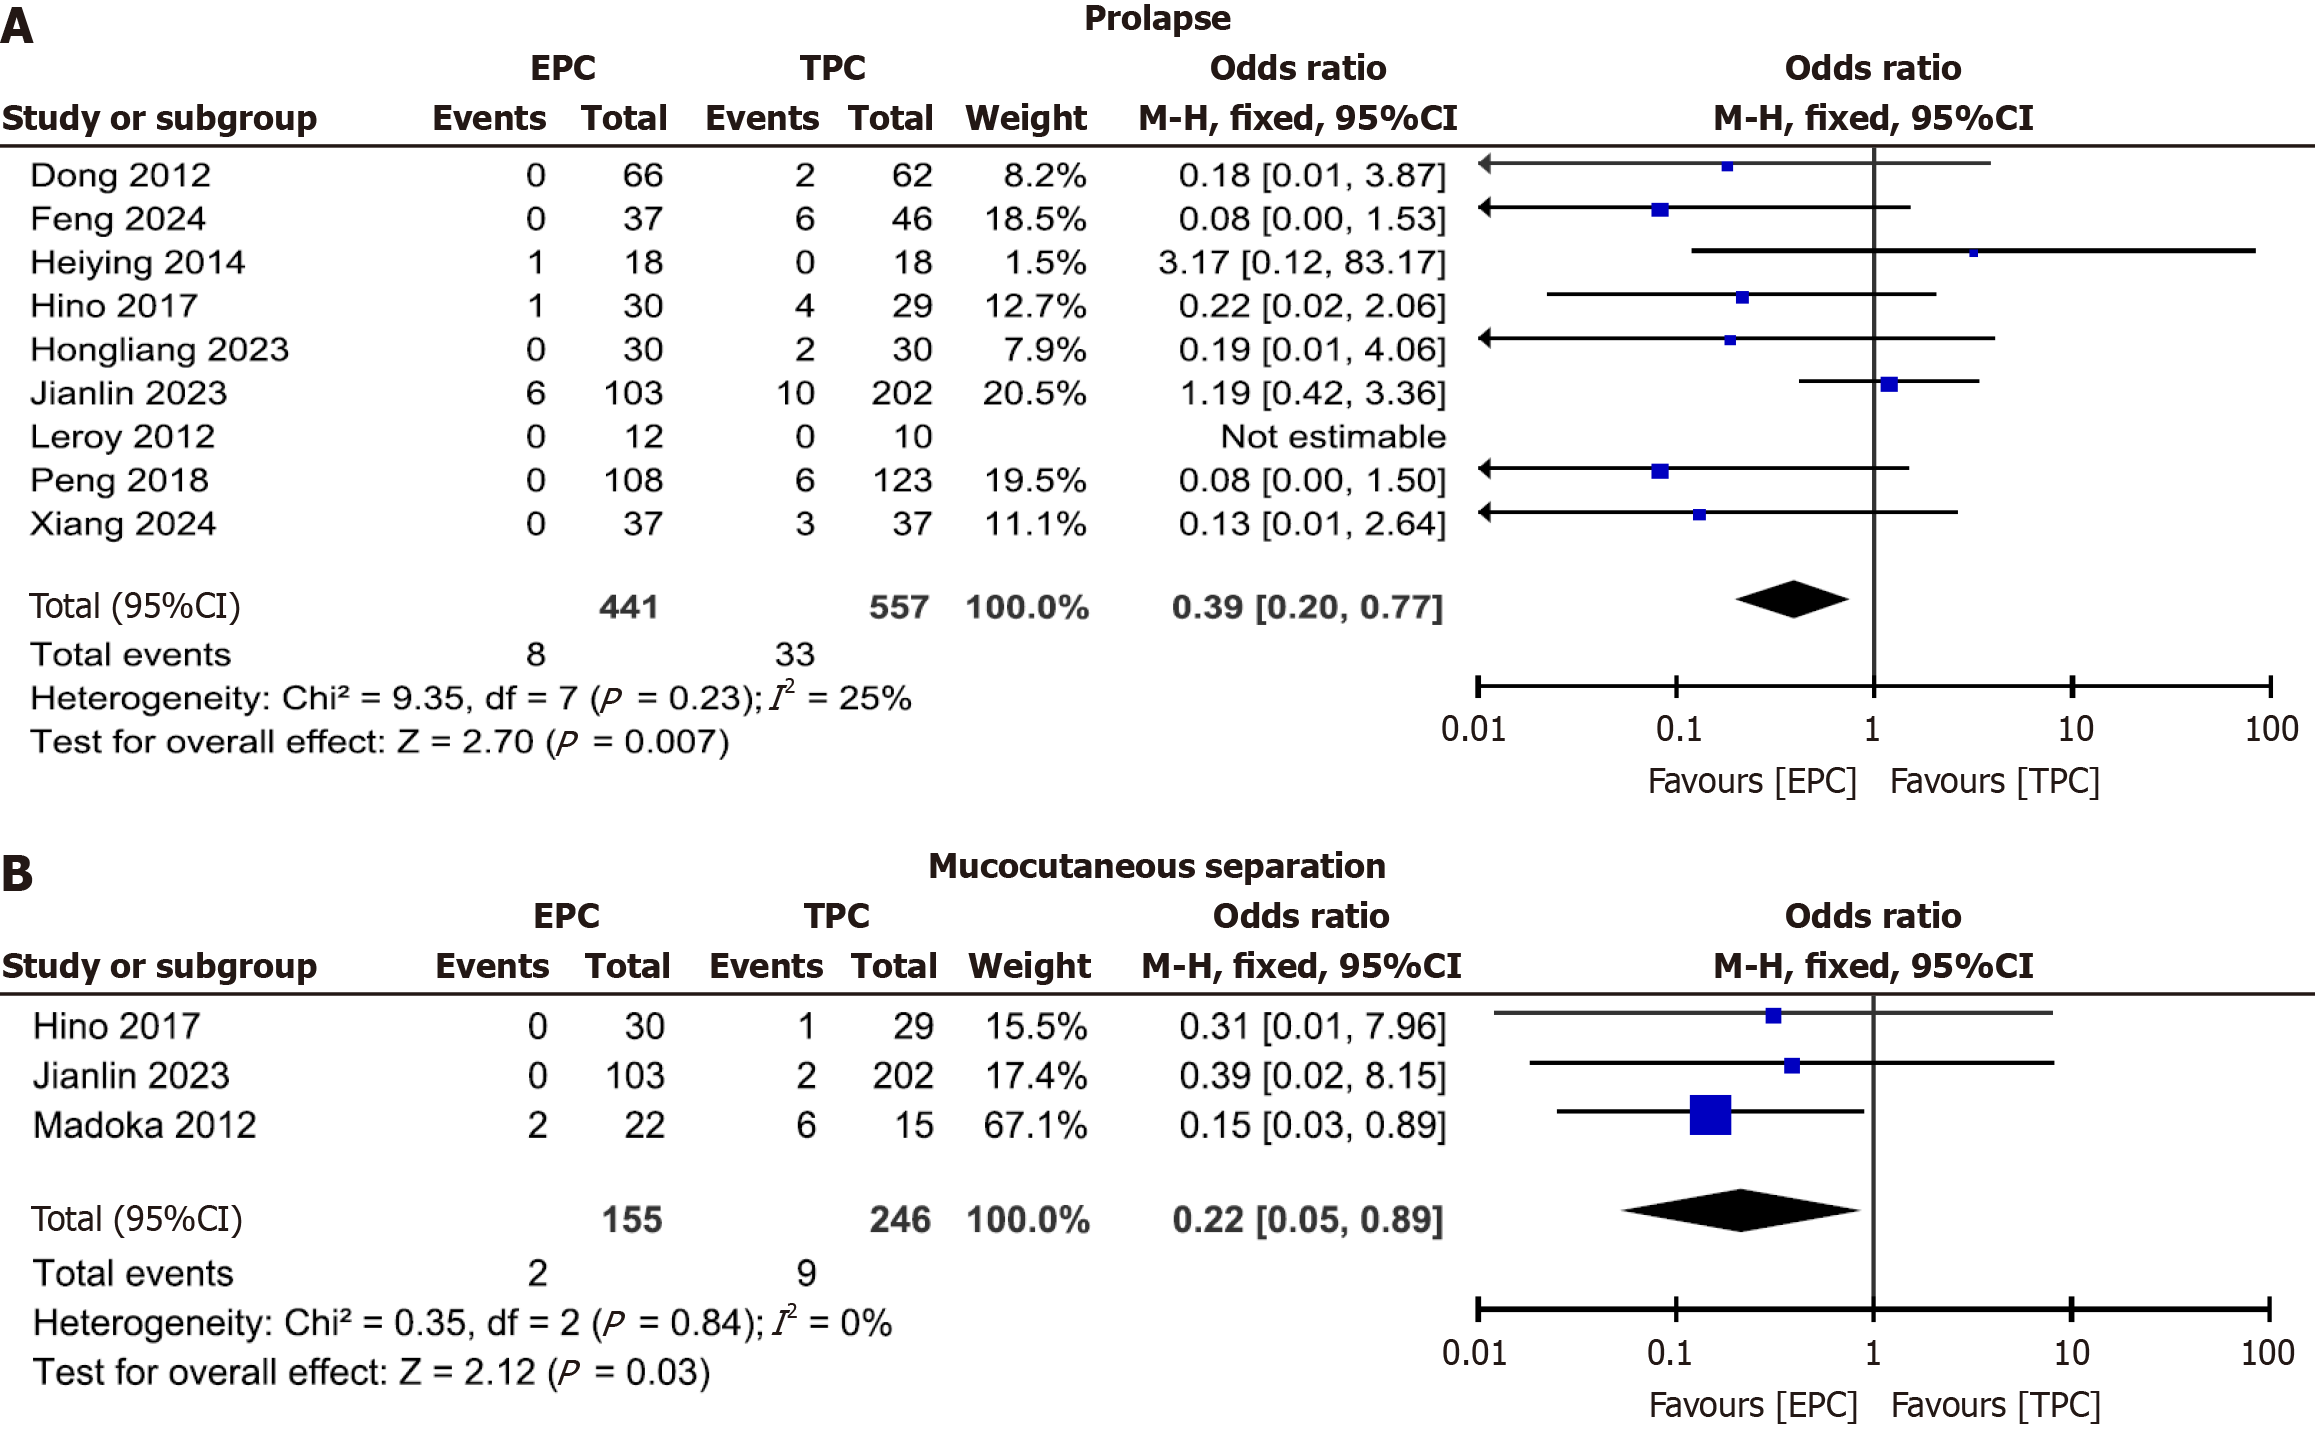
Figure 4 Forest plot of prolapse and mucocutaneous separation.
A: Prolapse; B: Mucocutaneous separation after laparoscopic approach. EPC: Extraperitoneal colostomy; TPC: Transperitoneal colostomy.
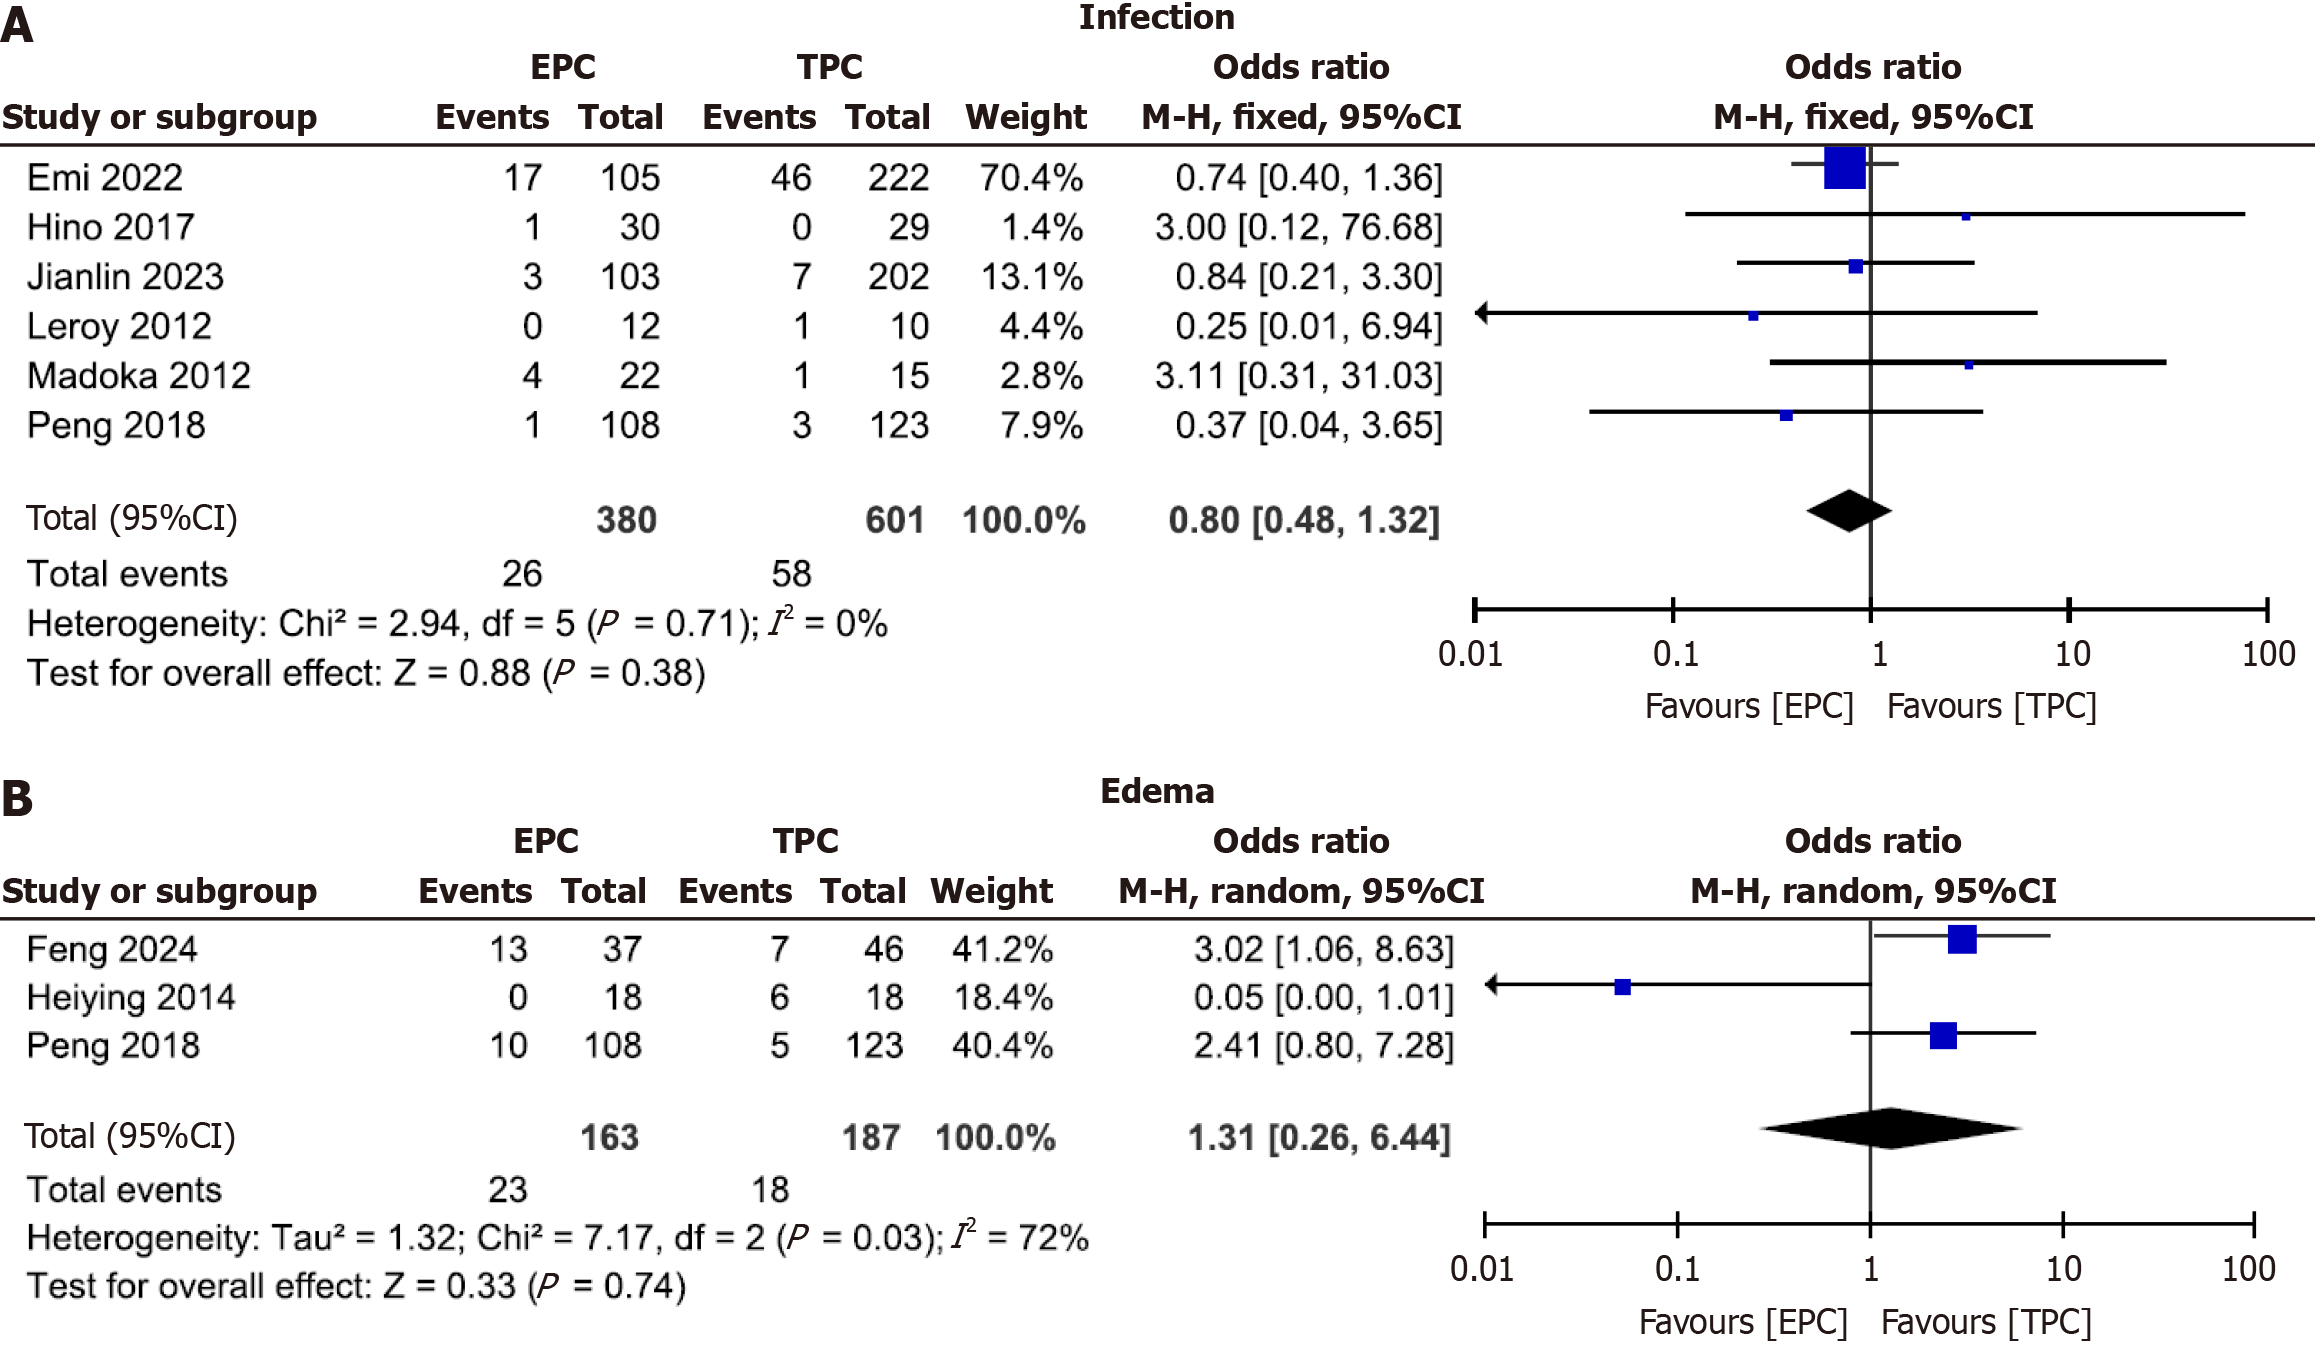
Figure 5 Forest plot of infection and edema.
A: Infection; B: Edema after laparoscopic approach. EPC: Extraperitoneal colostomy; TPC: Transperitoneal colostomy.
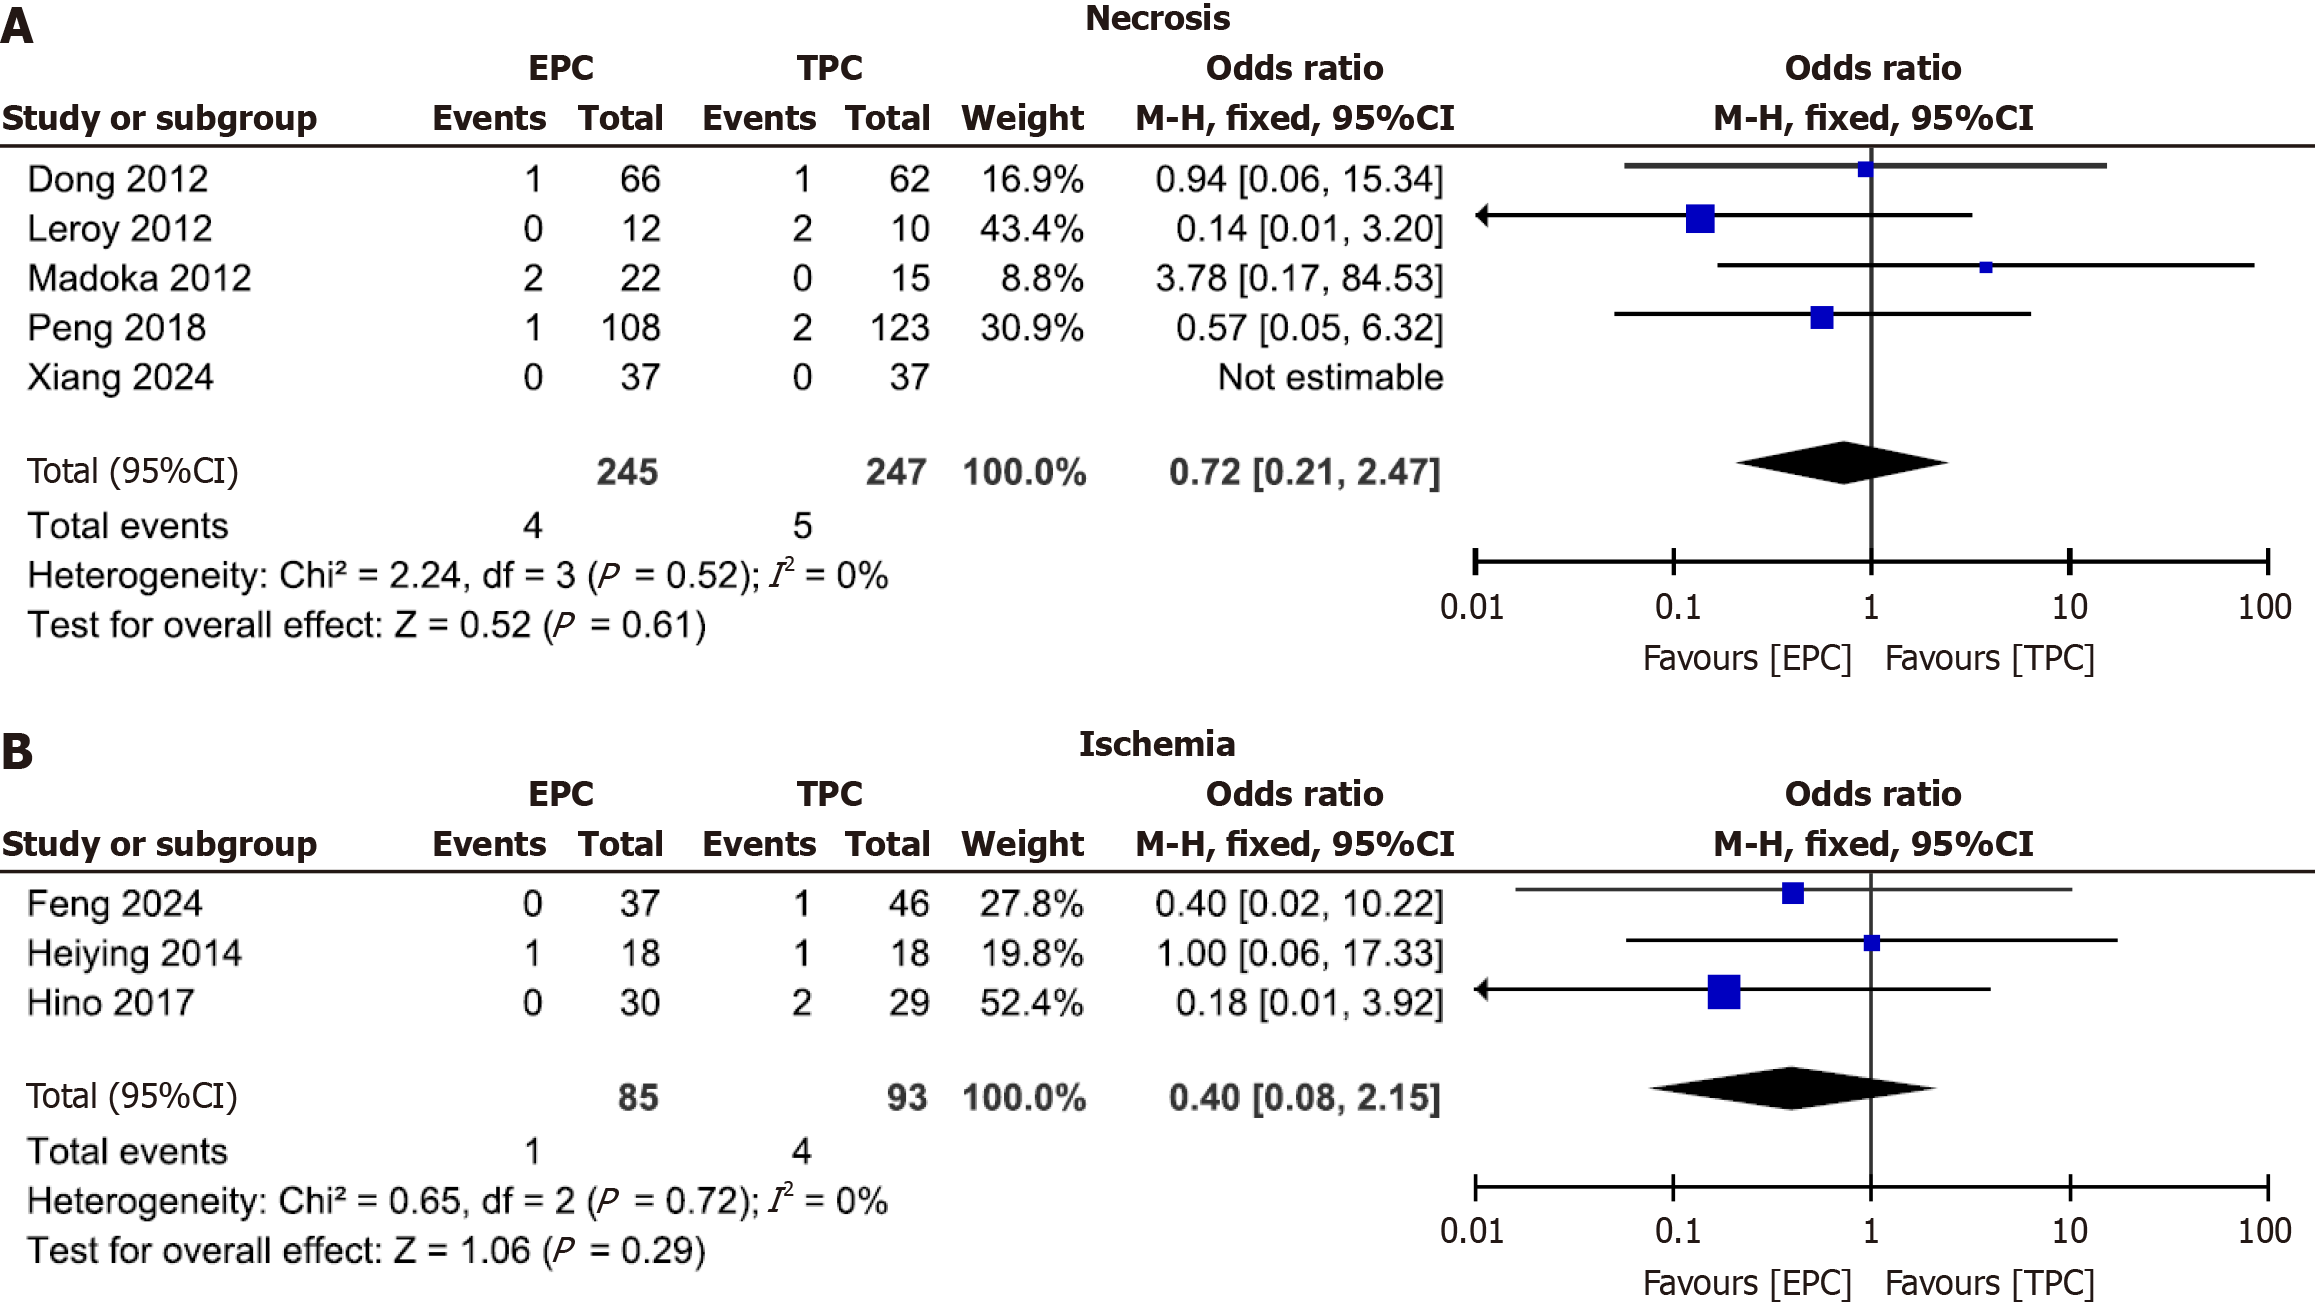
Figure 6 Forest plot of necrosis and ischemia.
A: Necrosis; B: Ischemia. EPC: Extraperitoneal colostomy; TPC: Transperitoneal colostomy.
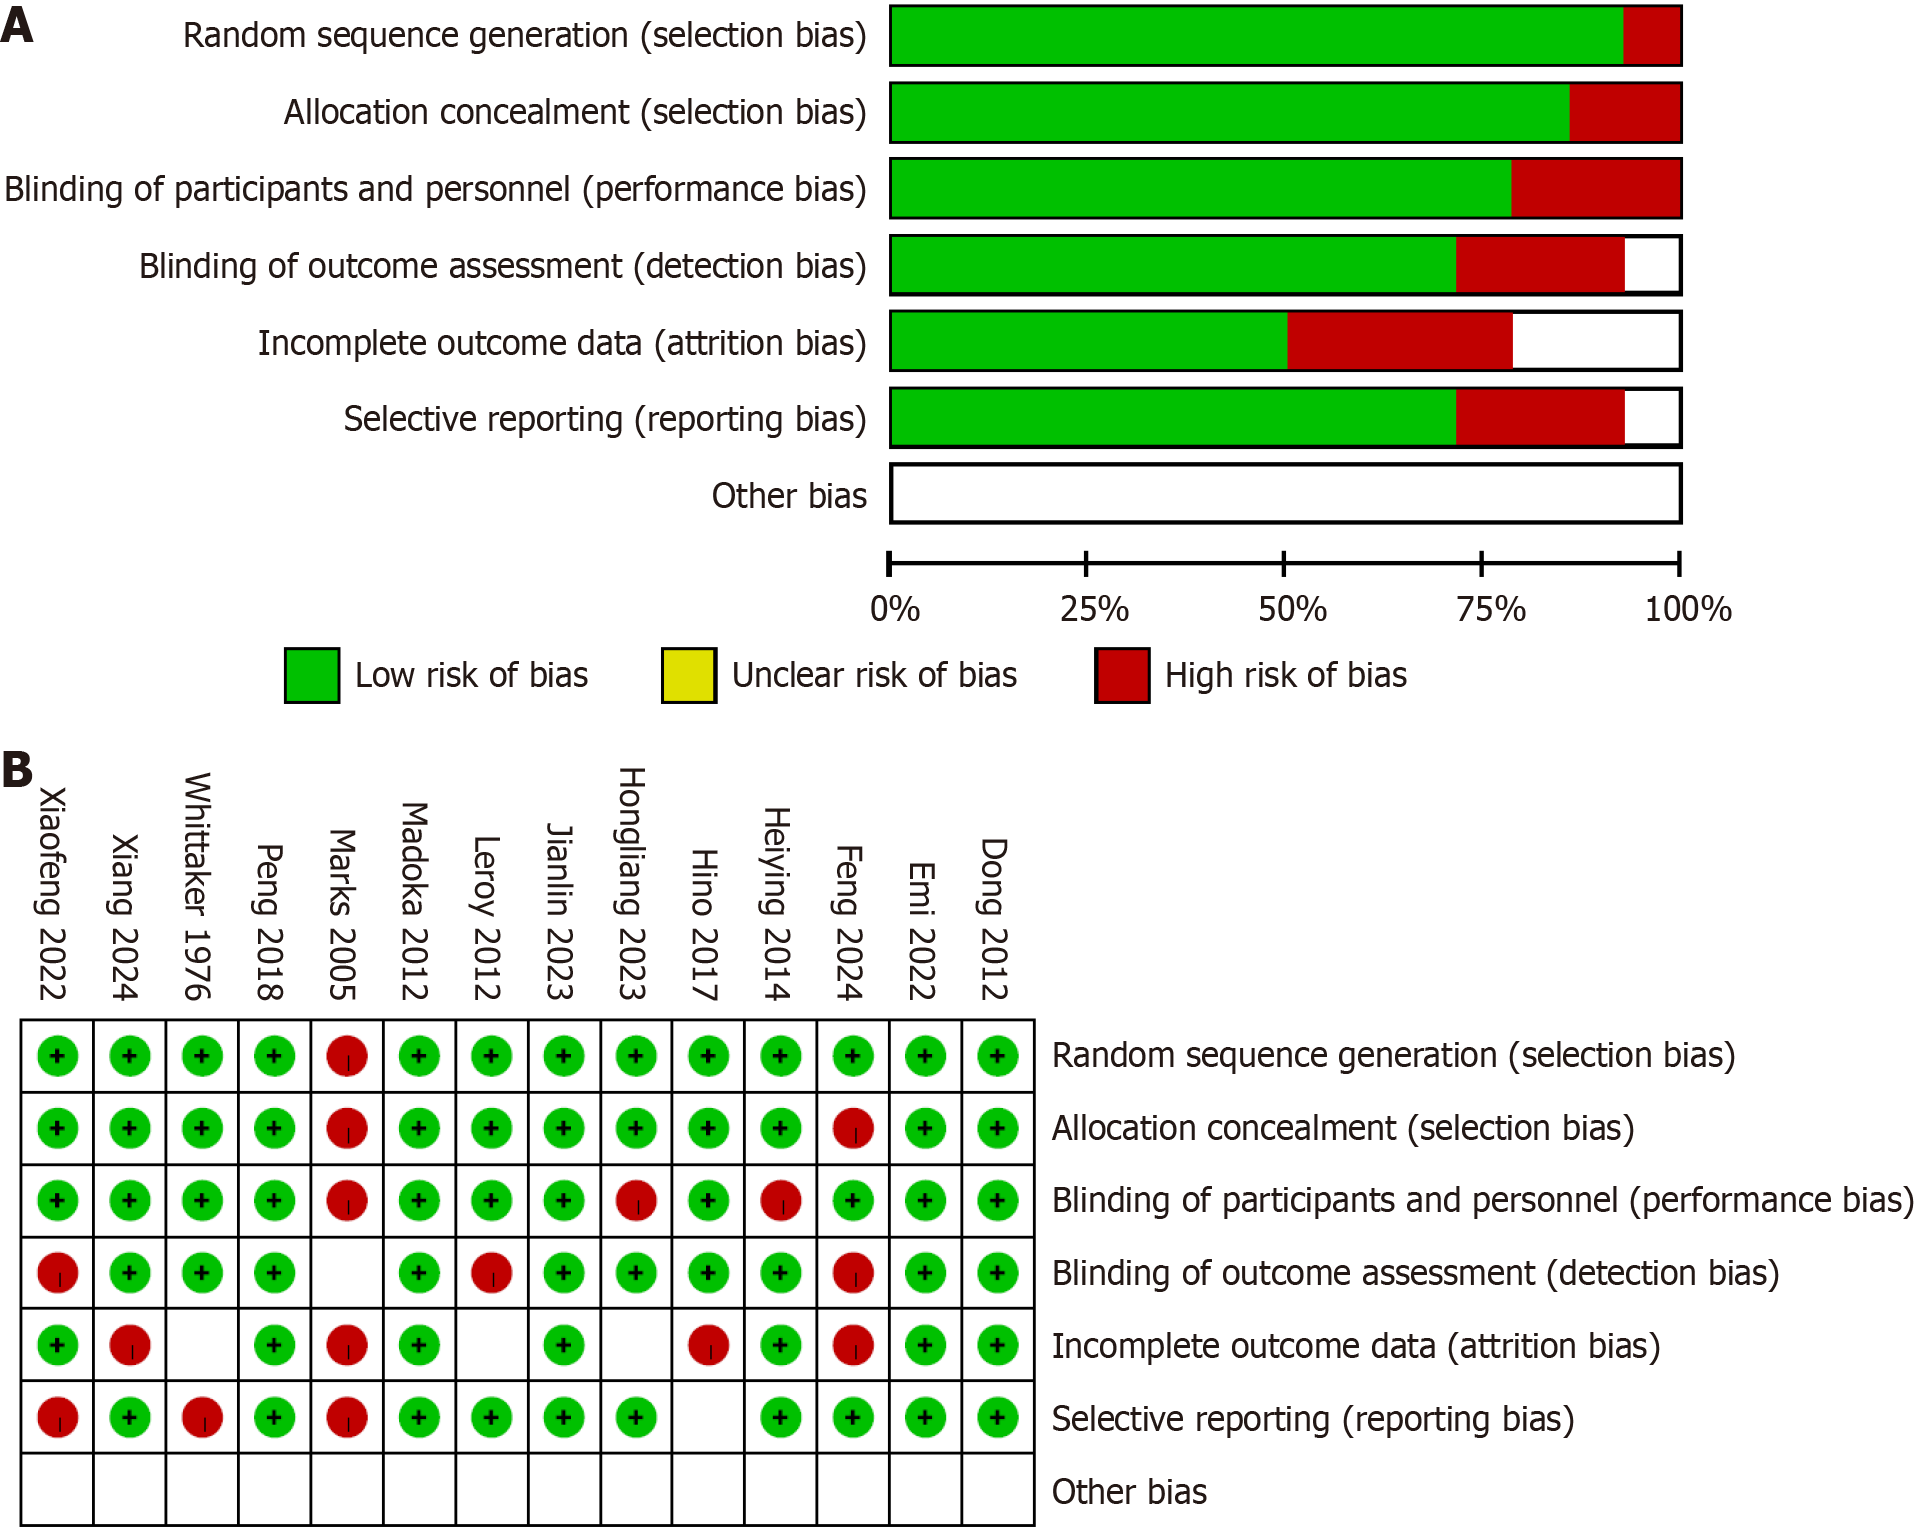
Figure 7 Quality assessment of included studies.
A: Graph depicting the risk of bias by presenting the authors’ assessments of each bias item as a percentage across all included studies; B: A summary of the bias assessments, detailing the authors' evaluations of each bias item for each study included in the review.
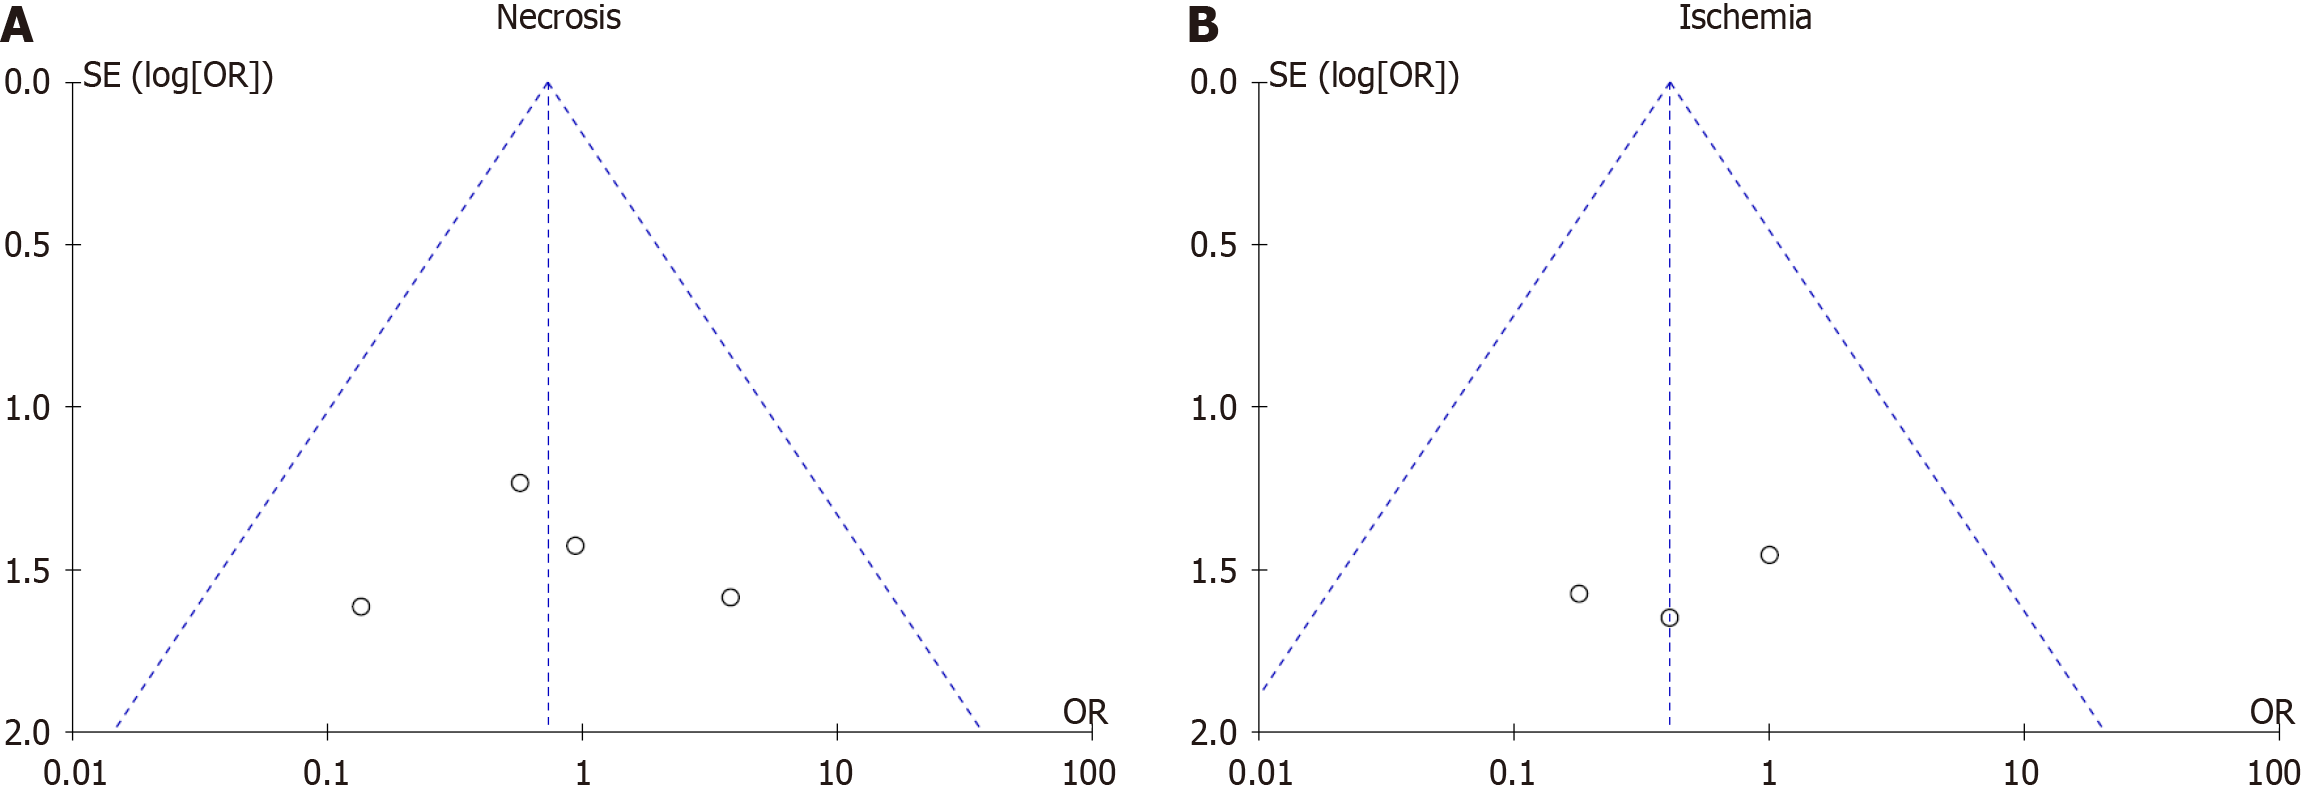
Figure 8 Funnel plot.
A: Necrosis; B: Ischemia. OR: Odds ratio.
- Citation: Isah AD, Wang X, Shaibu Z, Yuan X, Dang SC. Systematic review and meta-analysis comparing extraperitoneal and transperitoneal routes of colostomy-related complications. World J Gastrointest Surg 2025; 17(3): 98947
- URL: https://www.wjgnet.com/1948-9366/full/v17/i3/98947.htm
- DOI: https://dx.doi.org/10.4240/wjgs.v17.i3.98947


