Copyright
©The Author(s) 2025.
World J Gastrointest Surg. Mar 27, 2025; 17(3): 101697
Published online Mar 27, 2025. doi: 10.4240/wjgs.v17.i3.101697
Published online Mar 27, 2025. doi: 10.4240/wjgs.v17.i3.101697
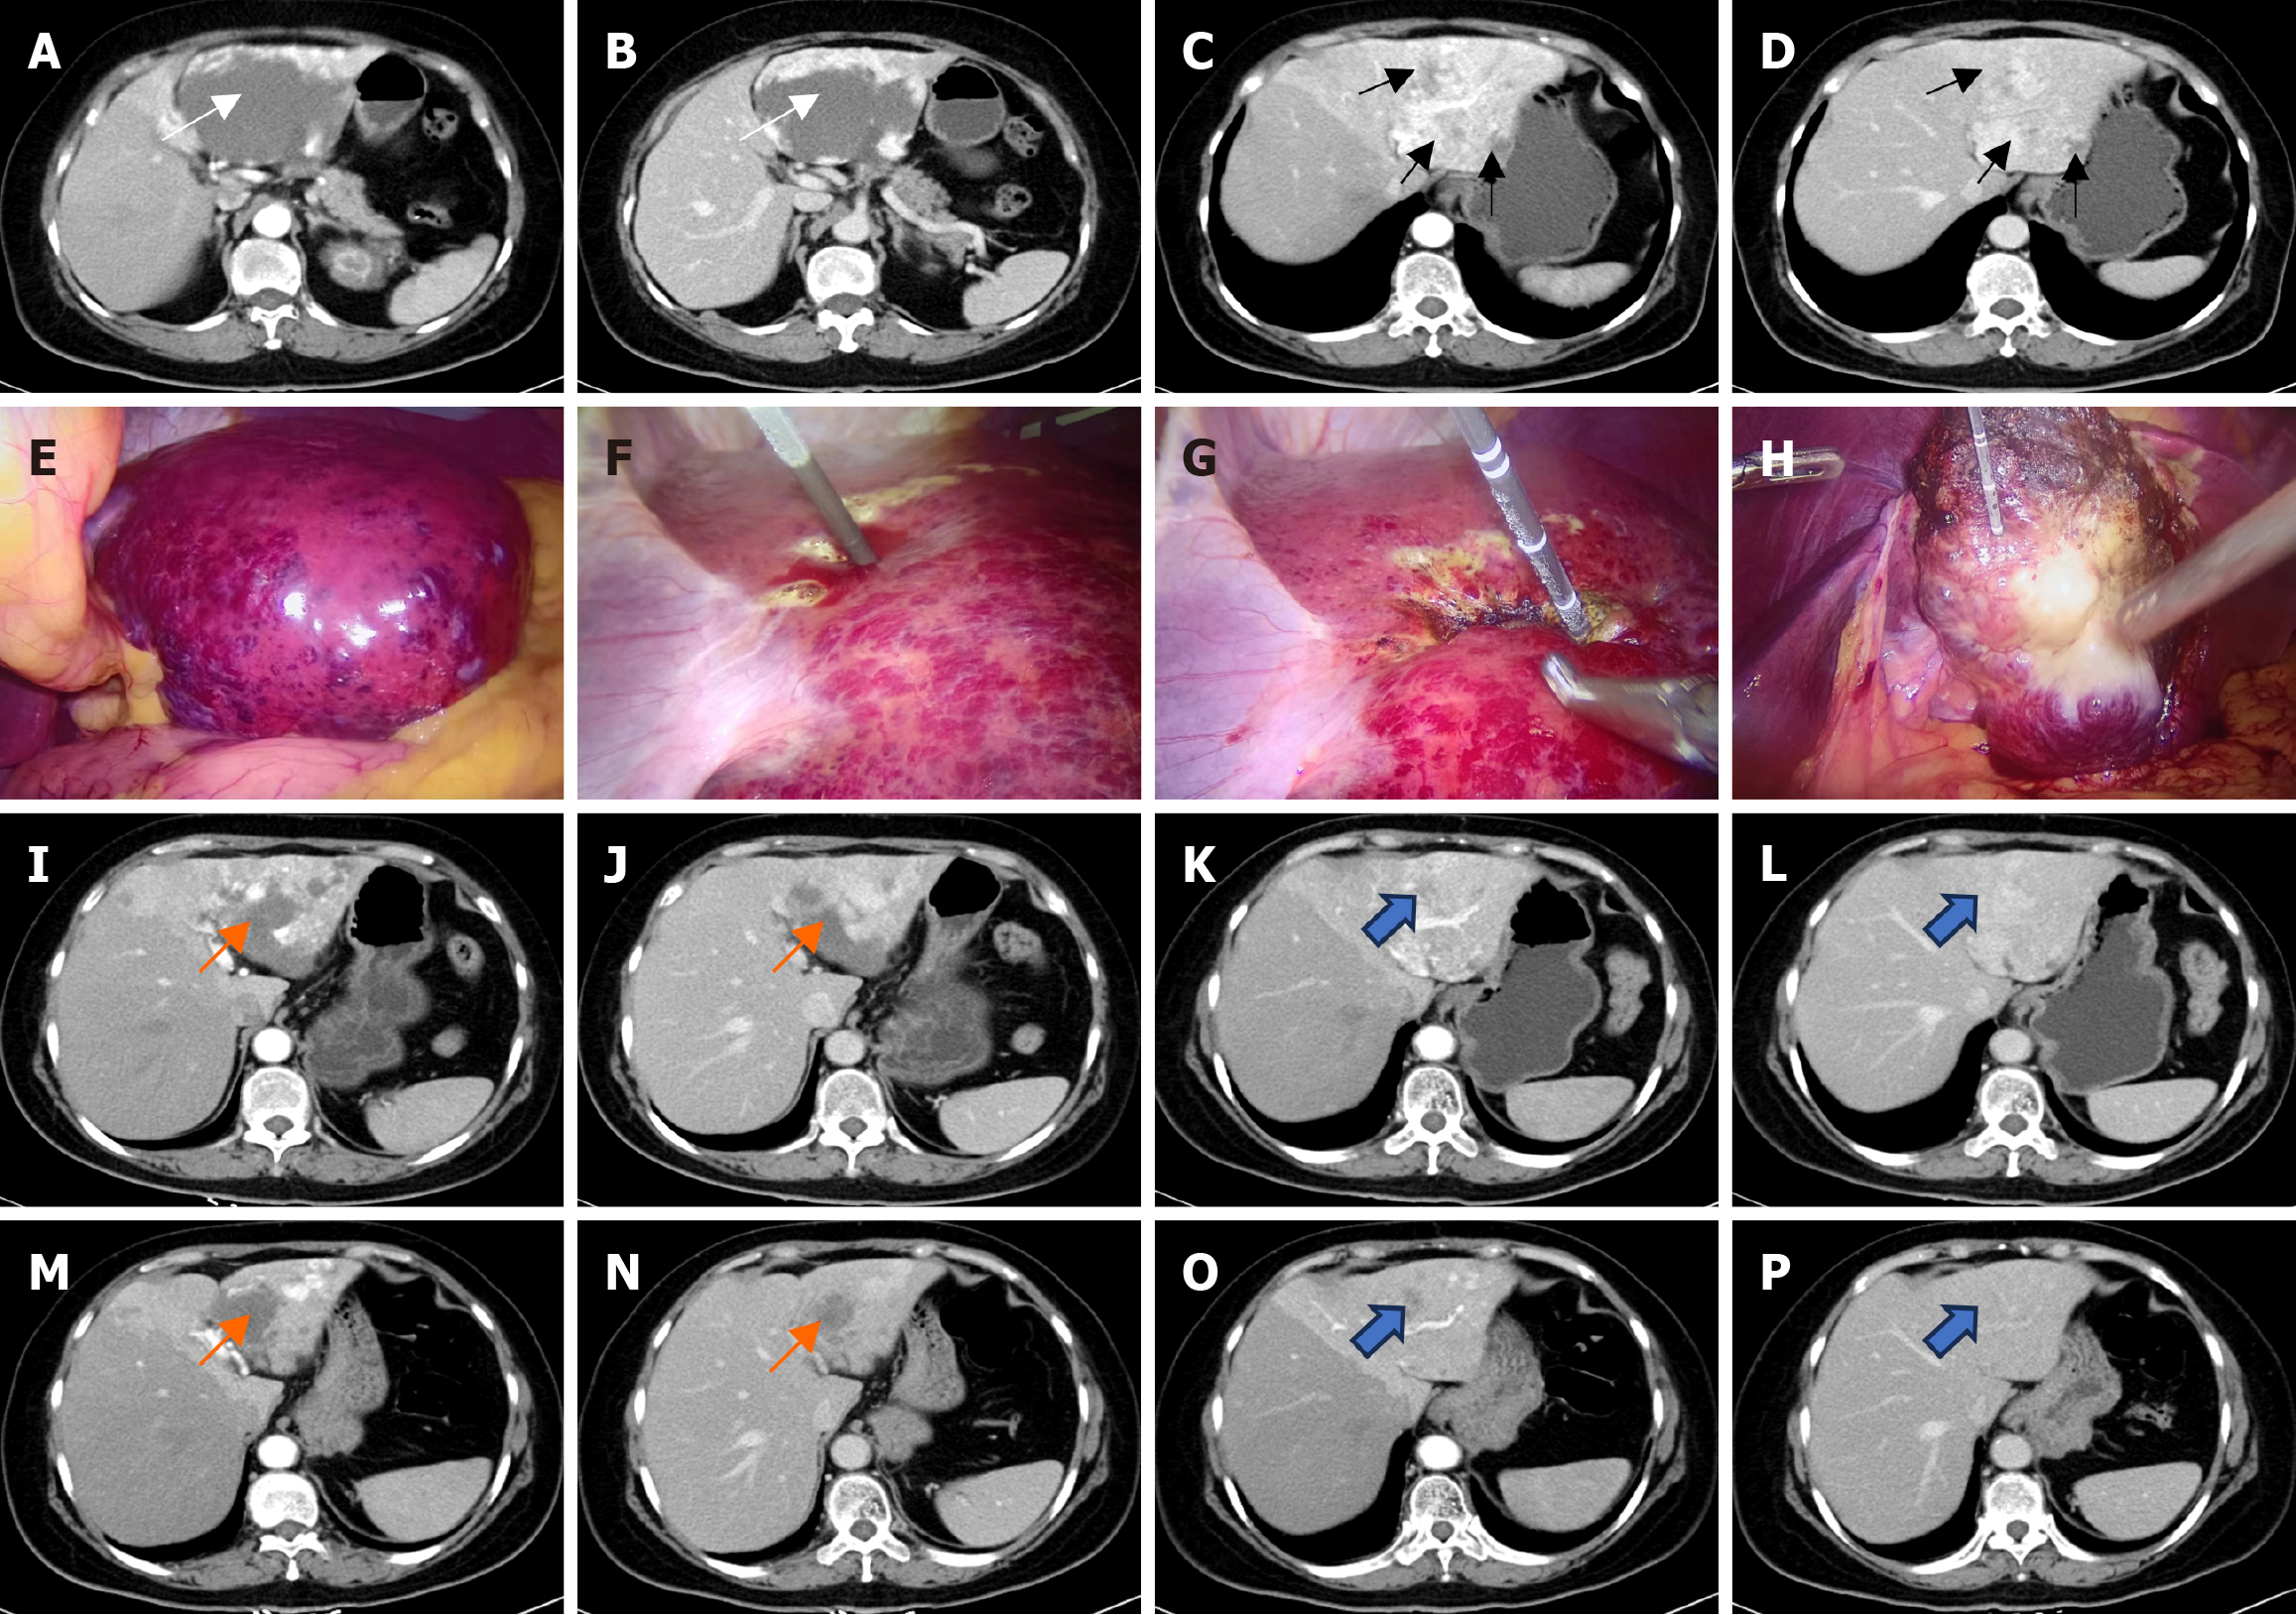
Figure 1 Initial contrast-enhanced computed tomography scan of the abdomen obtained, intraoperative findings and follow-up contrast-enhanced computed tomography scan of the abdomen obtained of case 1.
A-D: Initial contrast-enhanced computed tomography (CT) scan of the abdomen obtained. A hemangioma (9.9 cm, white arrow) is evident in the left lateral segment of the liver, with multiple disseminated small enhanced nodular lesions (black arrows) adjacent to the hemangioma (A: Arterial phase; B: Arterial phase; C: Venous phase; D: Venous phase); E: Intraoperative findings of complete giant cavernous hemangioma (GCH); F: Microwave ablation of GCH, with the first application being launched from the exterior margin of the tumor; G: The second puncture point should be selected at the edge of the ablated zone rather than at the hemangioma to avoid bleeding at the puncture site. At the same time, numerous variably-sized red nodules were present near the GCH; H: After ablation, the ablated zone atrophied and collapsed; I-L: Follow-up contrast-enhanced CT scan of the abdomen obtained. Three months after ablation, contrast-enhanced CT revealed that the hemangioma was completely ablated, and the ablated zone (orange arrow) volume decreased. The reduction in the size of remained diffuse hepatic hemangiomatosis (blue arrow) was noted (I: Arterial phase; J: Arterial phase; K: Venous phase; L: Venous phase); M-P: Twenty months after ablation, contrast-enhanced CT showed that the ablated zone (orange arrow) had decreased further, with obvious shrinkage of the subtle residual diffuse hepatic hemangiomatosis (blue arrow) (M: Arterial phase; N: Arterial phase; O: Venous phase; P: Venous phase).
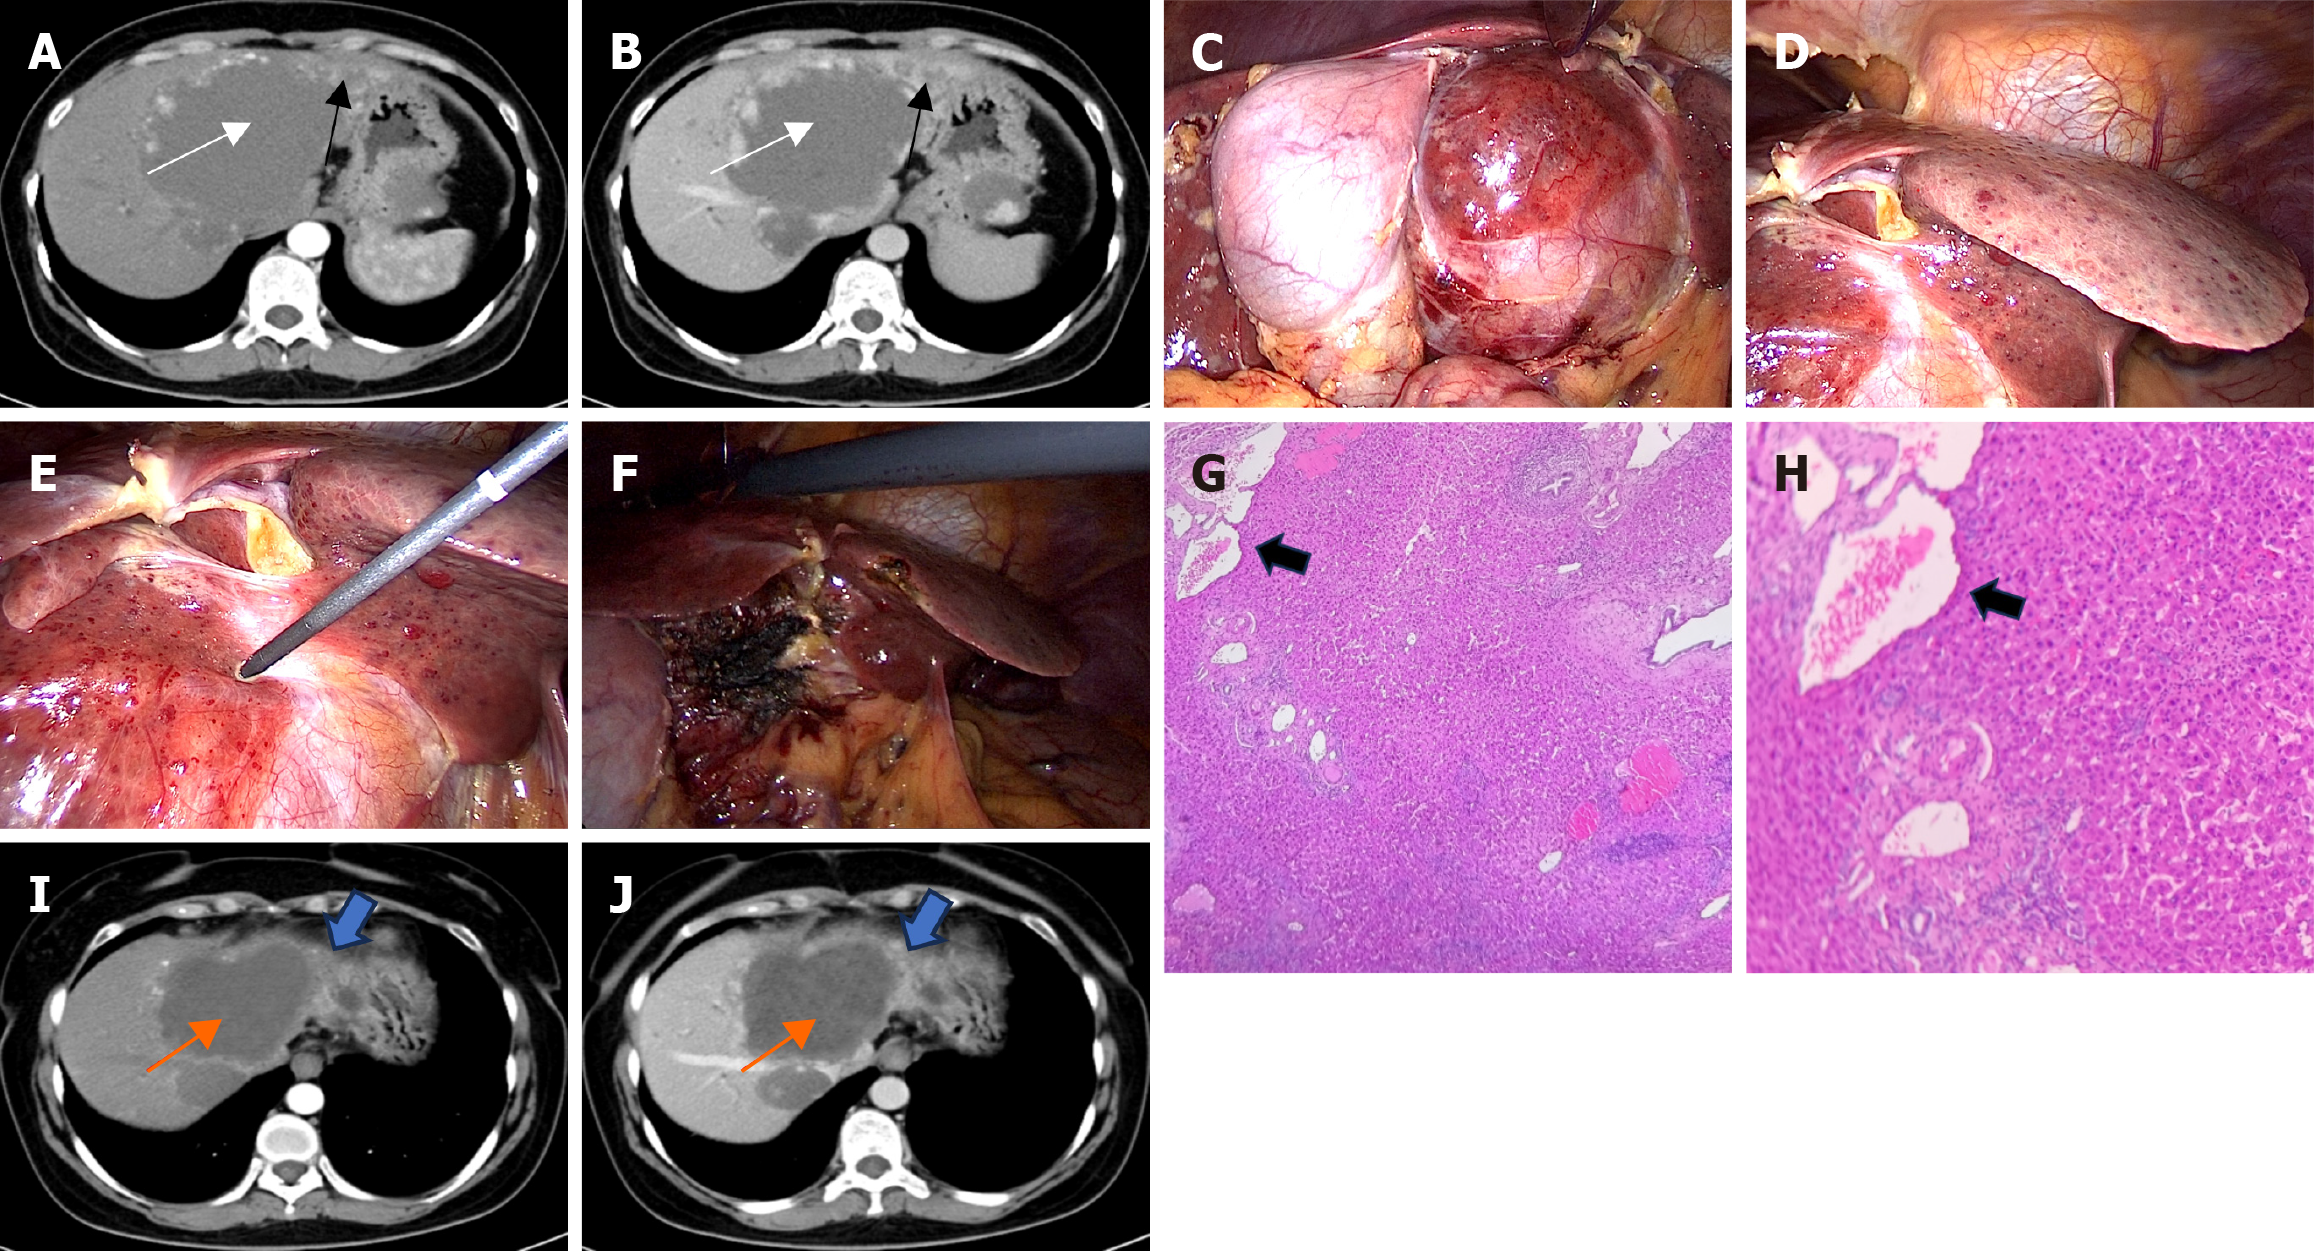
Figure 2 Initial contrast-enhanced computed tomography scan of the abdomen obtained, intraoperative findings, histological findings of resected liver tissue and follow-up contrast-enhanced computed tomography scan of the abdomen obtained of case 2.
A and B: Initial contrast-enhanced computed tomography (CT) scan of the abdomen obtained. A hemangioma (10.7 cm, white arrow) is evident in the liver, with multiple disseminated small enhanced nodular lesions (black arrow) adjacent to giant cavernous hemangioma (GCH) (A: Arterial phase; B: Venous phase); C: Intraoperative findings of complete GCH; D: Multiple small hemorrhagic blood-filled honeycomb areas from 2-3 mm up to 3 cm in diameter were scattered adjacent to the GCH throughout the entire left lobe; E: The first application was launched from the exterior margin of the GCH; F: After ablation, the ablated zone atrophied and collapsed. Diffuse hepatic hemangiomatosis was left in situ without ablation; G and H: Histological findings of resected liver tissue revealed that the large majority of the portal tracts and the central veins showed expansion due to the formation of micro-angiomas along with dilatation of the native vessels. And micro-angiomatous lesions characterized by irregular-shaped dilated vascular channels arranged along with sinusoidal dilatation with some accompanied by tumor-like proliferation and red blood cell siltation seen in the lumen, and the stroma was hyperplastic fibrous tissue. The lesion was lined with flat endothelial cells without cellular atypia (black arrowhead). This lesion was diagnosed as hemangiomatosis (hematoxylin and eosin staining, G: 5 ×; H: 10 ×); I and J: Follow-up contrast-enhanced CT scan of the abdomen obtained. Three months after ablation, contrast-enhanced CT revealed that the hemangioma was completely ablated, and the ablated zone (orange arrow) volume decreased; The reduction in the size of remained diffuse hepatic hemangiomatosis (blue arrow) was noted (I: Arterial phase, J: Venous phase).
- Citation: Xu F, Kong J, Dong SY, Xu L, Wang SH, Sun WB, Gao J. Laparoscopic microwave ablation for giant cavernous hemangioma coexistent with diffuse hepatic hemangiomatosis: Two case reports. World J Gastrointest Surg 2025; 17(3): 101697
- URL: https://www.wjgnet.com/1948-9366/full/v17/i3/101697.htm
- DOI: https://dx.doi.org/10.4240/wjgs.v17.i3.101697


