Copyright
©The Author(s) 2025.
World J Gastrointest Surg. Mar 27, 2025; 17(3): 101002
Published online Mar 27, 2025. doi: 10.4240/wjgs.v17.i3.101002
Published online Mar 27, 2025. doi: 10.4240/wjgs.v17.i3.101002
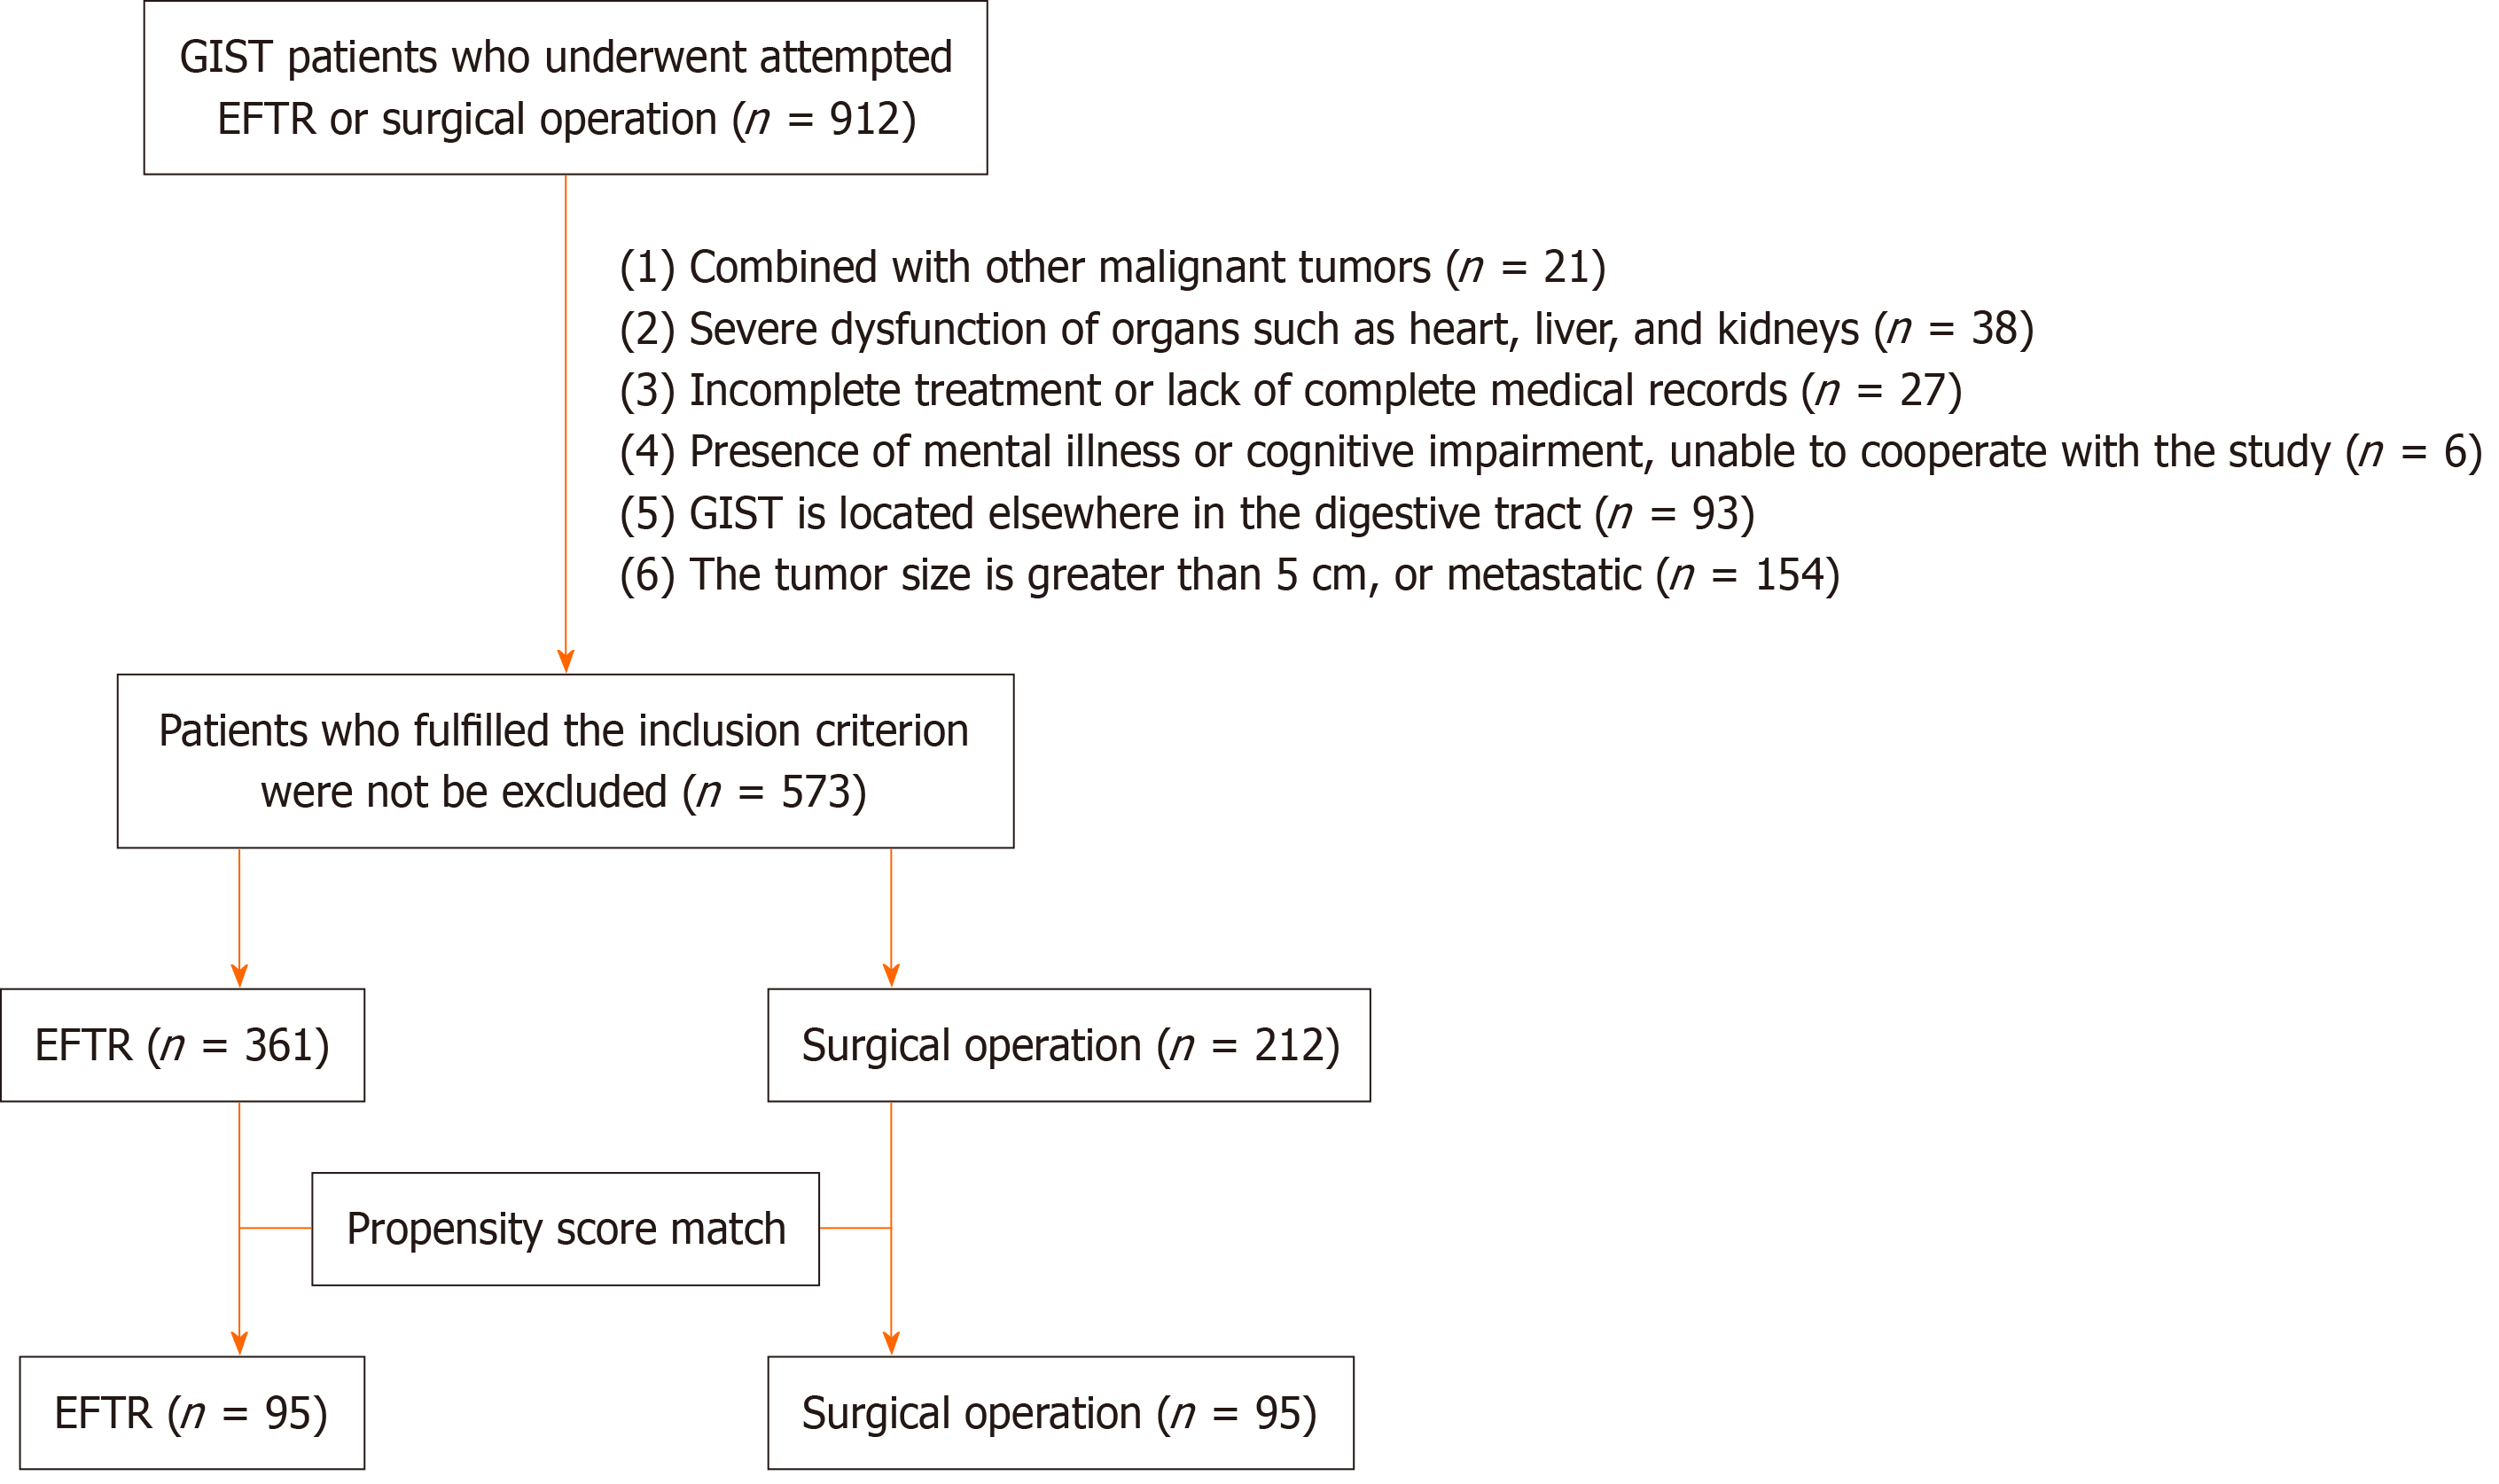
Figure 1 Flow diagram of the study.
GIST: Gastrointestinal stromal tumor; EFTR: Endoscopic full-thickness resection.
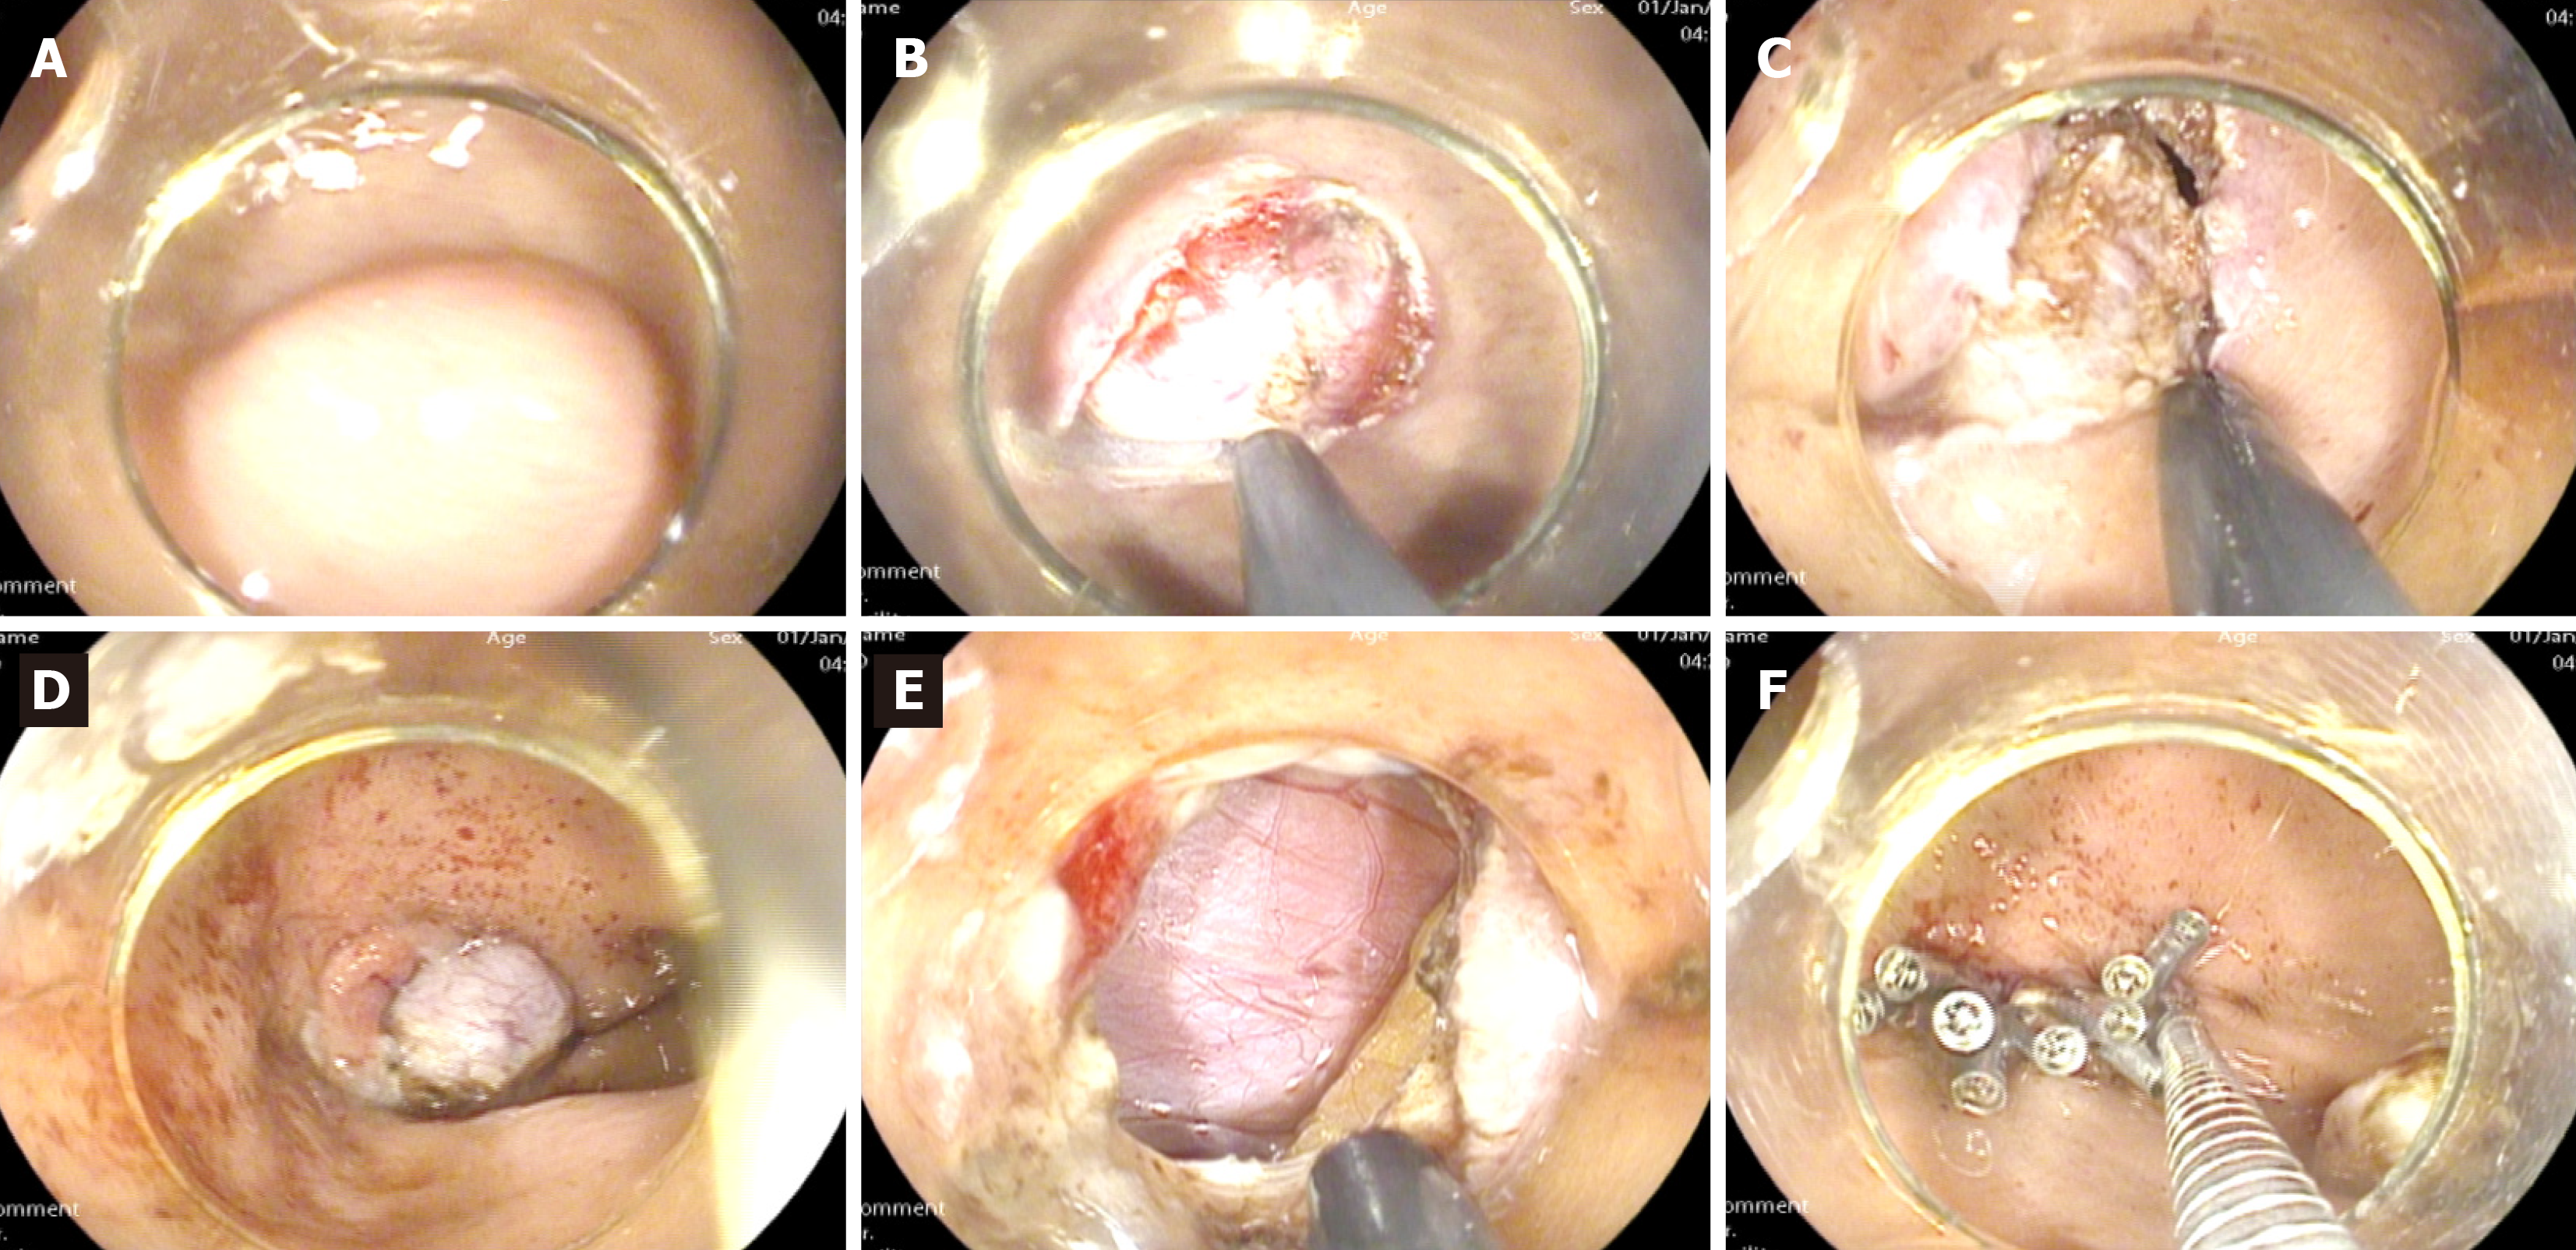
Figure 2 Intraoperative images of endoscopic full-thickness resection.
A: White light observation, locating the submucosal tumor; B: Incision of the tumor's superficial mucosa; C: Layer-by-layer dissection, timely electrocoagulation for hemostasis; D: Complete exposure of the tumor; E: Tumor resection, with full-thickness gastric wall resection visible; F: Closure of the wound using a metal clip.
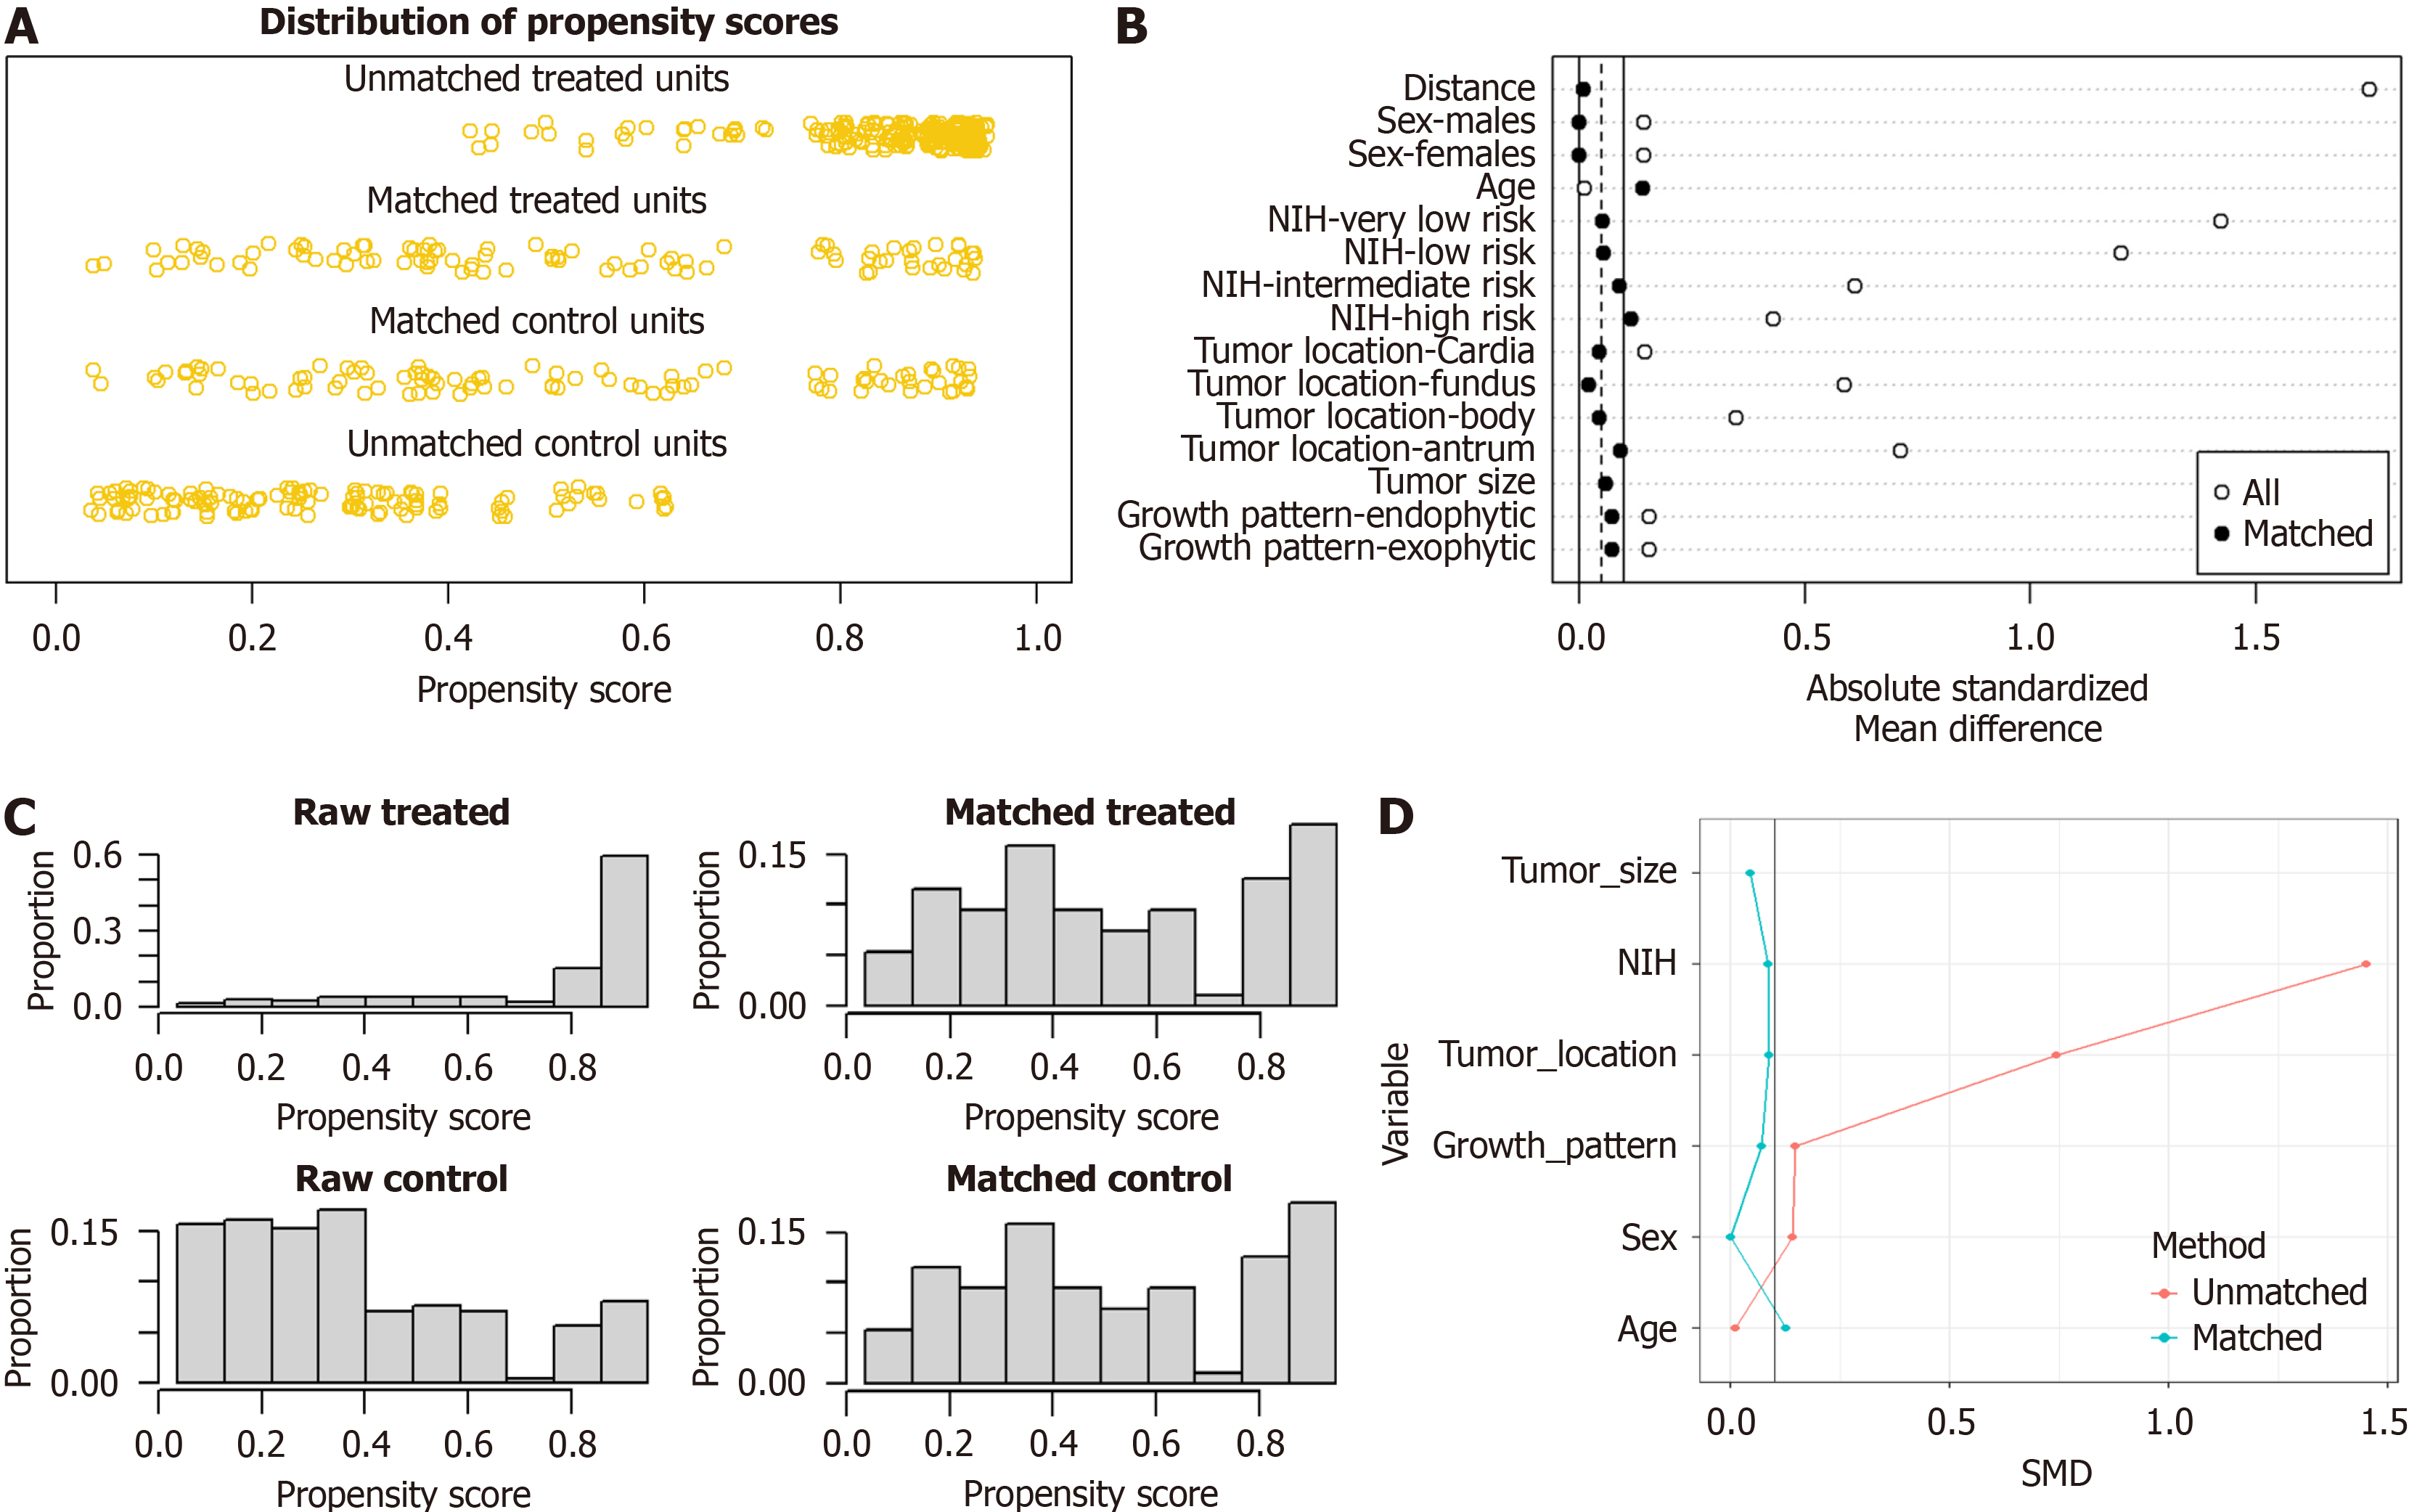
Figure 3 Data balance before and after propensity score matching.
A: Jitter plot of cohort before and after propensity score matching (PSM); B: Standardized mean difference before and after PSM; C: Histogram of propensity scores; D: Line plot of individual differences before and after PSM. SMD: Standardized mean difference.
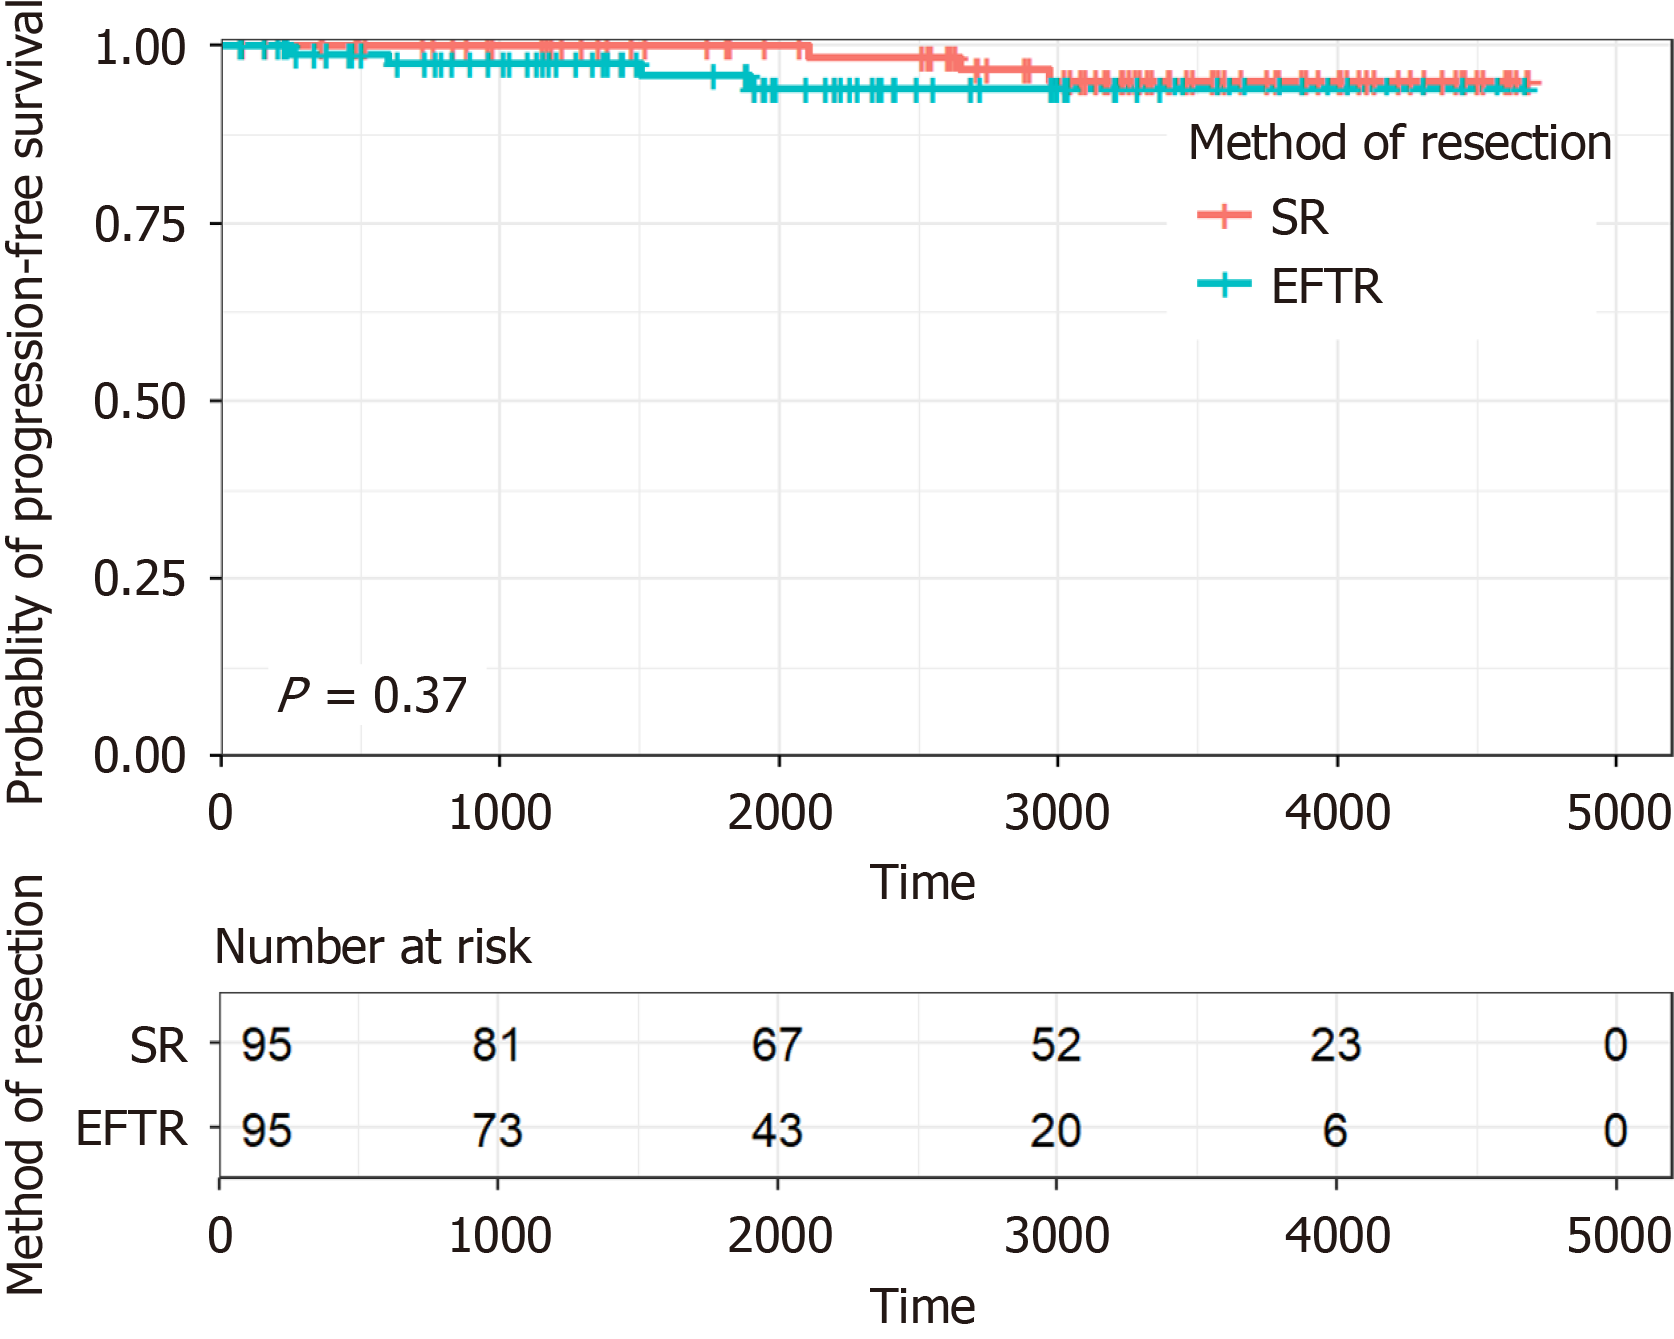
Figure 4 Kaplan-Meier survival analysis of progression-free survival.
SR: Surgical resection; EFTR: Endoscopic full-thickness resection.
- Citation: Zhao SQ, Wang SY, Ge N, Guo JT, Liu X, Wang GX, Su L, Sun SY, Wang S. Endoscopic full-thickness resection vs surgical resection for gastric stromal tumors: Efficacy and safety using propensity score matching. World J Gastrointest Surg 2025; 17(3): 101002
- URL: https://www.wjgnet.com/1948-9366/full/v17/i3/101002.htm
- DOI: https://dx.doi.org/10.4240/wjgs.v17.i3.101002


