Copyright
©The Author(s) 2025.
World J Gastrointest Surg. Jan 27, 2025; 17(1): 100790
Published online Jan 27, 2025. doi: 10.4240/wjgs.v17.i1.100790
Published online Jan 27, 2025. doi: 10.4240/wjgs.v17.i1.100790
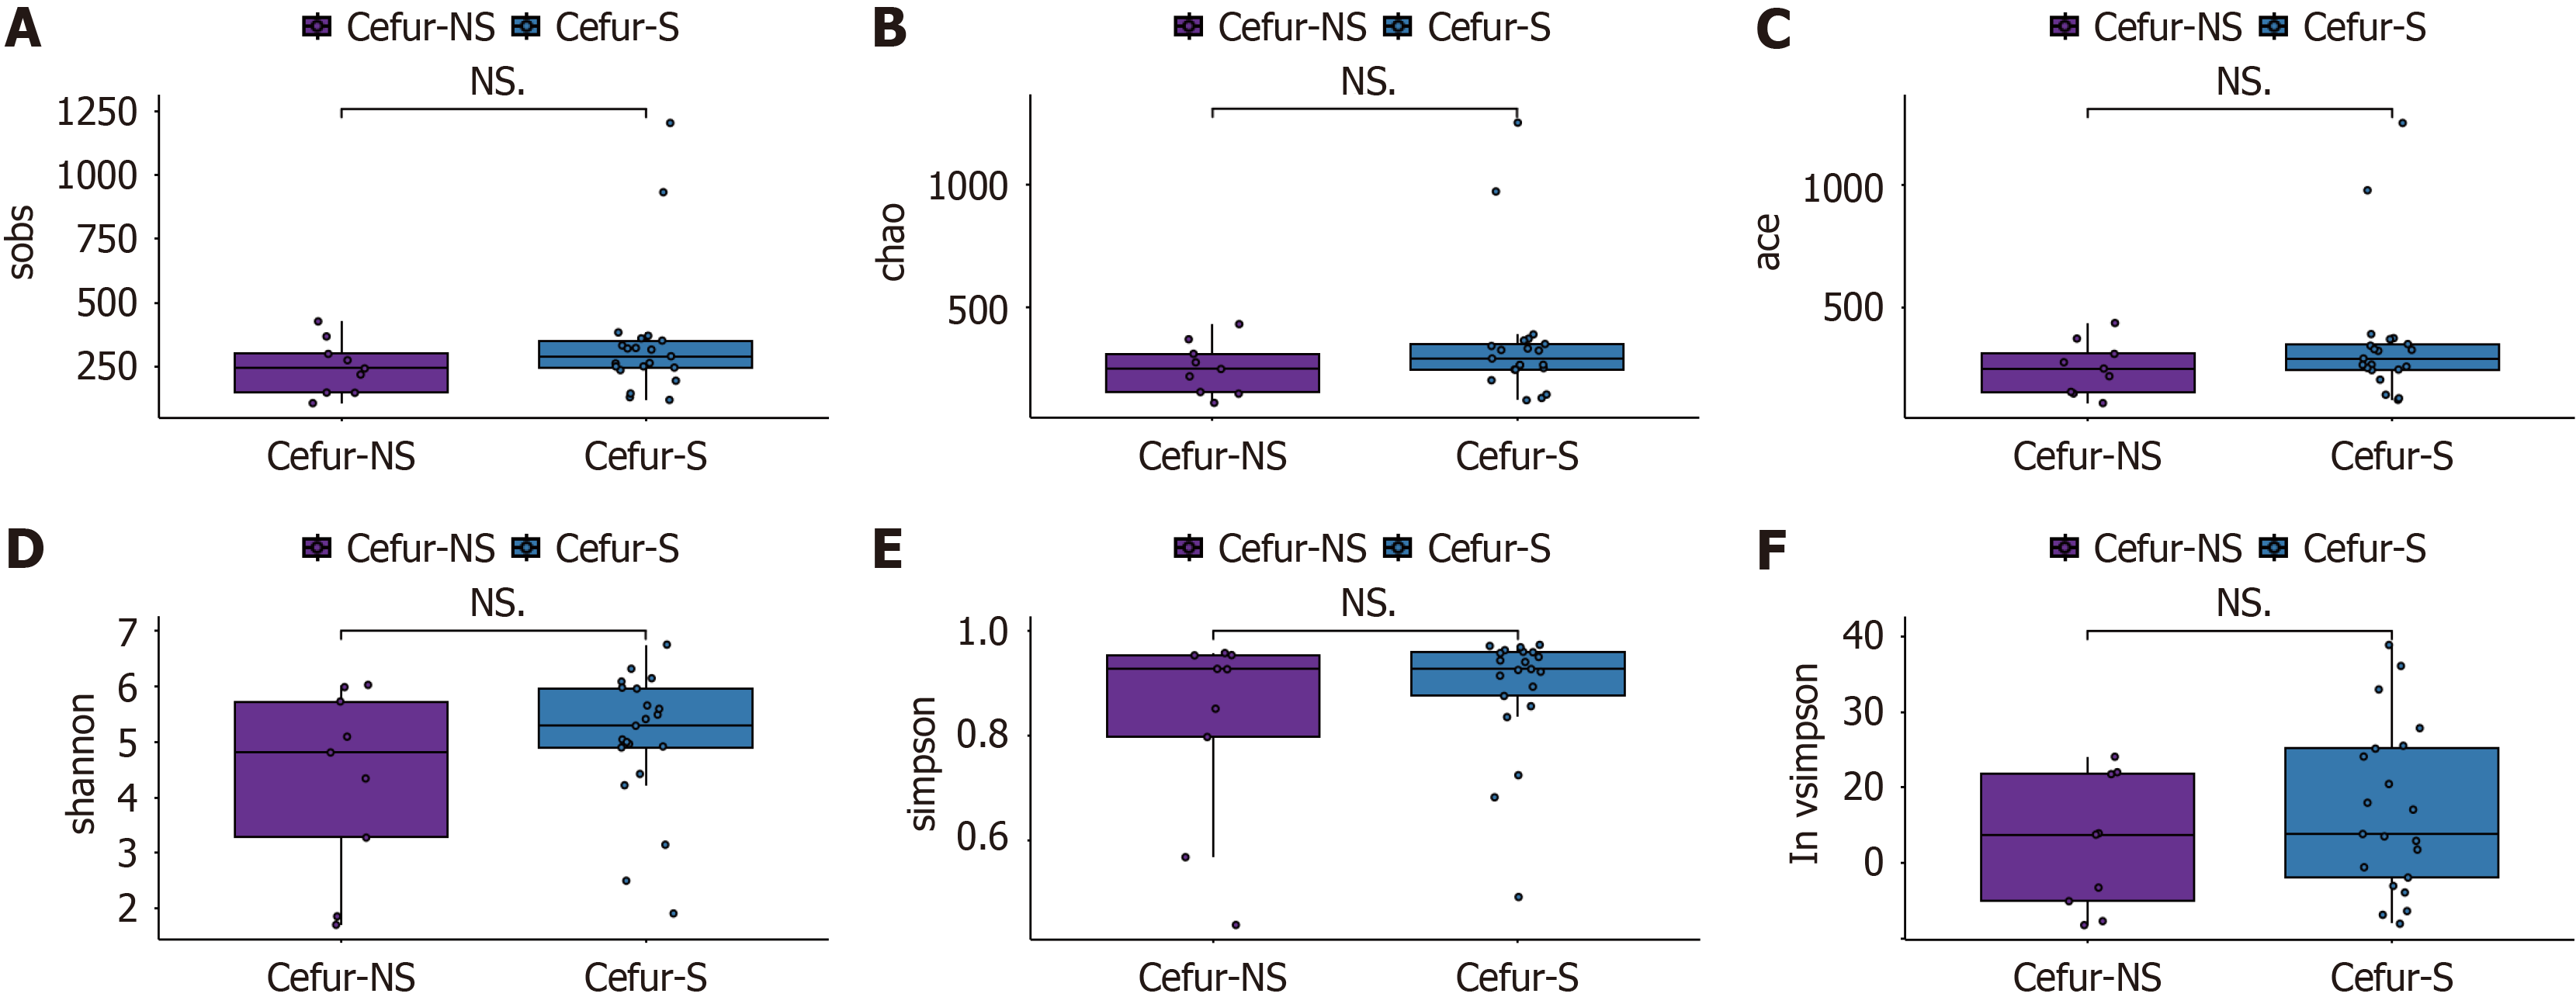
Figure 1 Comparison of alpha diversity between cefuroxime-sensitive group and cefuroxime-resistant group based on different methods.
A: Observed species; B: Chao1; C: ACE: Abundance-based coverage estimator; D: Shannon; E: Simpson; F: Inverse Simpson. Cefur-S: Cefuroxime-sensitive; Cefur-NS: Cefuroxime-resistant.
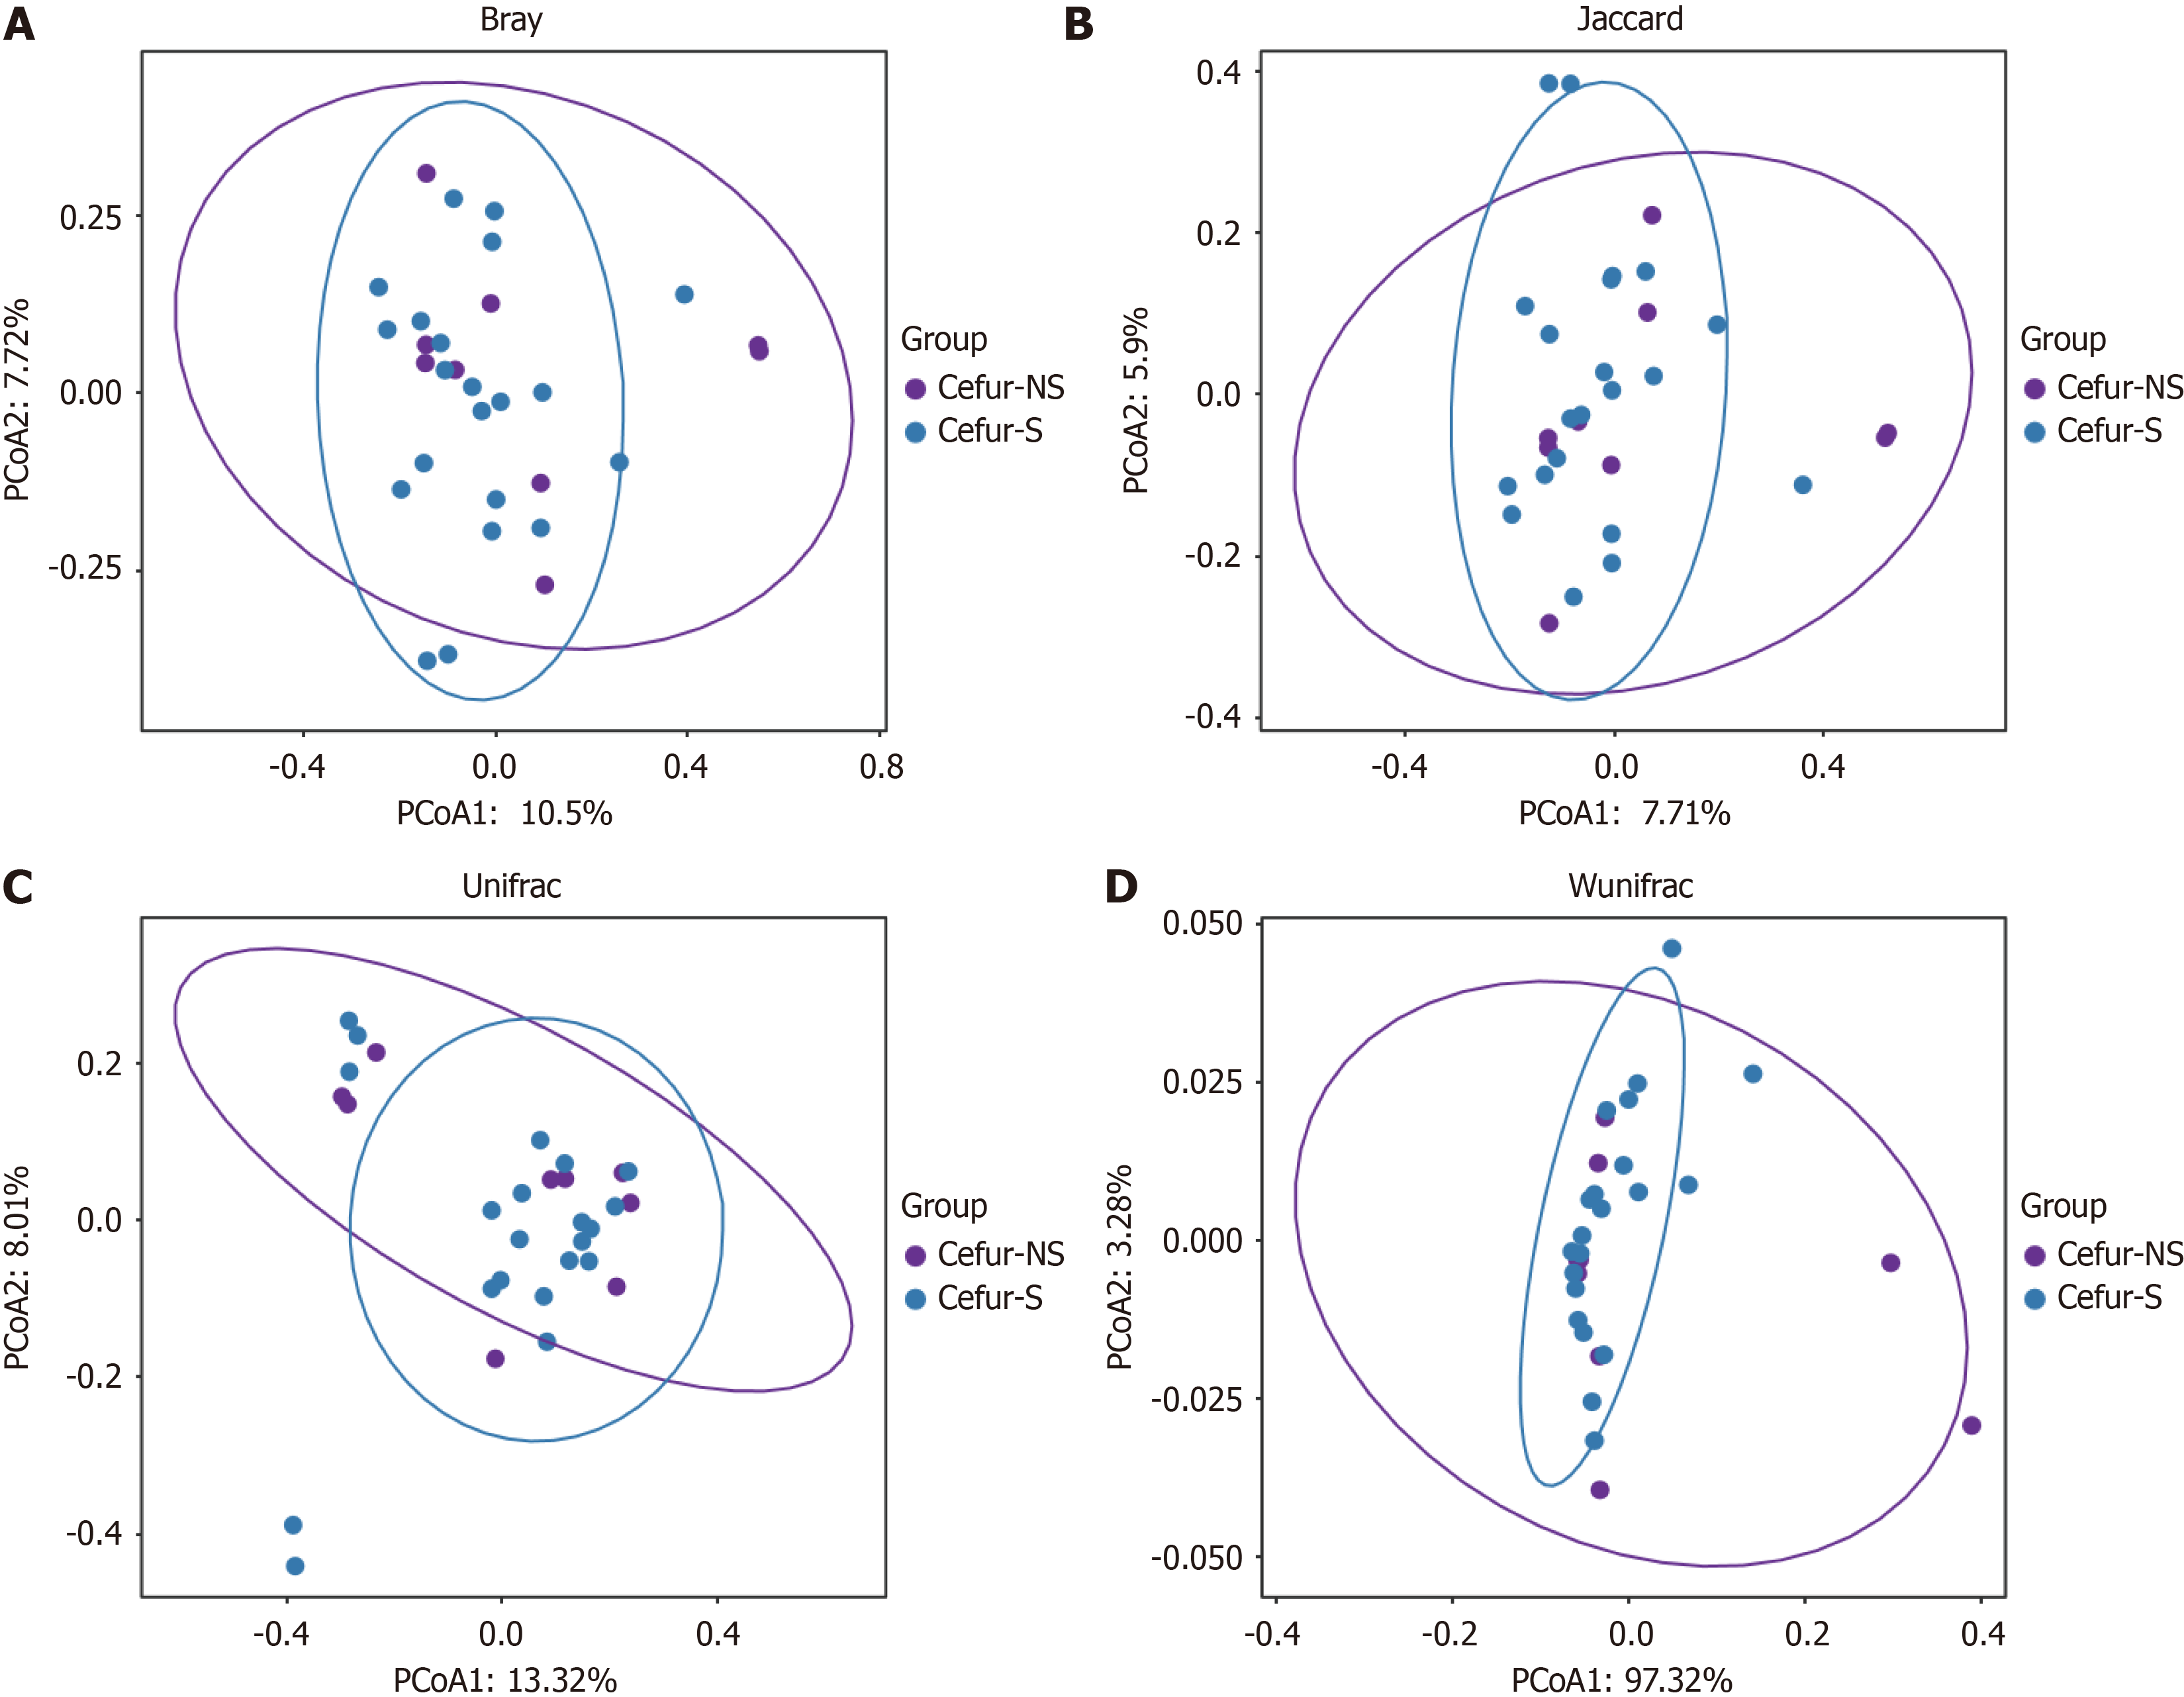
Figure 2 Comparison of beta diversity between cefuroxime-sensitive group and cefuroxime-resistant group based on different methods.
A: Bray-Crutis; B: Jaccard; C: Unweighted unifrac; D: Weighted unifrac. Cefur-S: Cefuroxime-sensitive; Cefur-NS: Cefuroxime-resistant.
Figure 3 Linear discriminant analysis effect size analysis between cefuroxime-resistant and cefuroxime-sensitive.
A: The cladogram of the linear discriminant analysis effect size result; B: The barplot of linear discriminant analysis score in cefuroxime-sensitive group. Cefur-S: Cefuroxime-sensitive; LDA: Linear discriminant analysis.
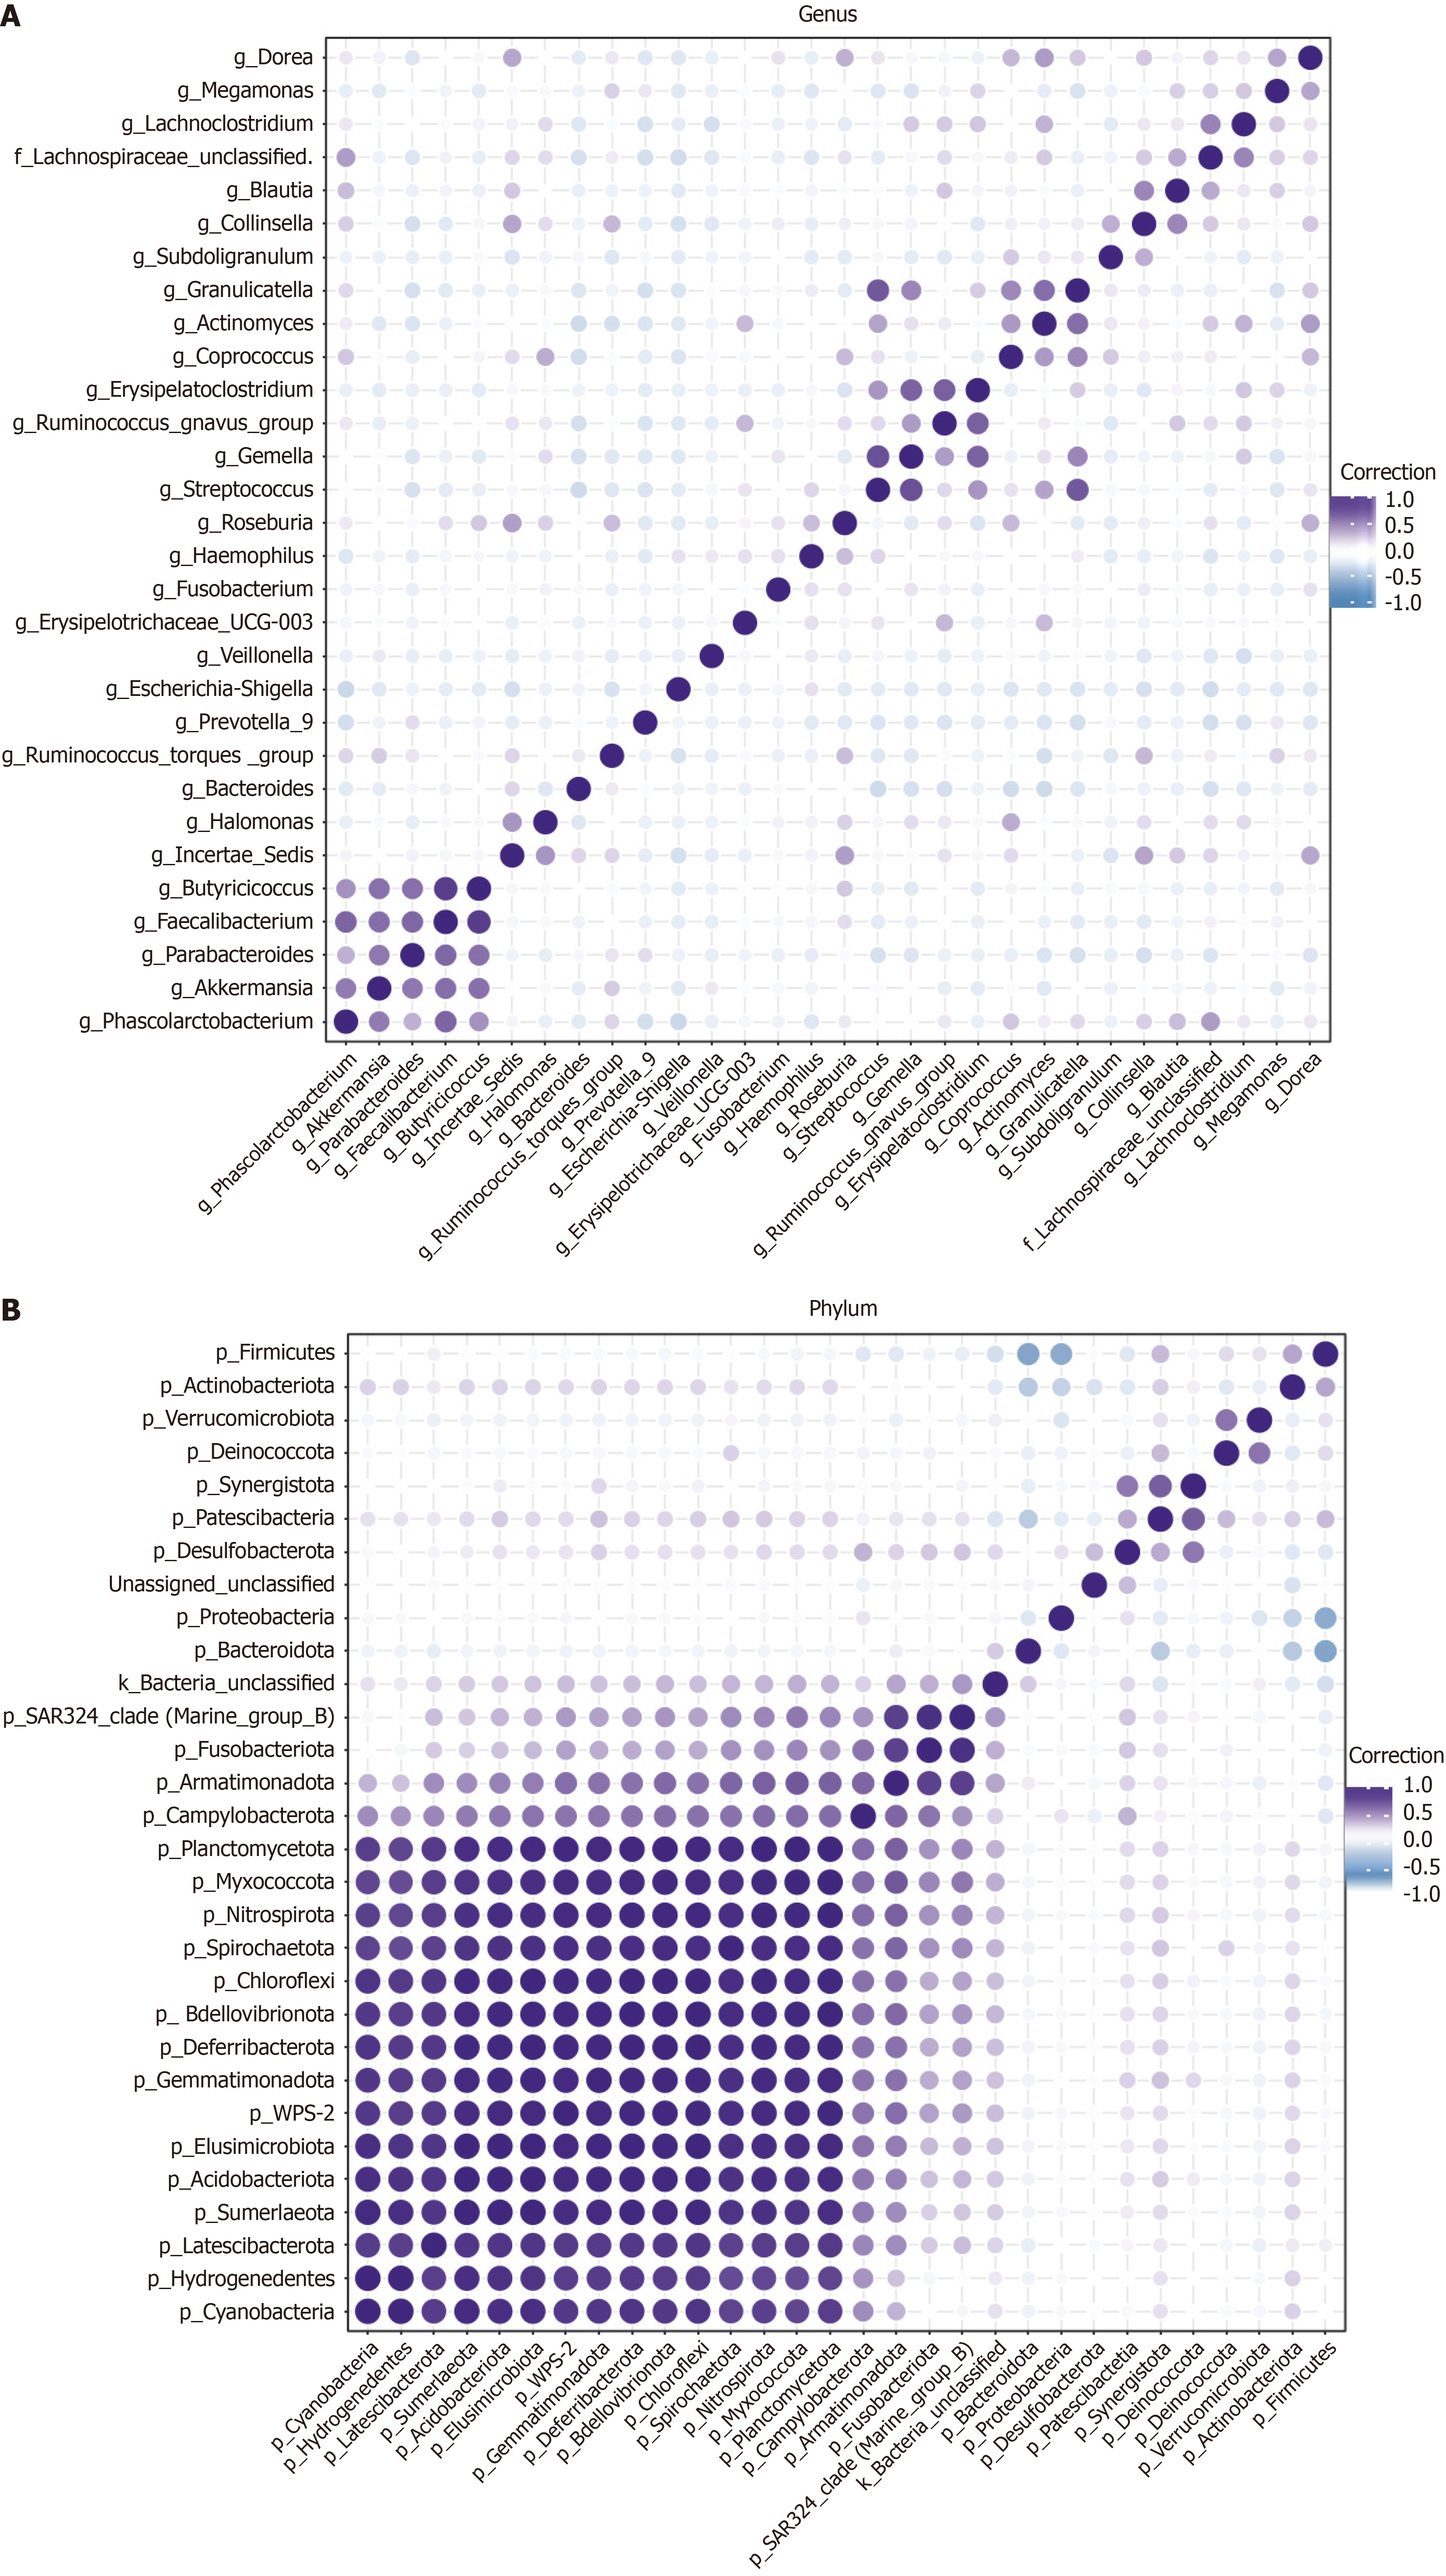
Figure 4 Correlation analysis of the bacterial community.
A: Heatmap depicting correlations at the genus level; B: Heatmap depicting correlations at the phylum level.
- Citation: Ling YT, Yao F, Li SJ, Cao CX, Chen ZW, Qiu M, Li BZ, Hu BW, Zhong SY, Hu GL, Li JH. Microbiota in patients with cefuroxime resistance and anal fistula revealed by 16S ribosomal DNA. World J Gastrointest Surg 2025; 17(1): 100790
- URL: https://www.wjgnet.com/1948-9366/full/v17/i1/100790.htm
- DOI: https://dx.doi.org/10.4240/wjgs.v17.i1.100790


