Copyright
©The Author(s) 2024.
World J Gastrointest Surg. Sep 27, 2024; 16(9): 3008-3019
Published online Sep 27, 2024. doi: 10.4240/wjgs.v16.i9.3008
Published online Sep 27, 2024. doi: 10.4240/wjgs.v16.i9.3008
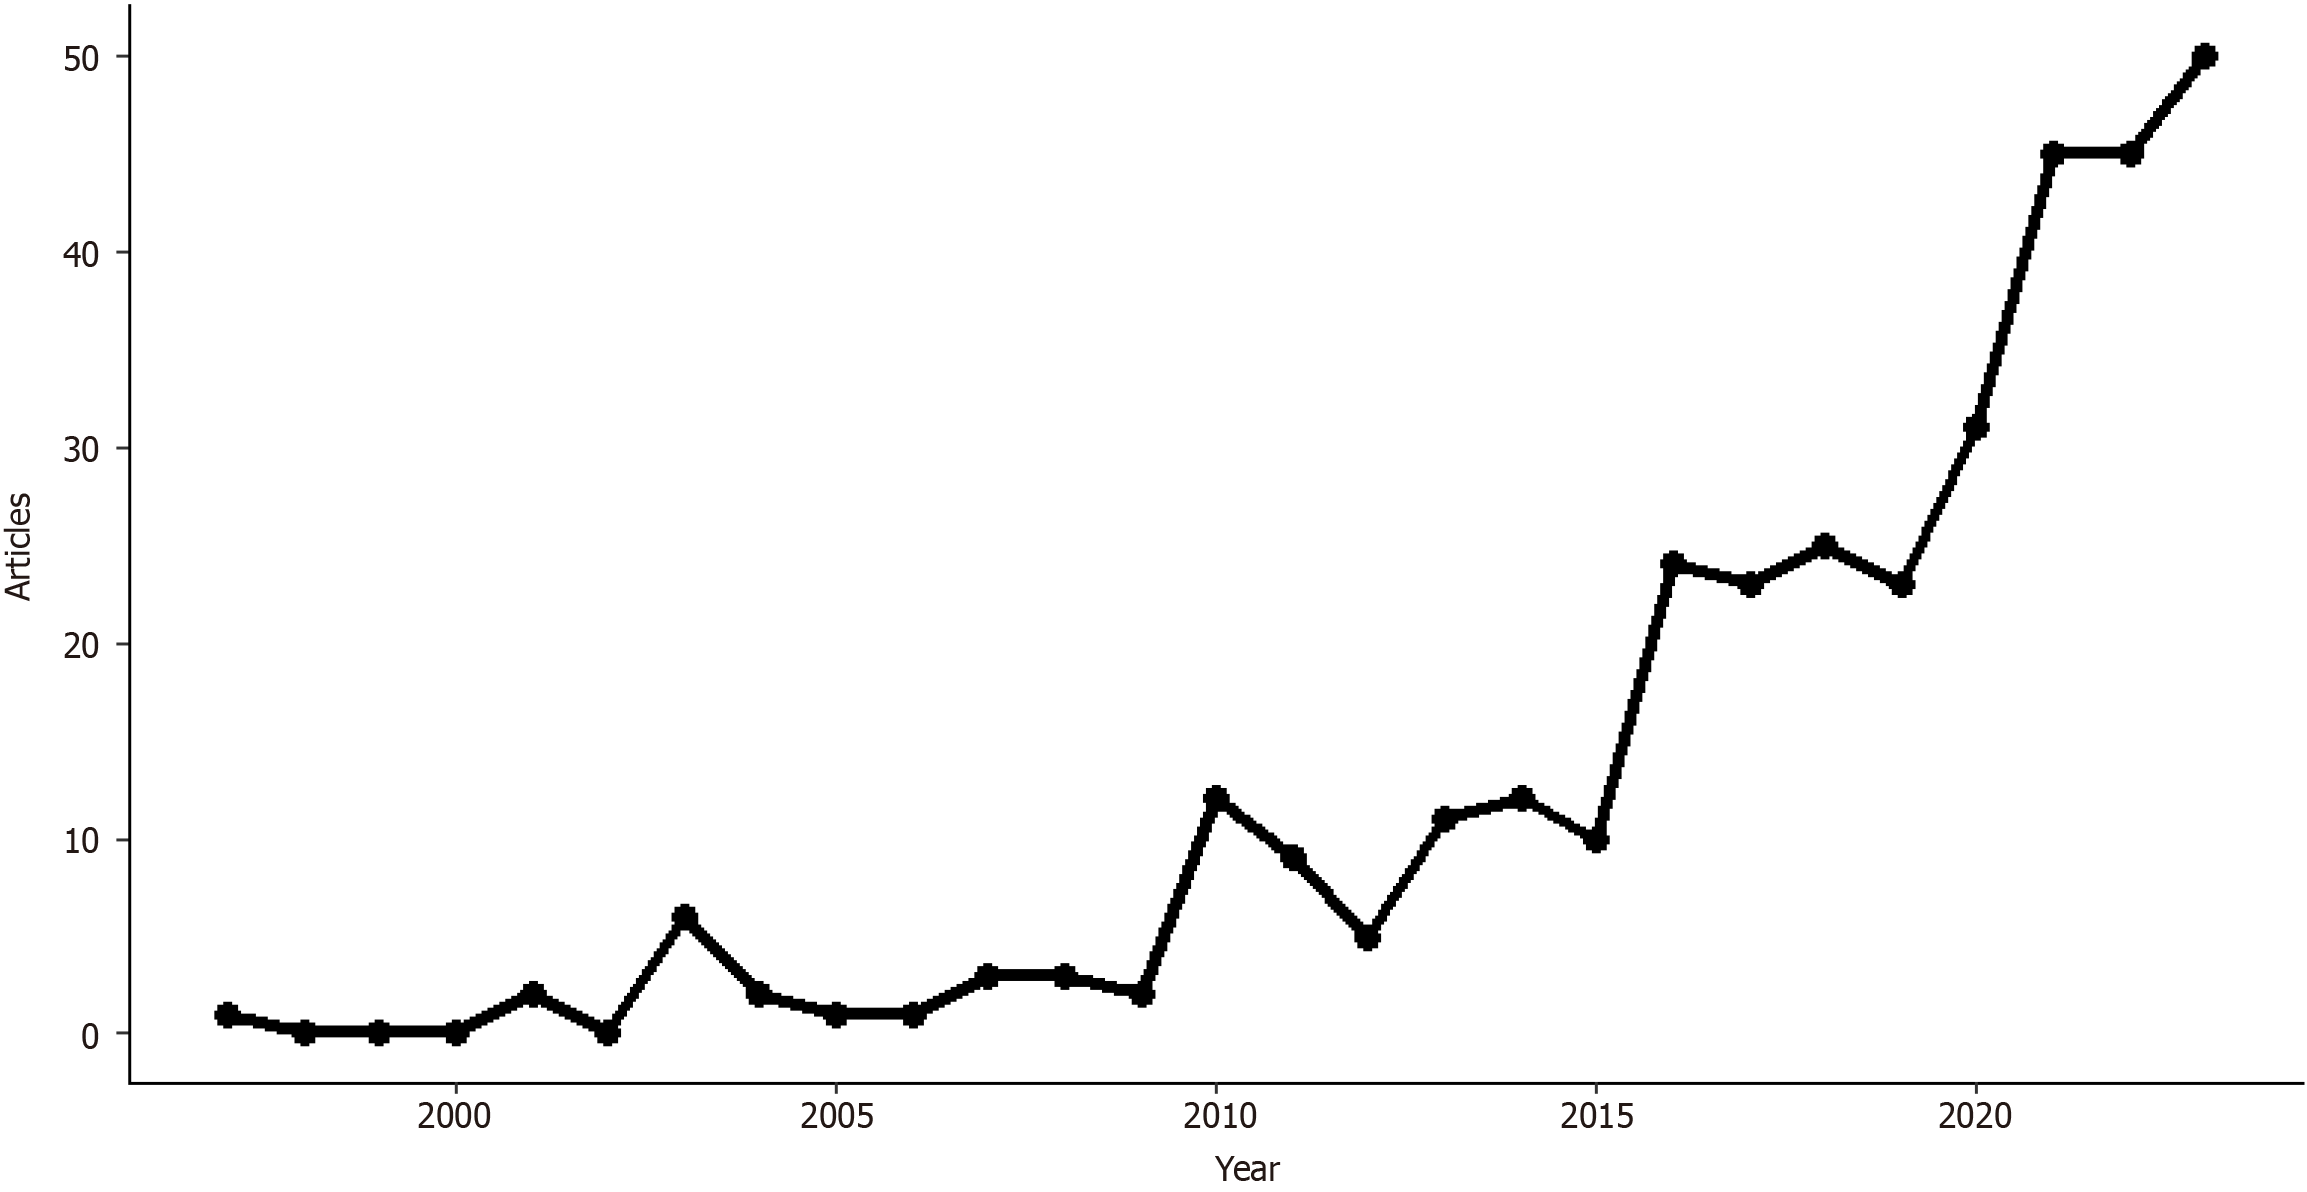
Figure 1
The trend number of articles from 1997 to 2023 in robot-assisted surgery in gastrointestinal and liver surgery.
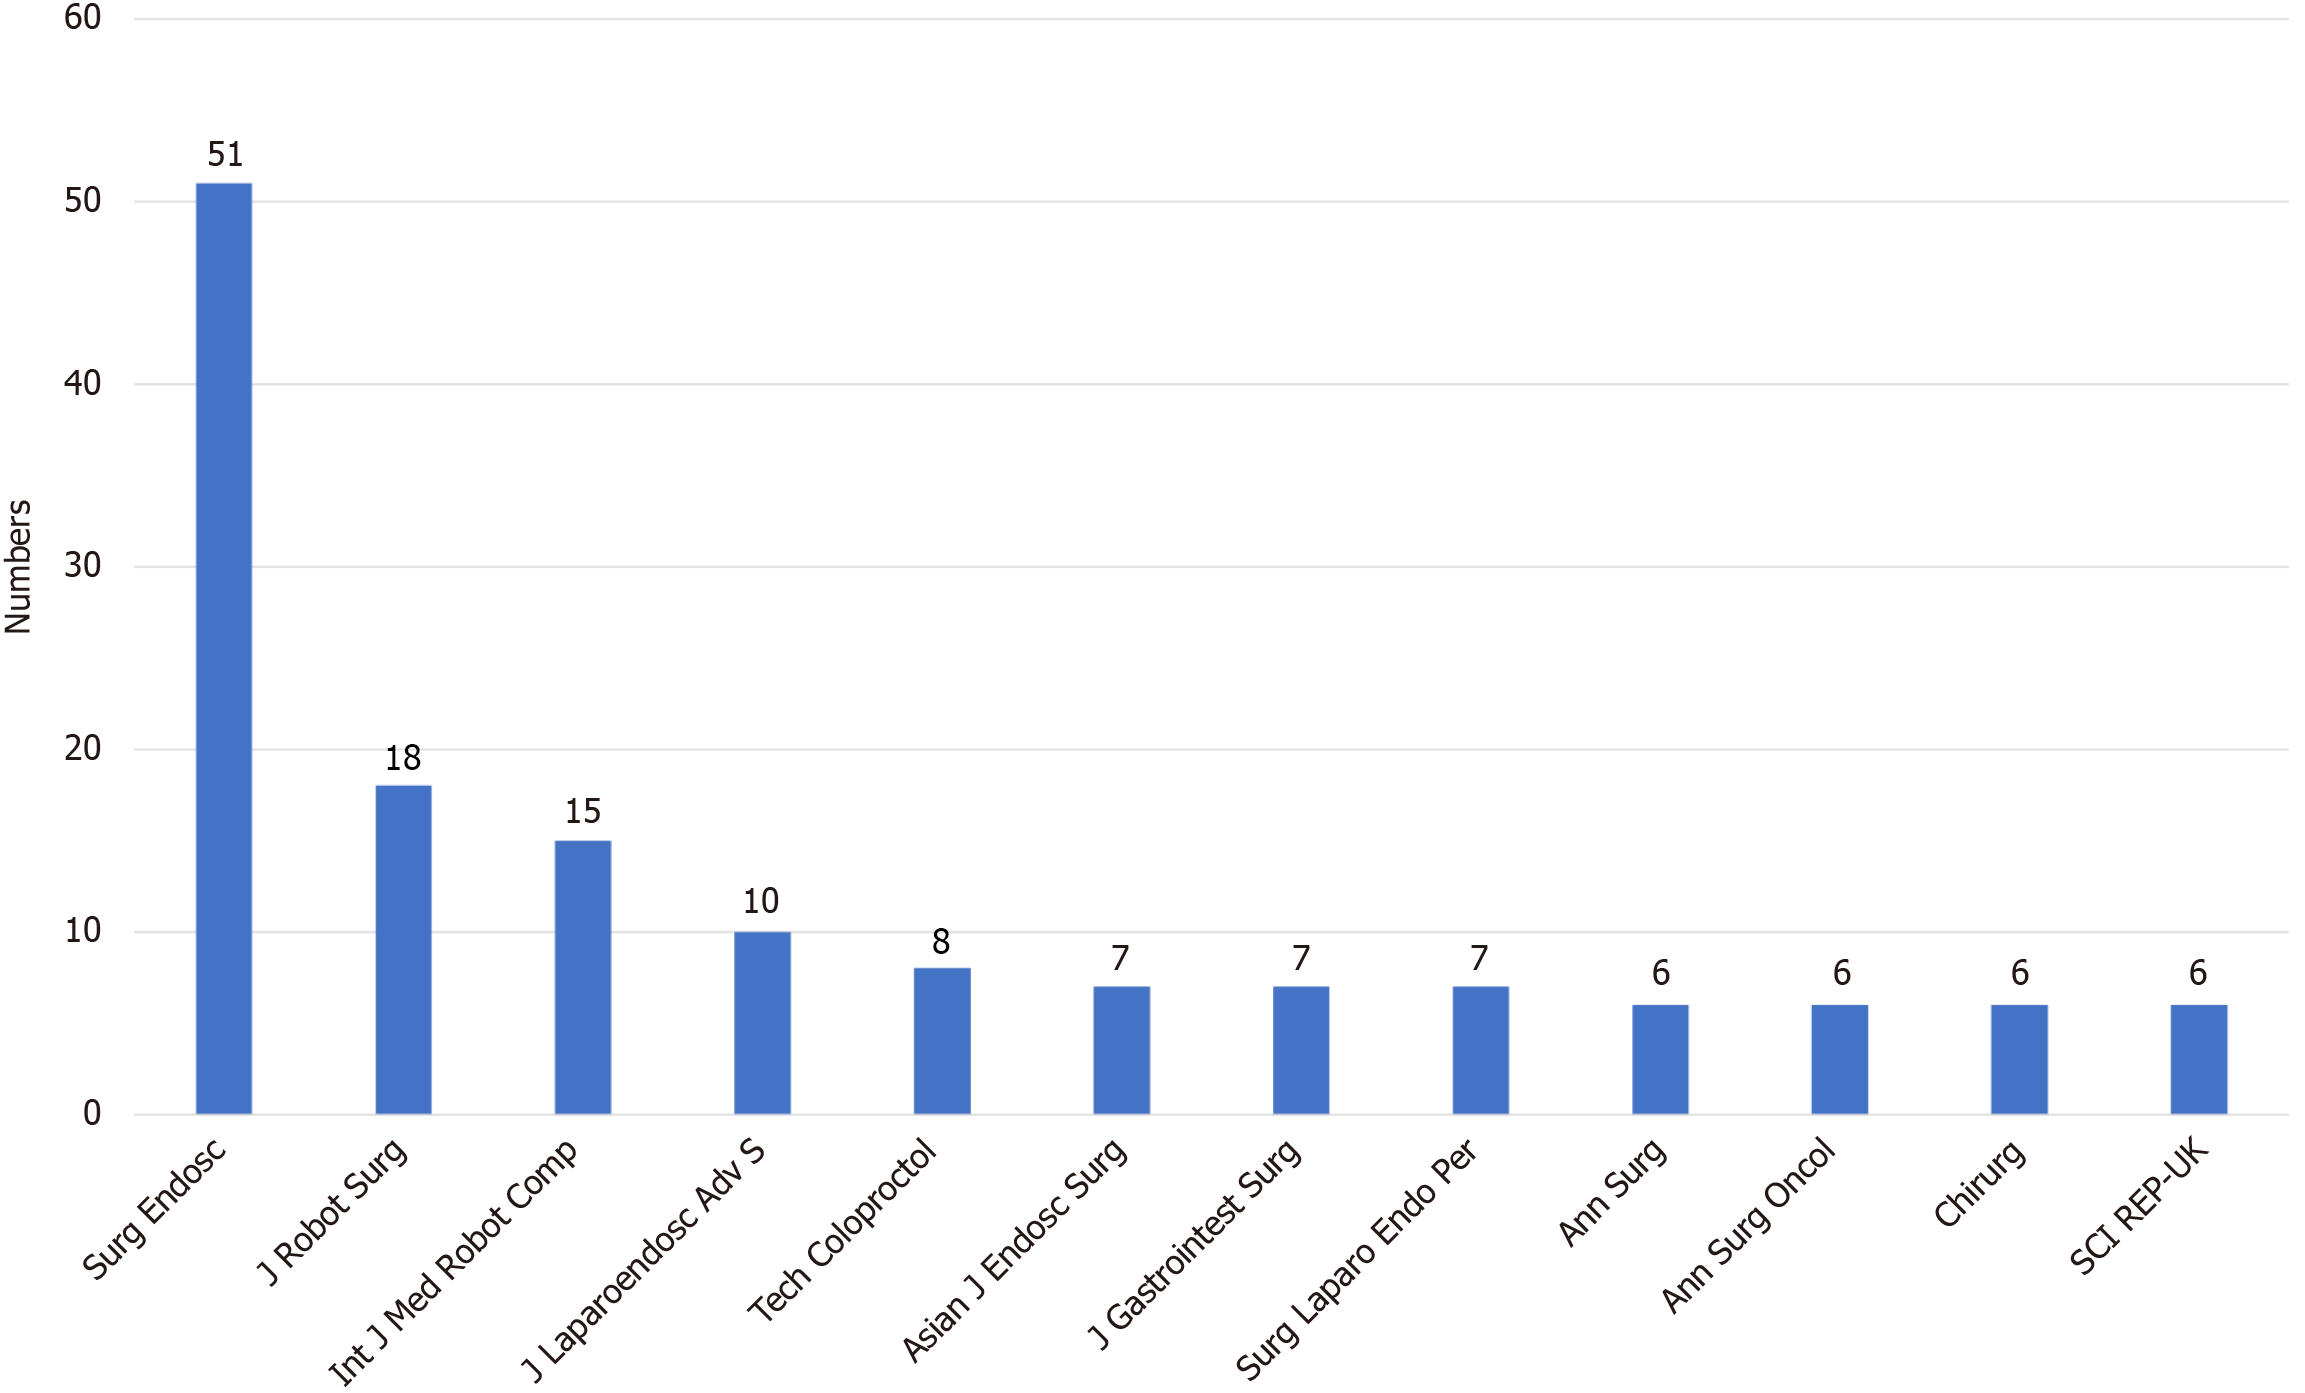
Figure 2
The journals with the most published and more than 6 articles.
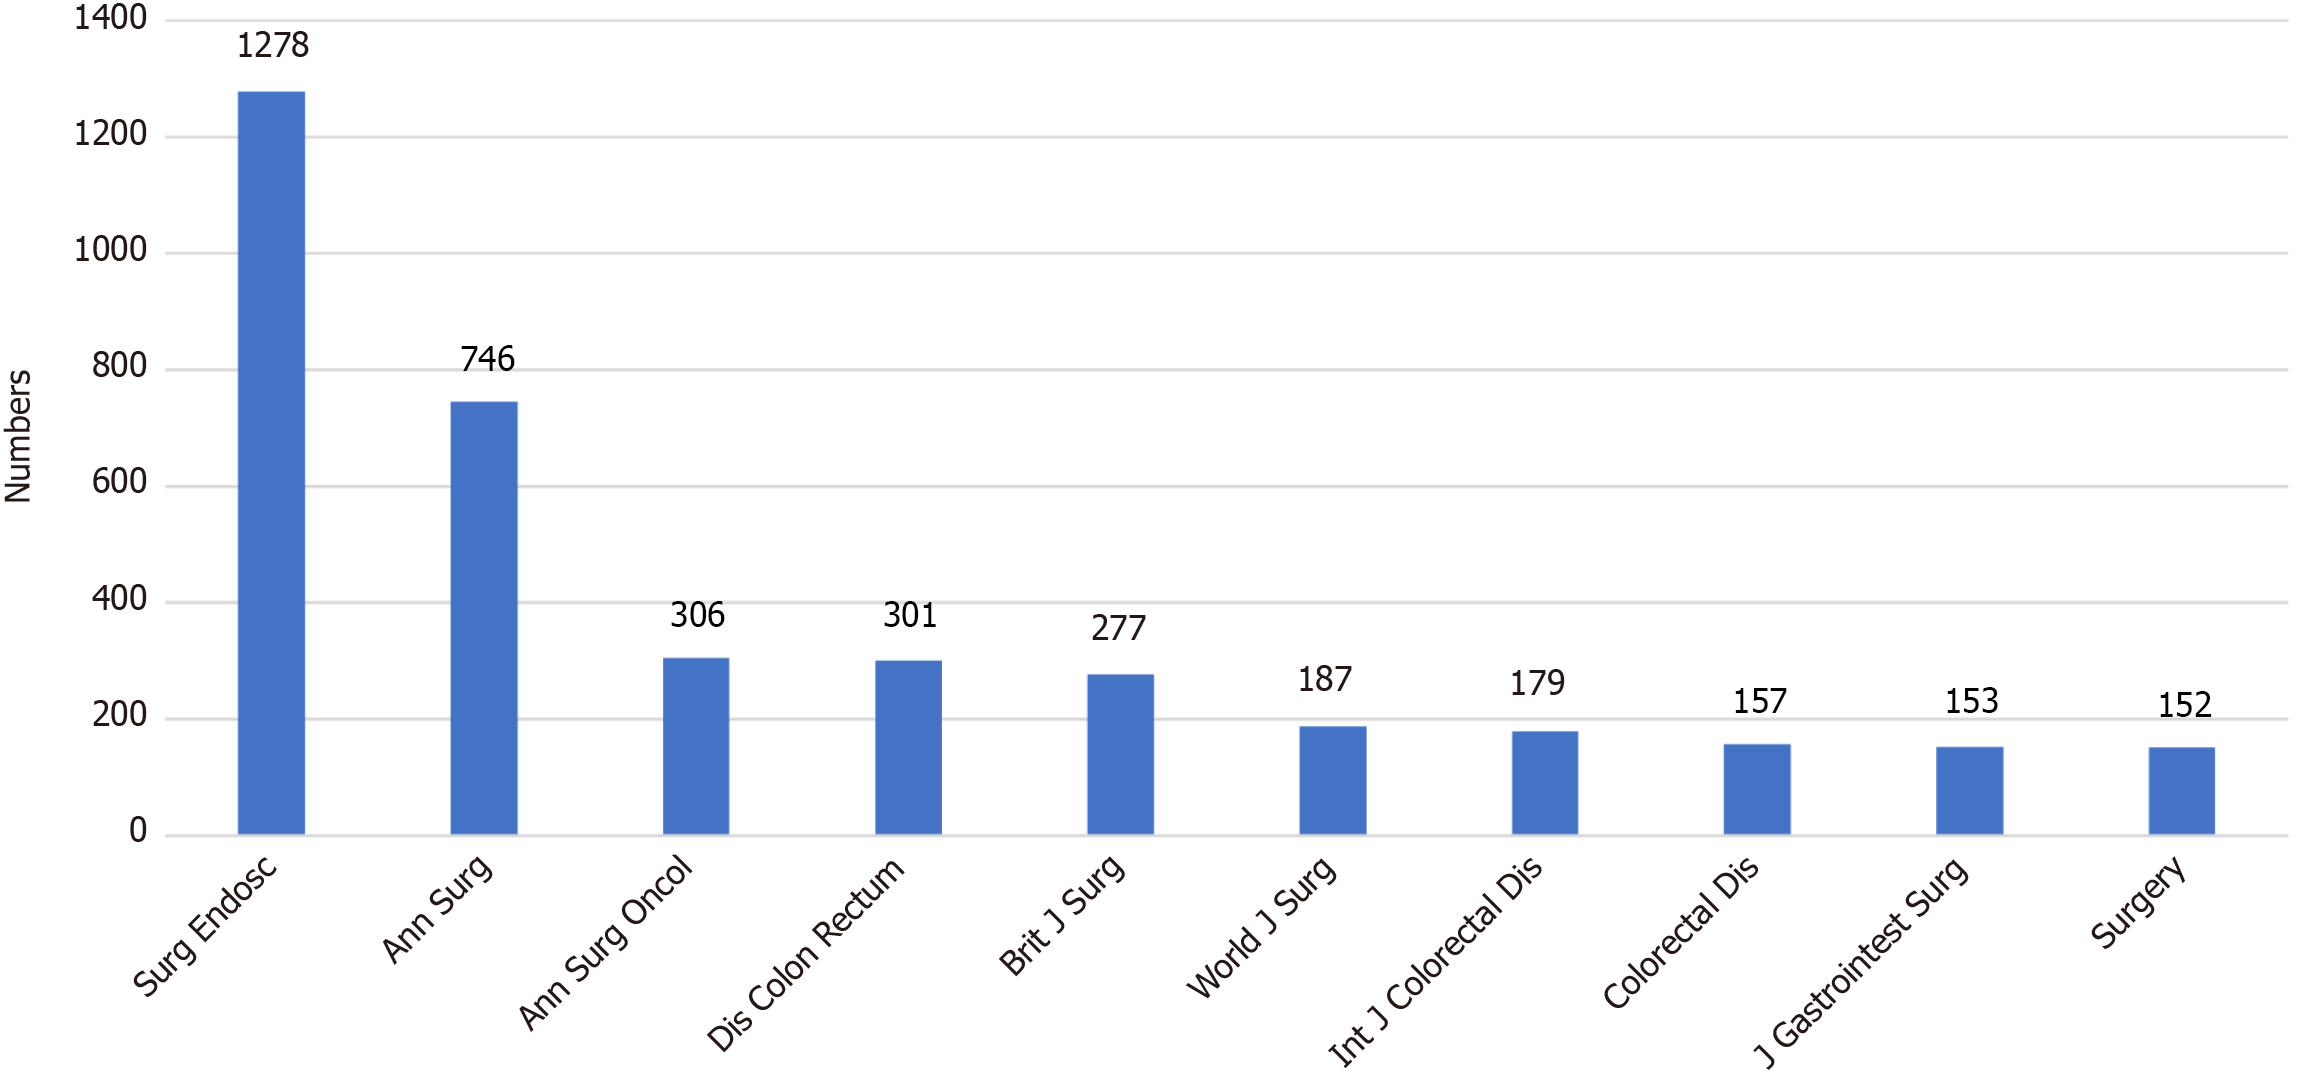
Figure 3
The top 10 most cited journals.
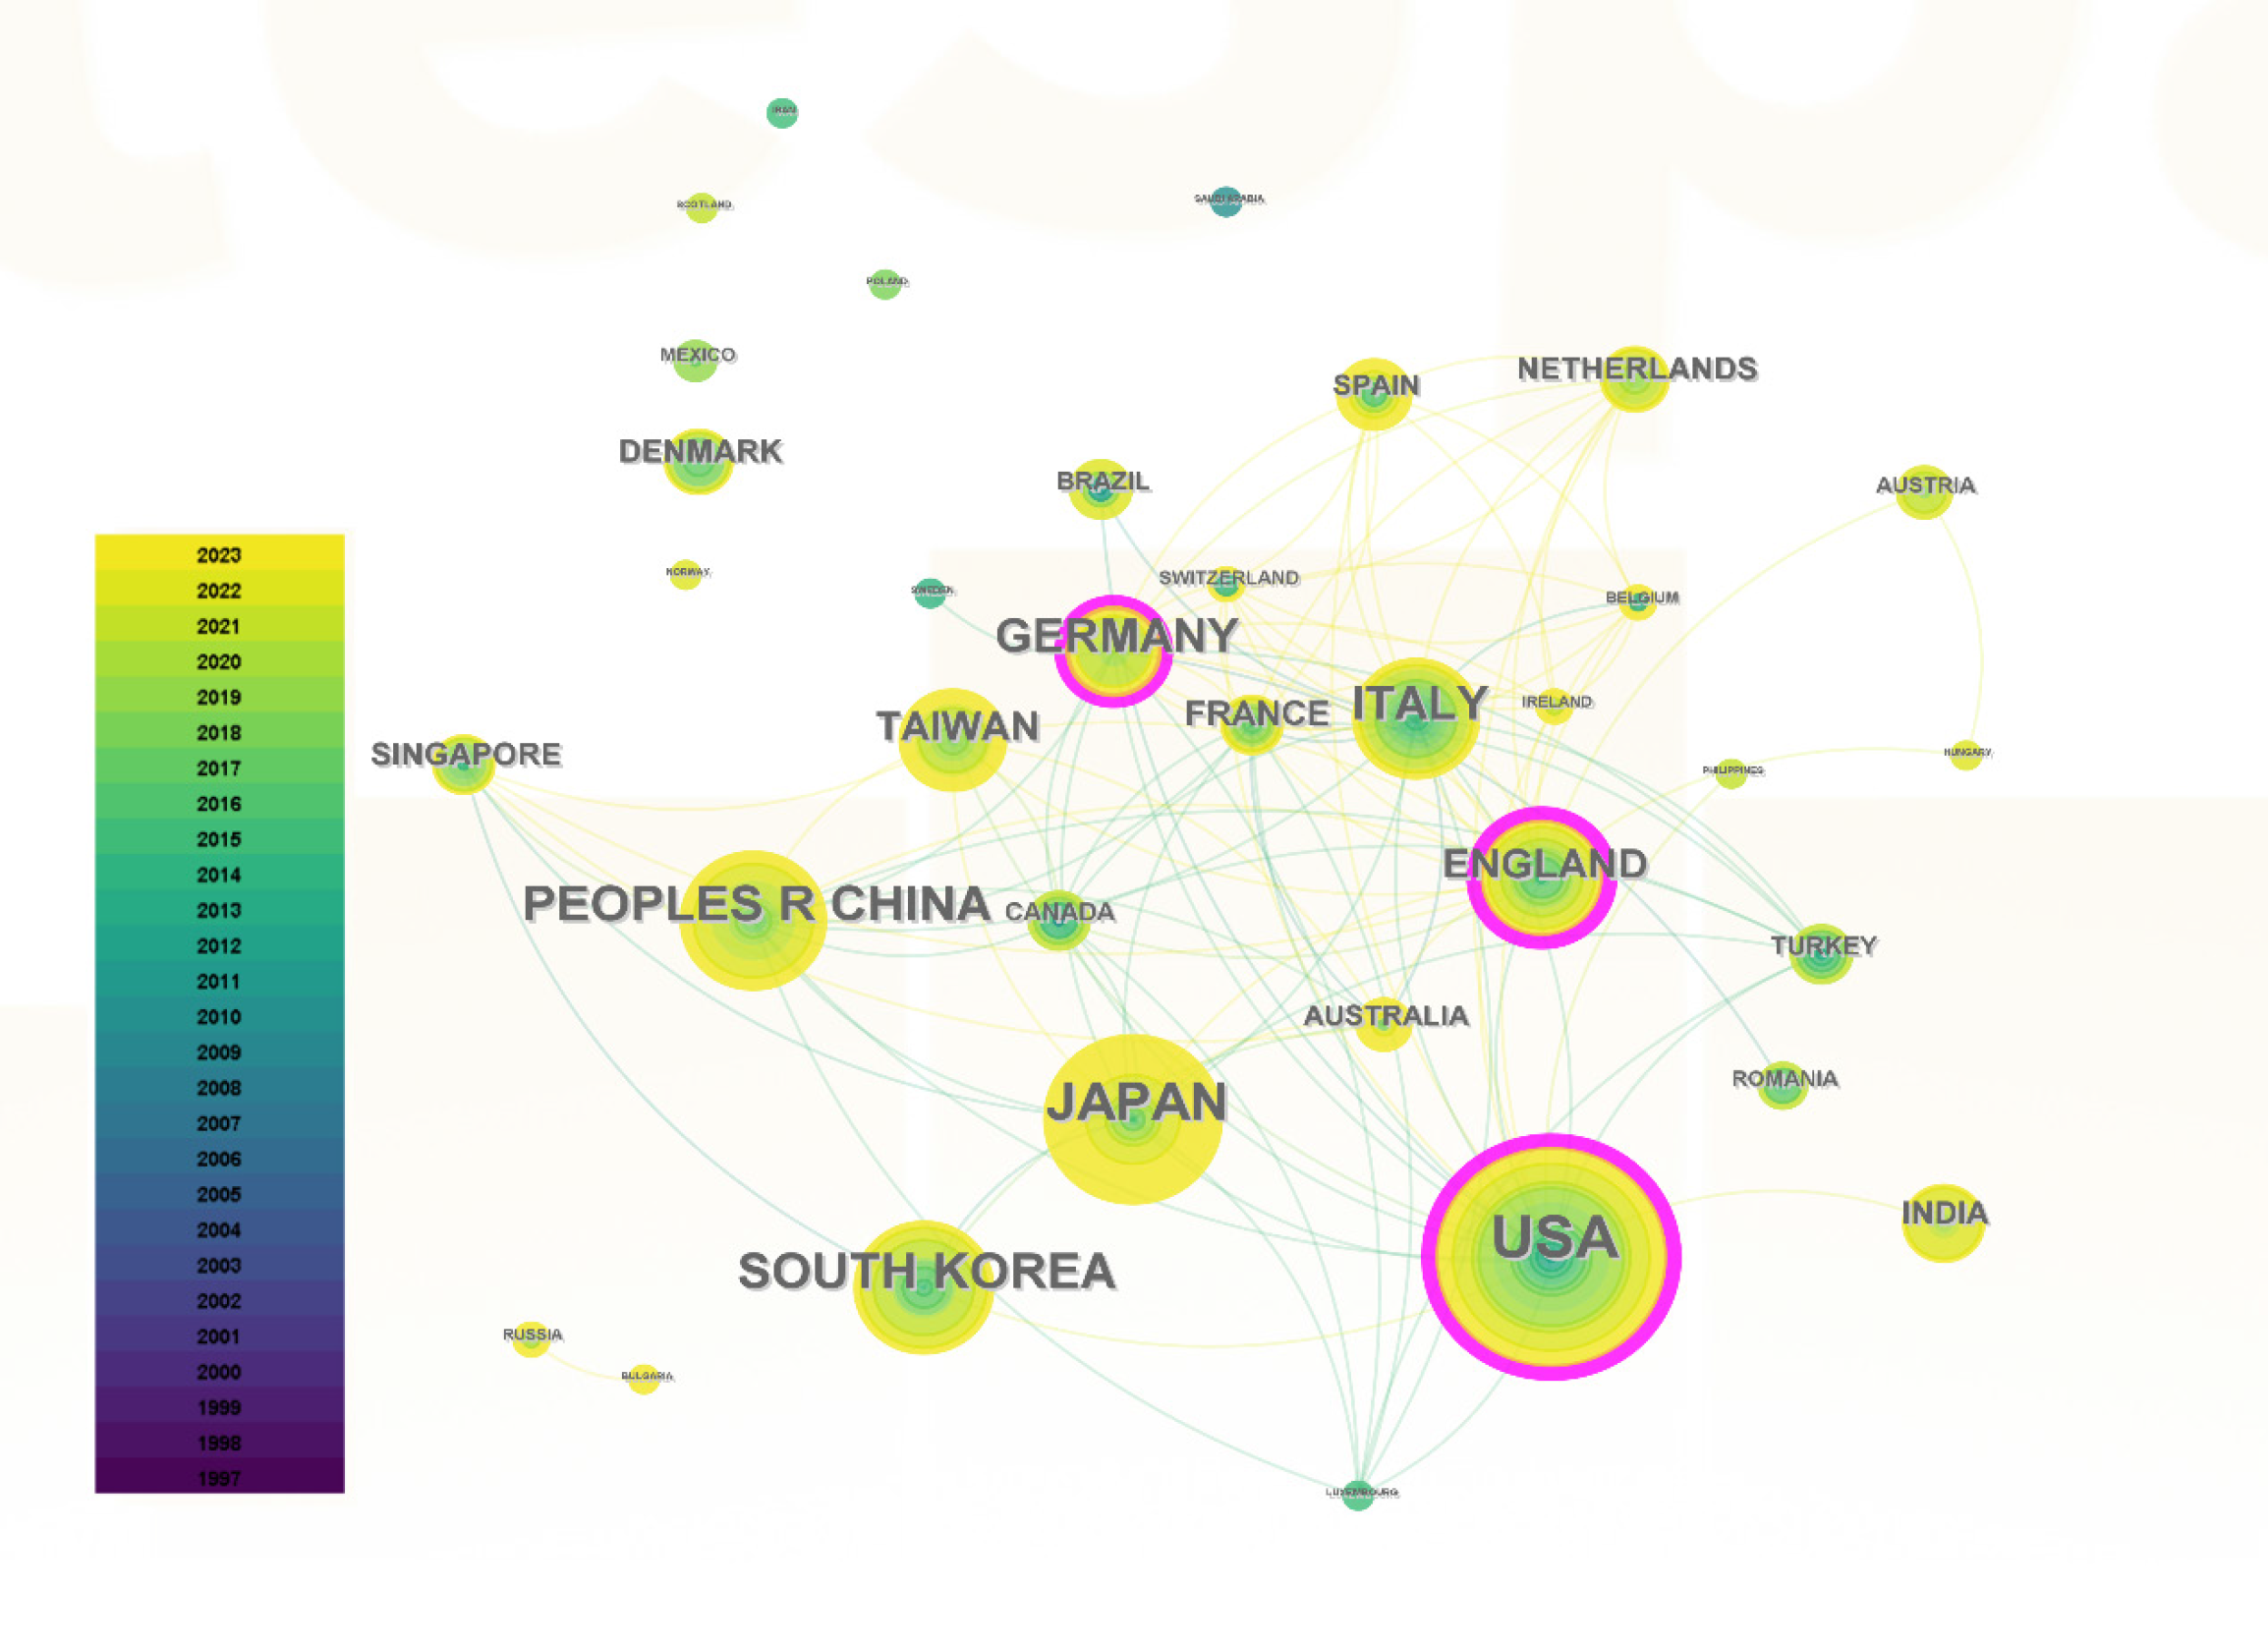
Figure 4 National cooperation network.
Each node represents a country, the ring represents the year in which the article was published, and the lighter the color, the closer it is to 2023. The purple ring represents a centrality greater than 0.1.
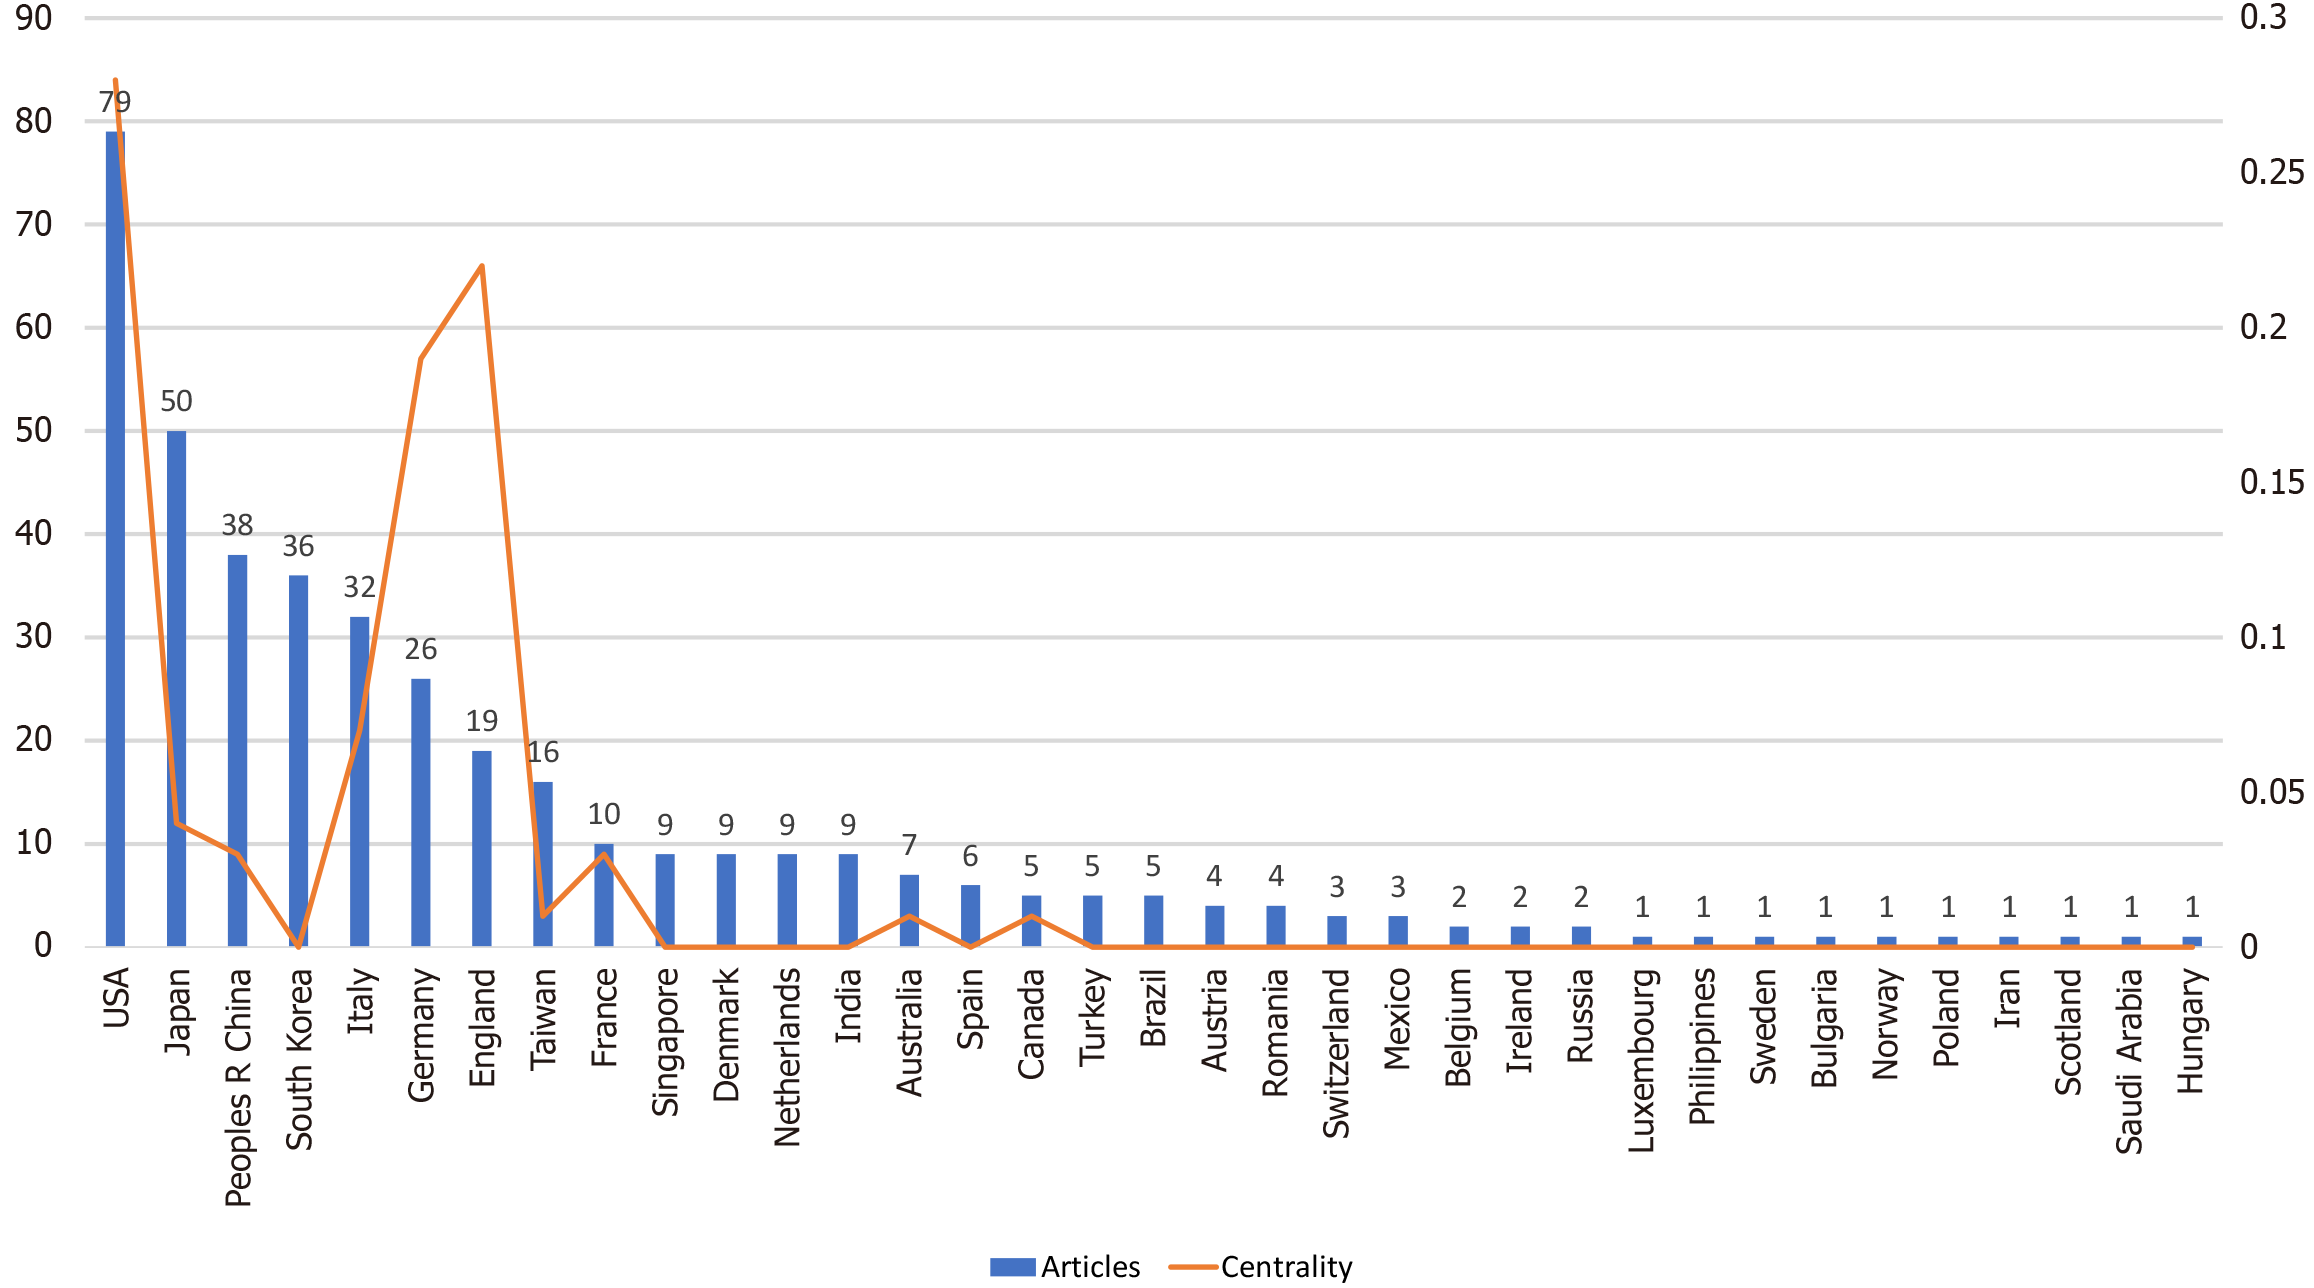
Figure 5
Total number and centrality of publications per country.
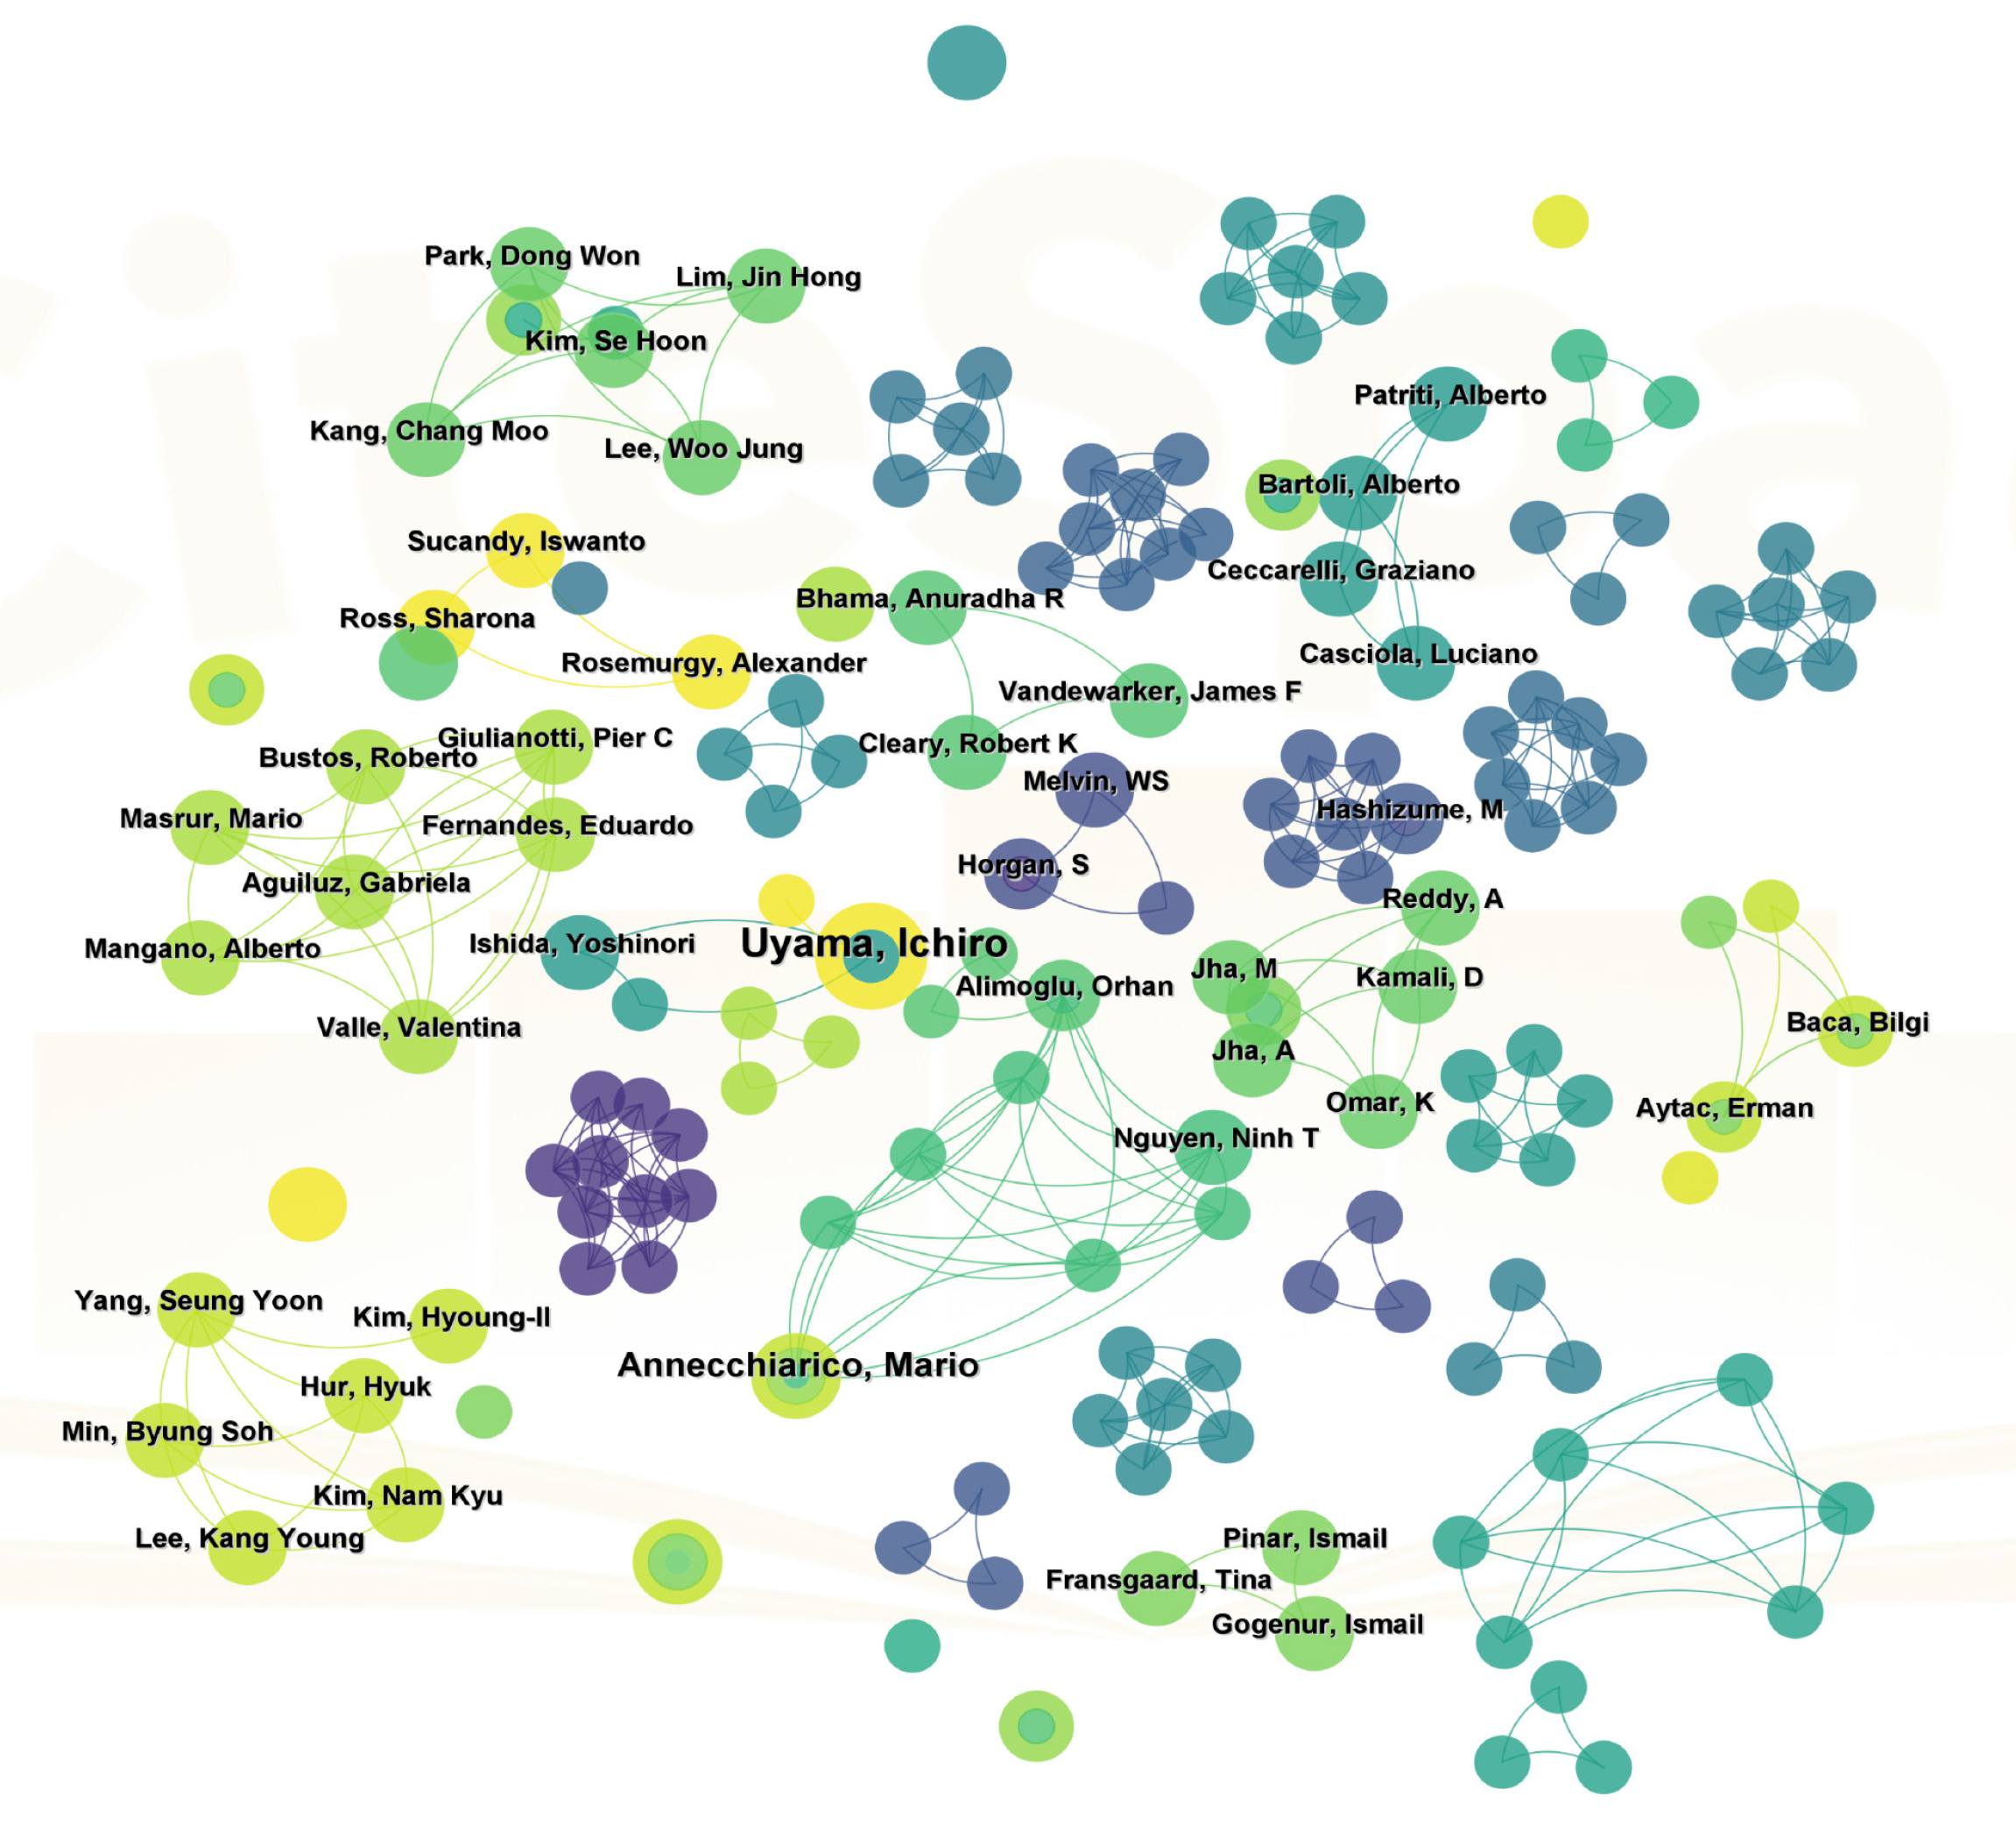
Figure 6 Author collaboration network.
Each node represents an author, and the connection represents a co-occurrence relationship between two authors.
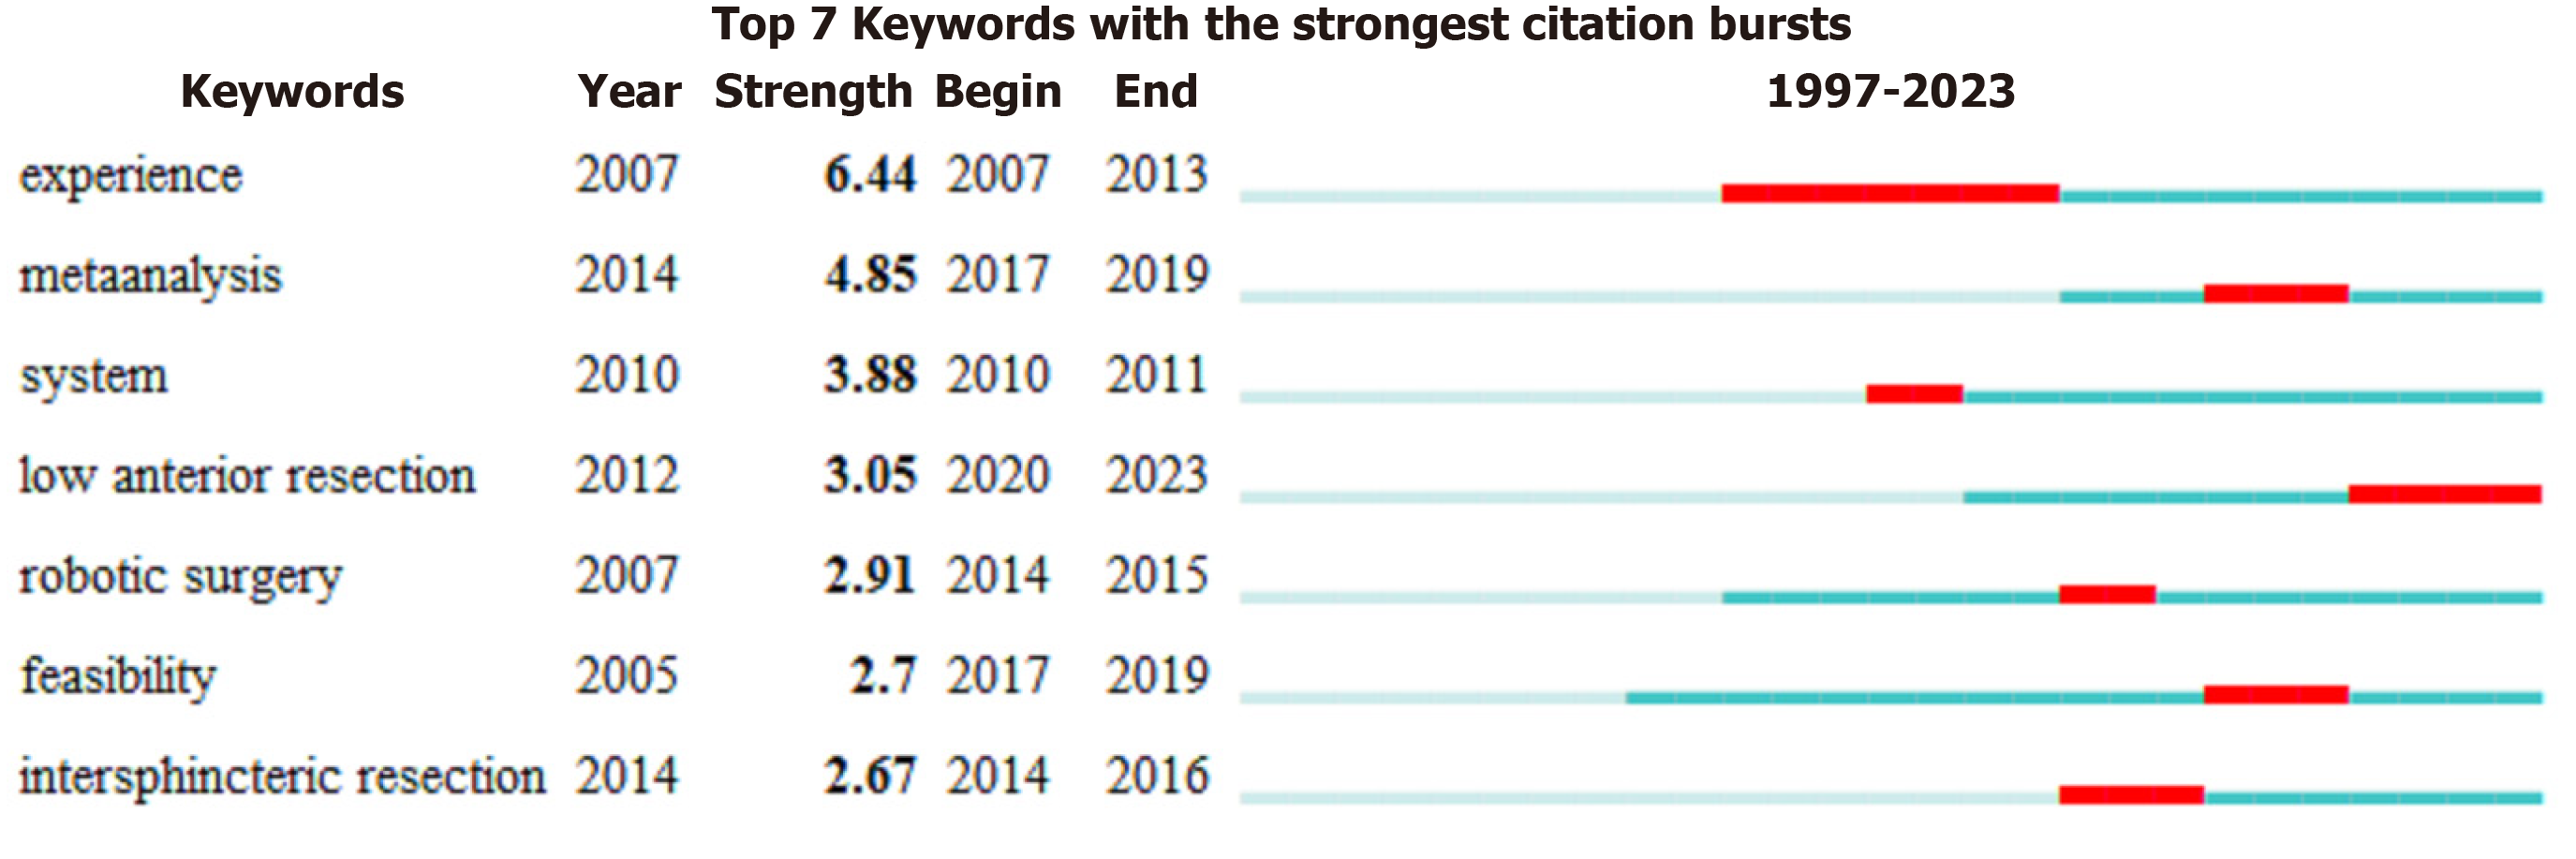
Figure 7 The prominent words from 2007 to 2023.
The red line on the right indicates the main occurrence time.
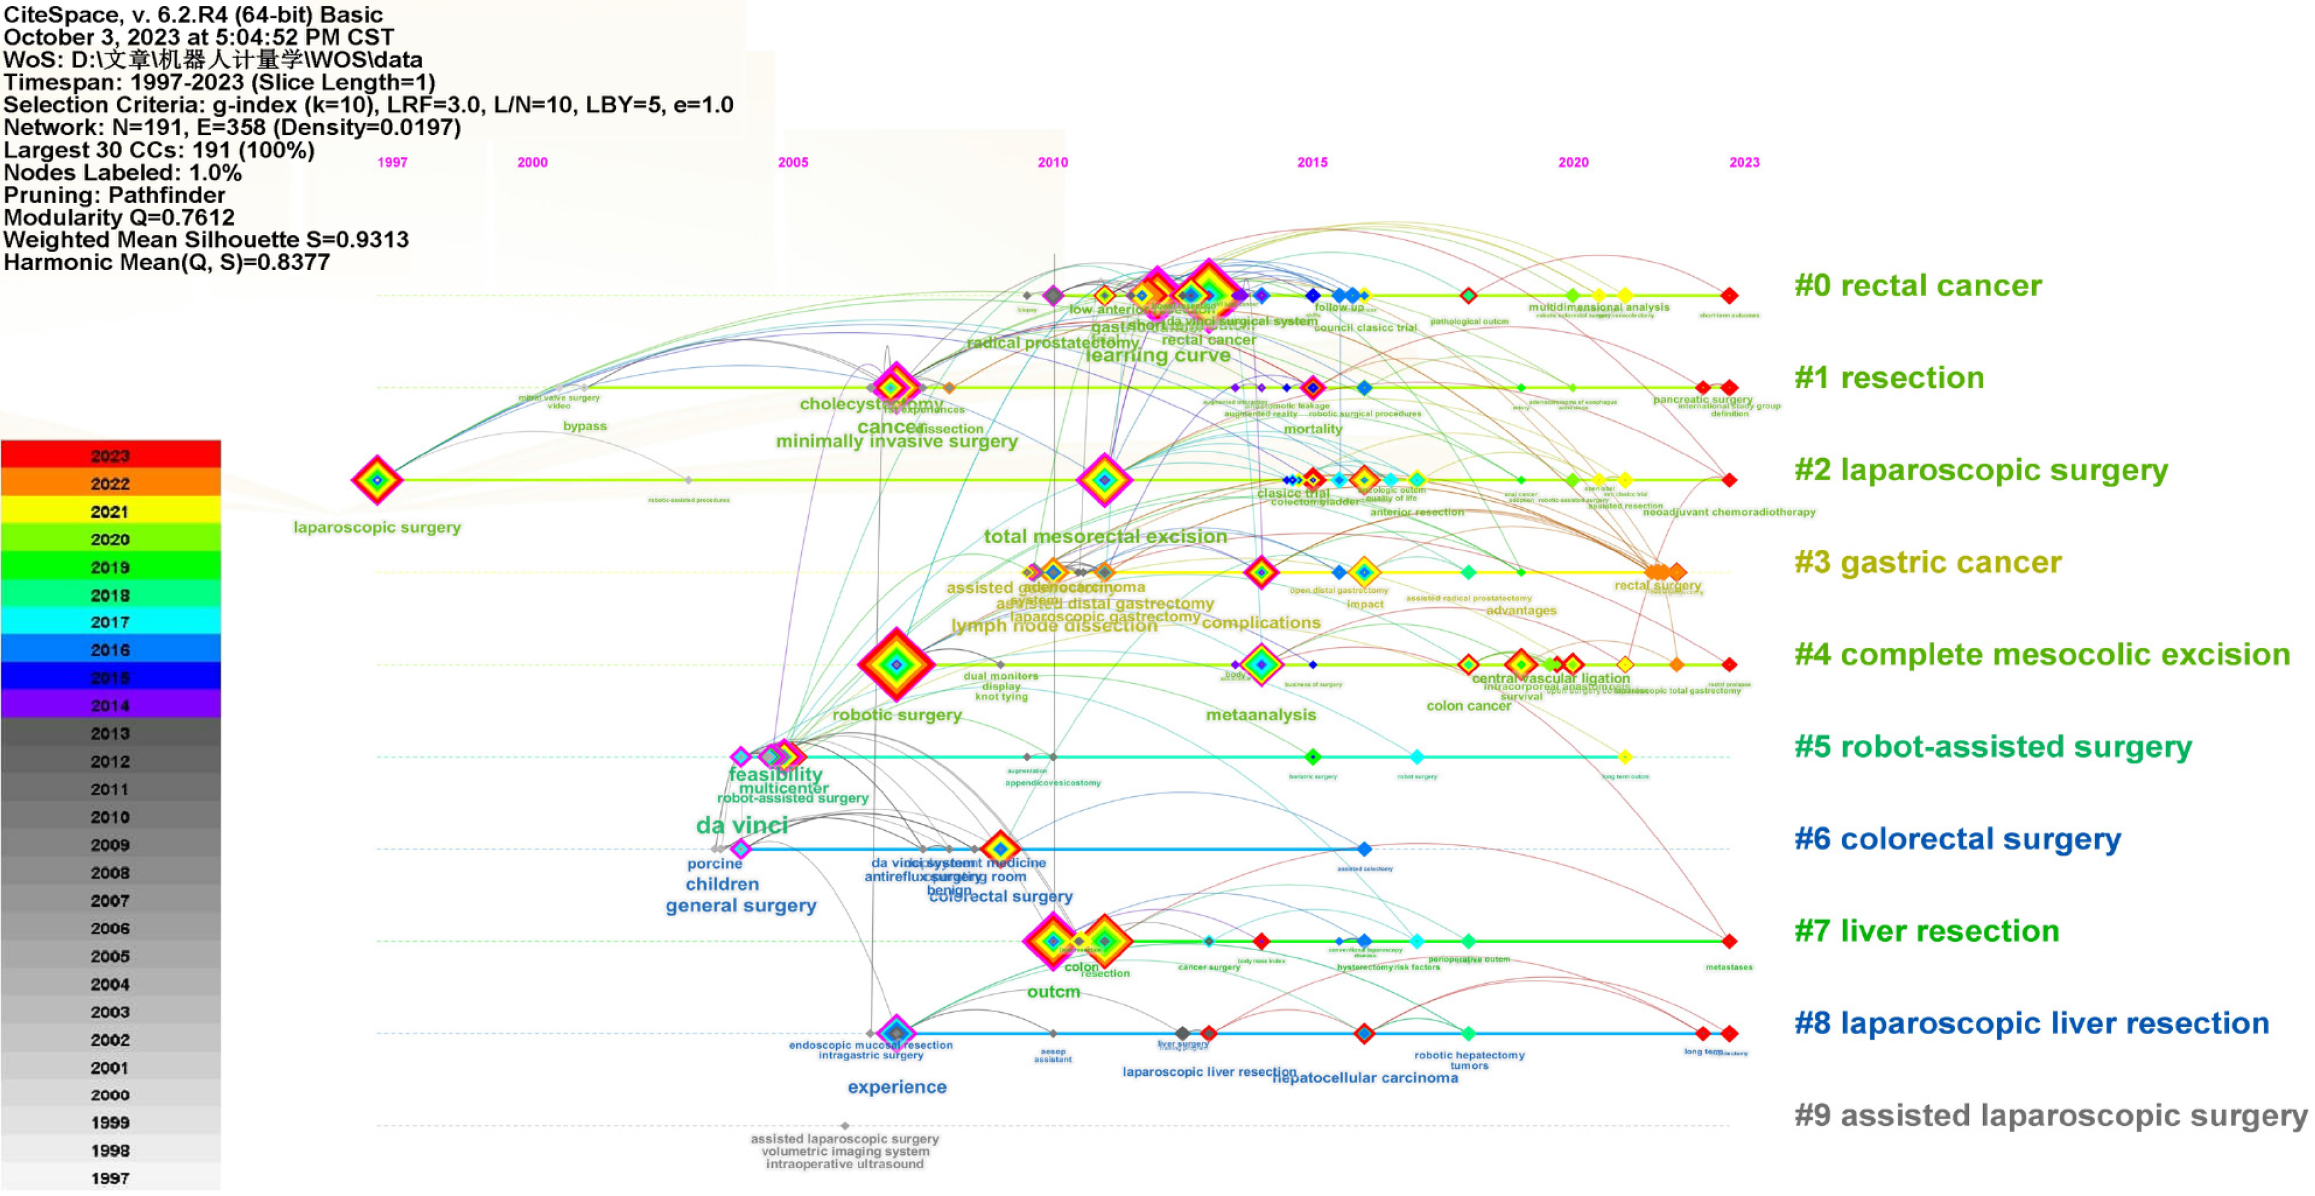
Figure 8
The clustering time view.
- Citation: Jin ZC, Wang ZQ. Trend of robot-assisted surgery system in gastrointestinal and liver surgery: A bibliometric analysis. World J Gastrointest Surg 2024; 16(9): 3008-3019
- URL: https://www.wjgnet.com/1948-9366/full/v16/i9/3008.htm
- DOI: https://dx.doi.org/10.4240/wjgs.v16.i9.3008


