Copyright
©The Author(s) 2024.
World J Gastrointest Surg. Sep 27, 2024; 16(9): 2942-2952
Published online Sep 27, 2024. doi: 10.4240/wjgs.v16.i9.2942
Published online Sep 27, 2024. doi: 10.4240/wjgs.v16.i9.2942
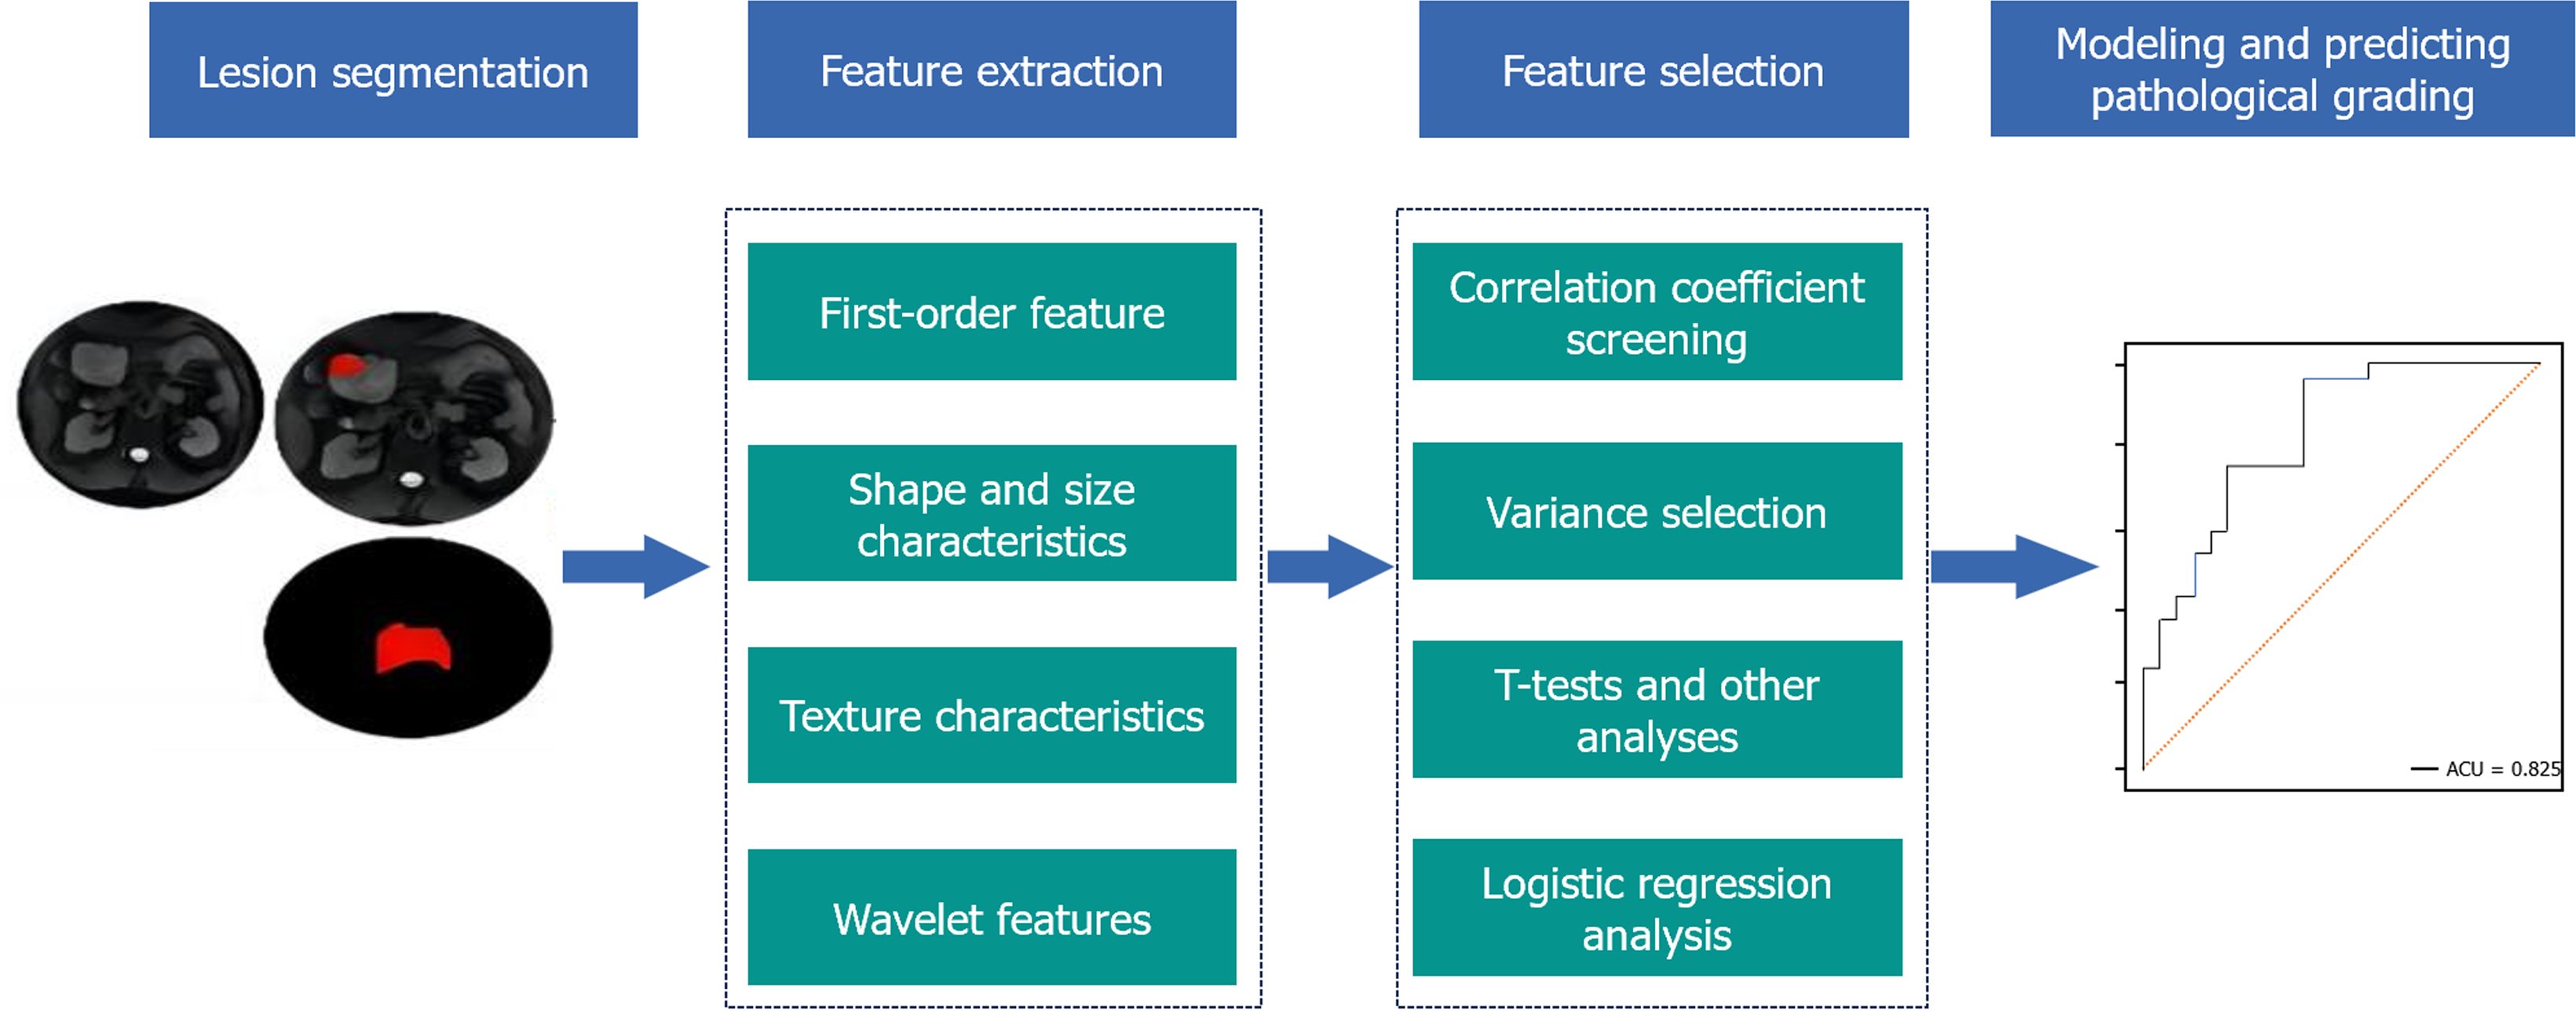
Figure 1 Research technical roadmap.
AUC: Area under the curve.
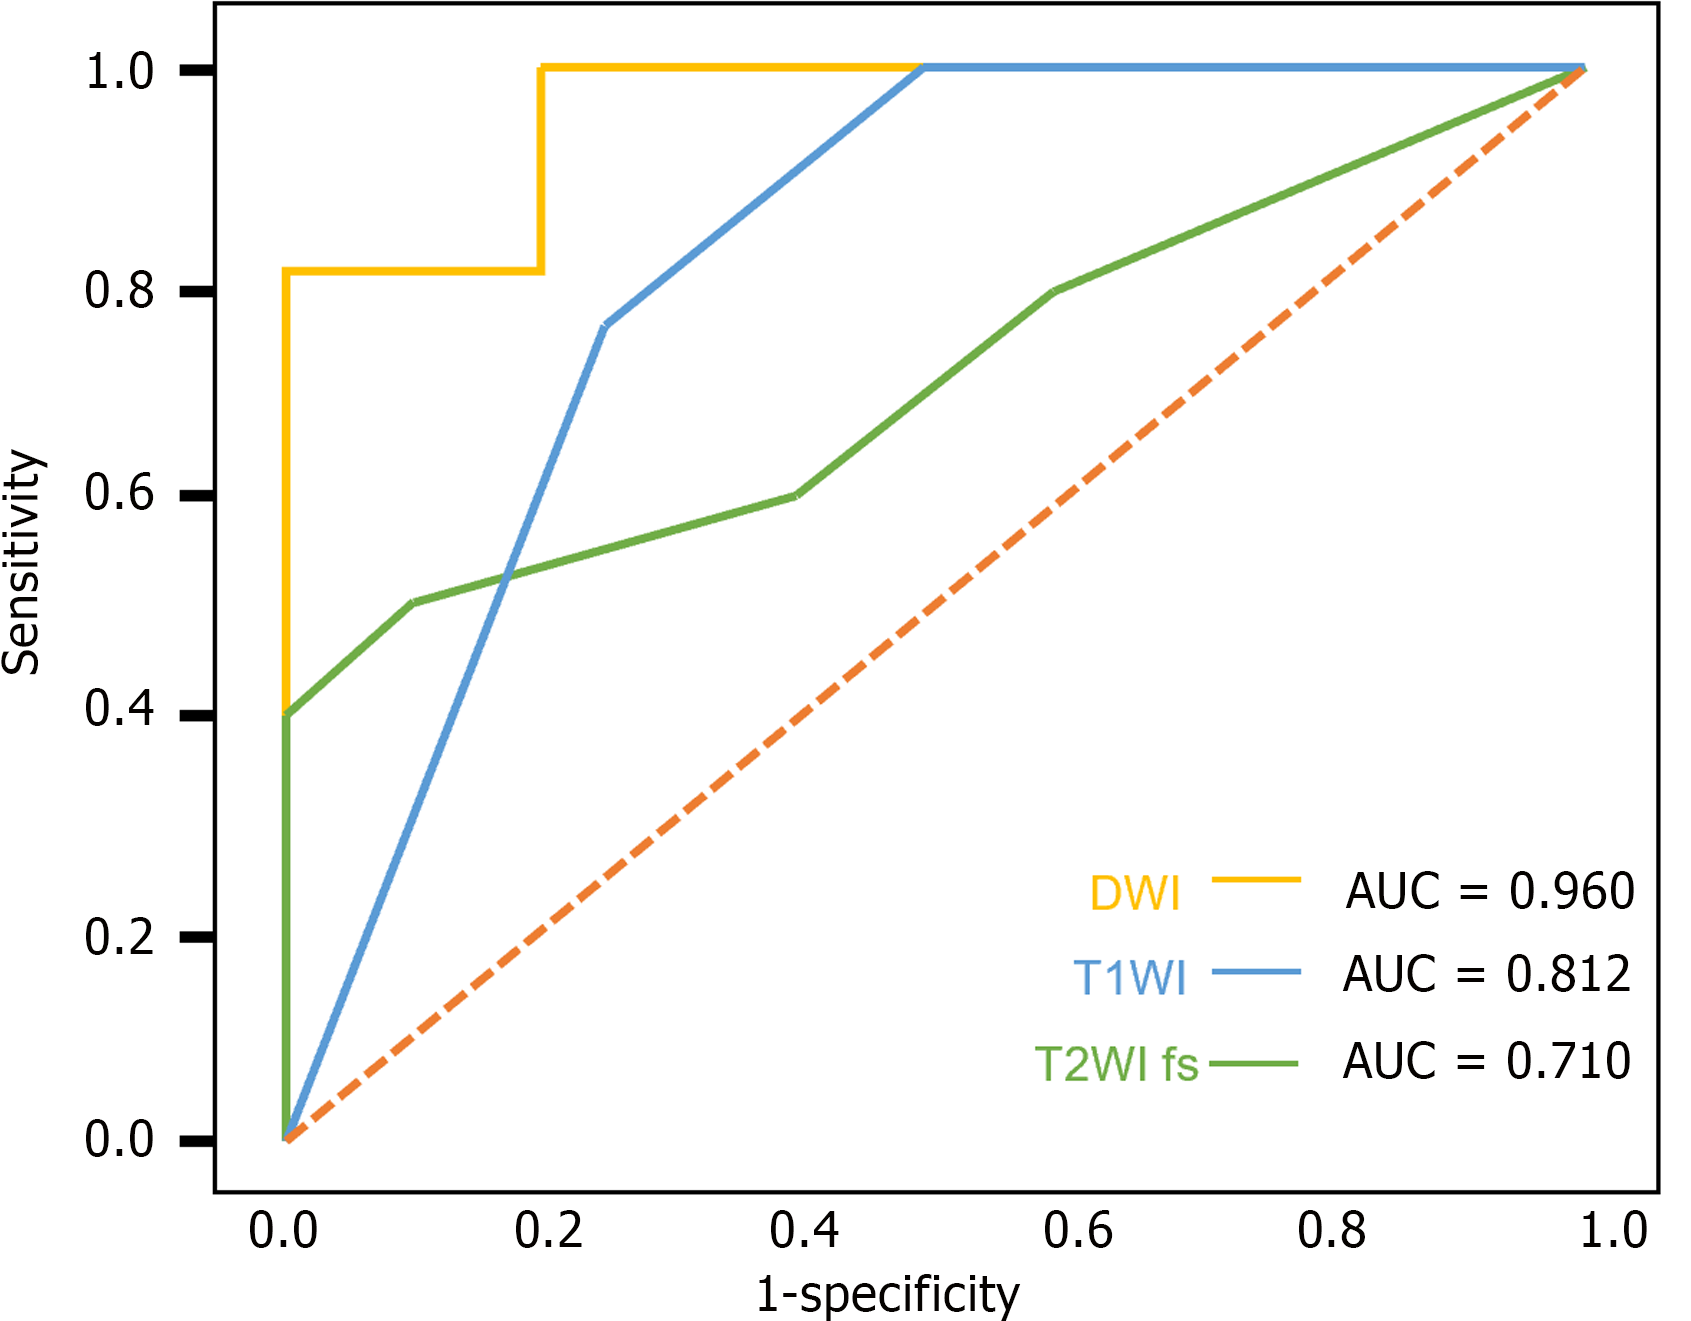
Figure 2 Comparison of receiver operating characteristic curves for single-sequence magnetic resonance imaging models in predicting risk stratification of gastrointestinal stromal tumors in the test group.
AUC: Area under the curve; DWI: Diffusion-weighted imaging; T1WI: T1-weighted imaging; T2WI: T2-weighted imaging; fs: Fat suppress.
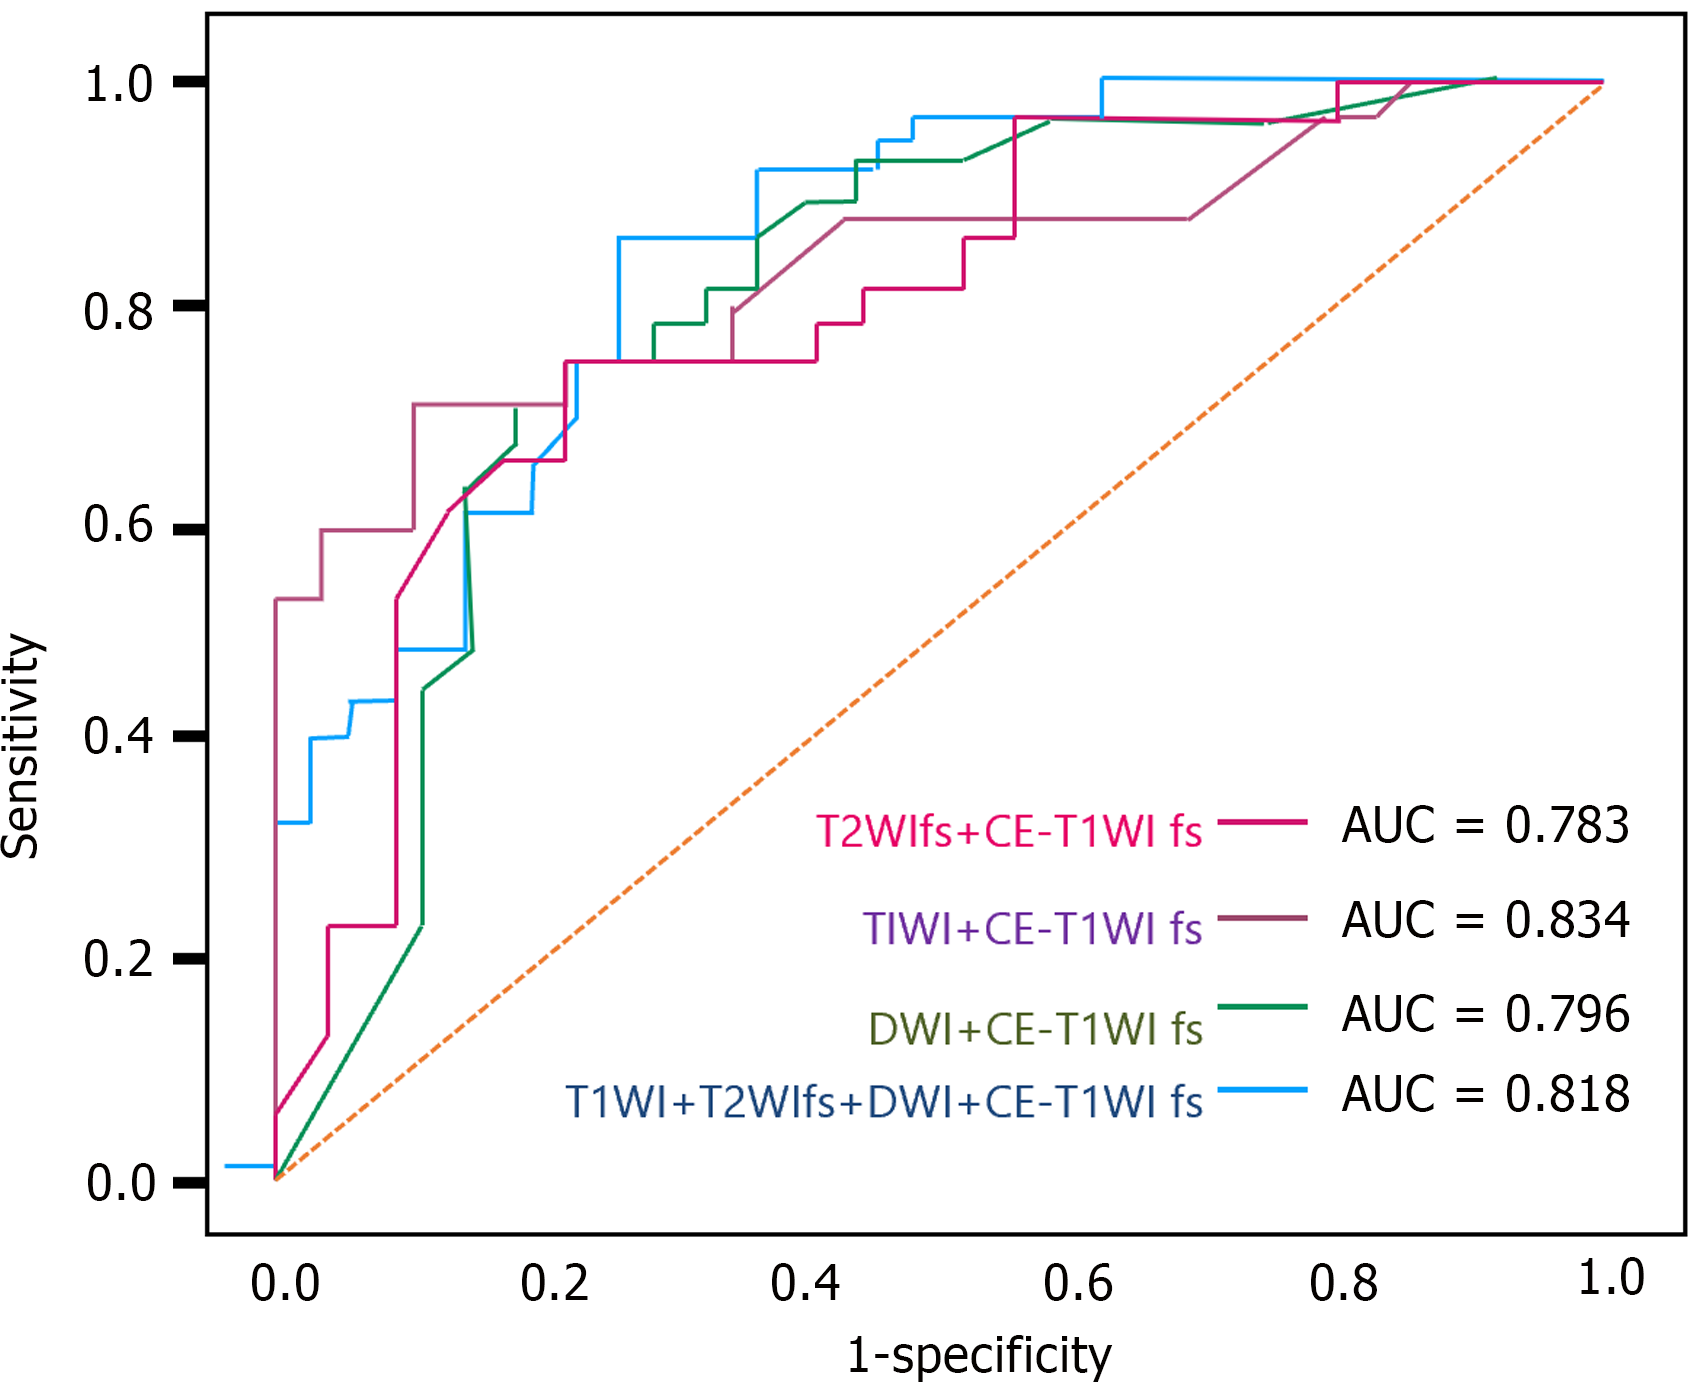
Figure 3 Comparison of receiver operating characteristic curves for multi-sequence magnetic resonance imaging models in gastrointestinal stromal tumors risk stratification test group.
AUC: Area under the curve; DWI: Diffusion-weighted imaging; T1WI: T1-weighted imaging; T2WI: T2-weighted imaging; fs: Fat suppress.
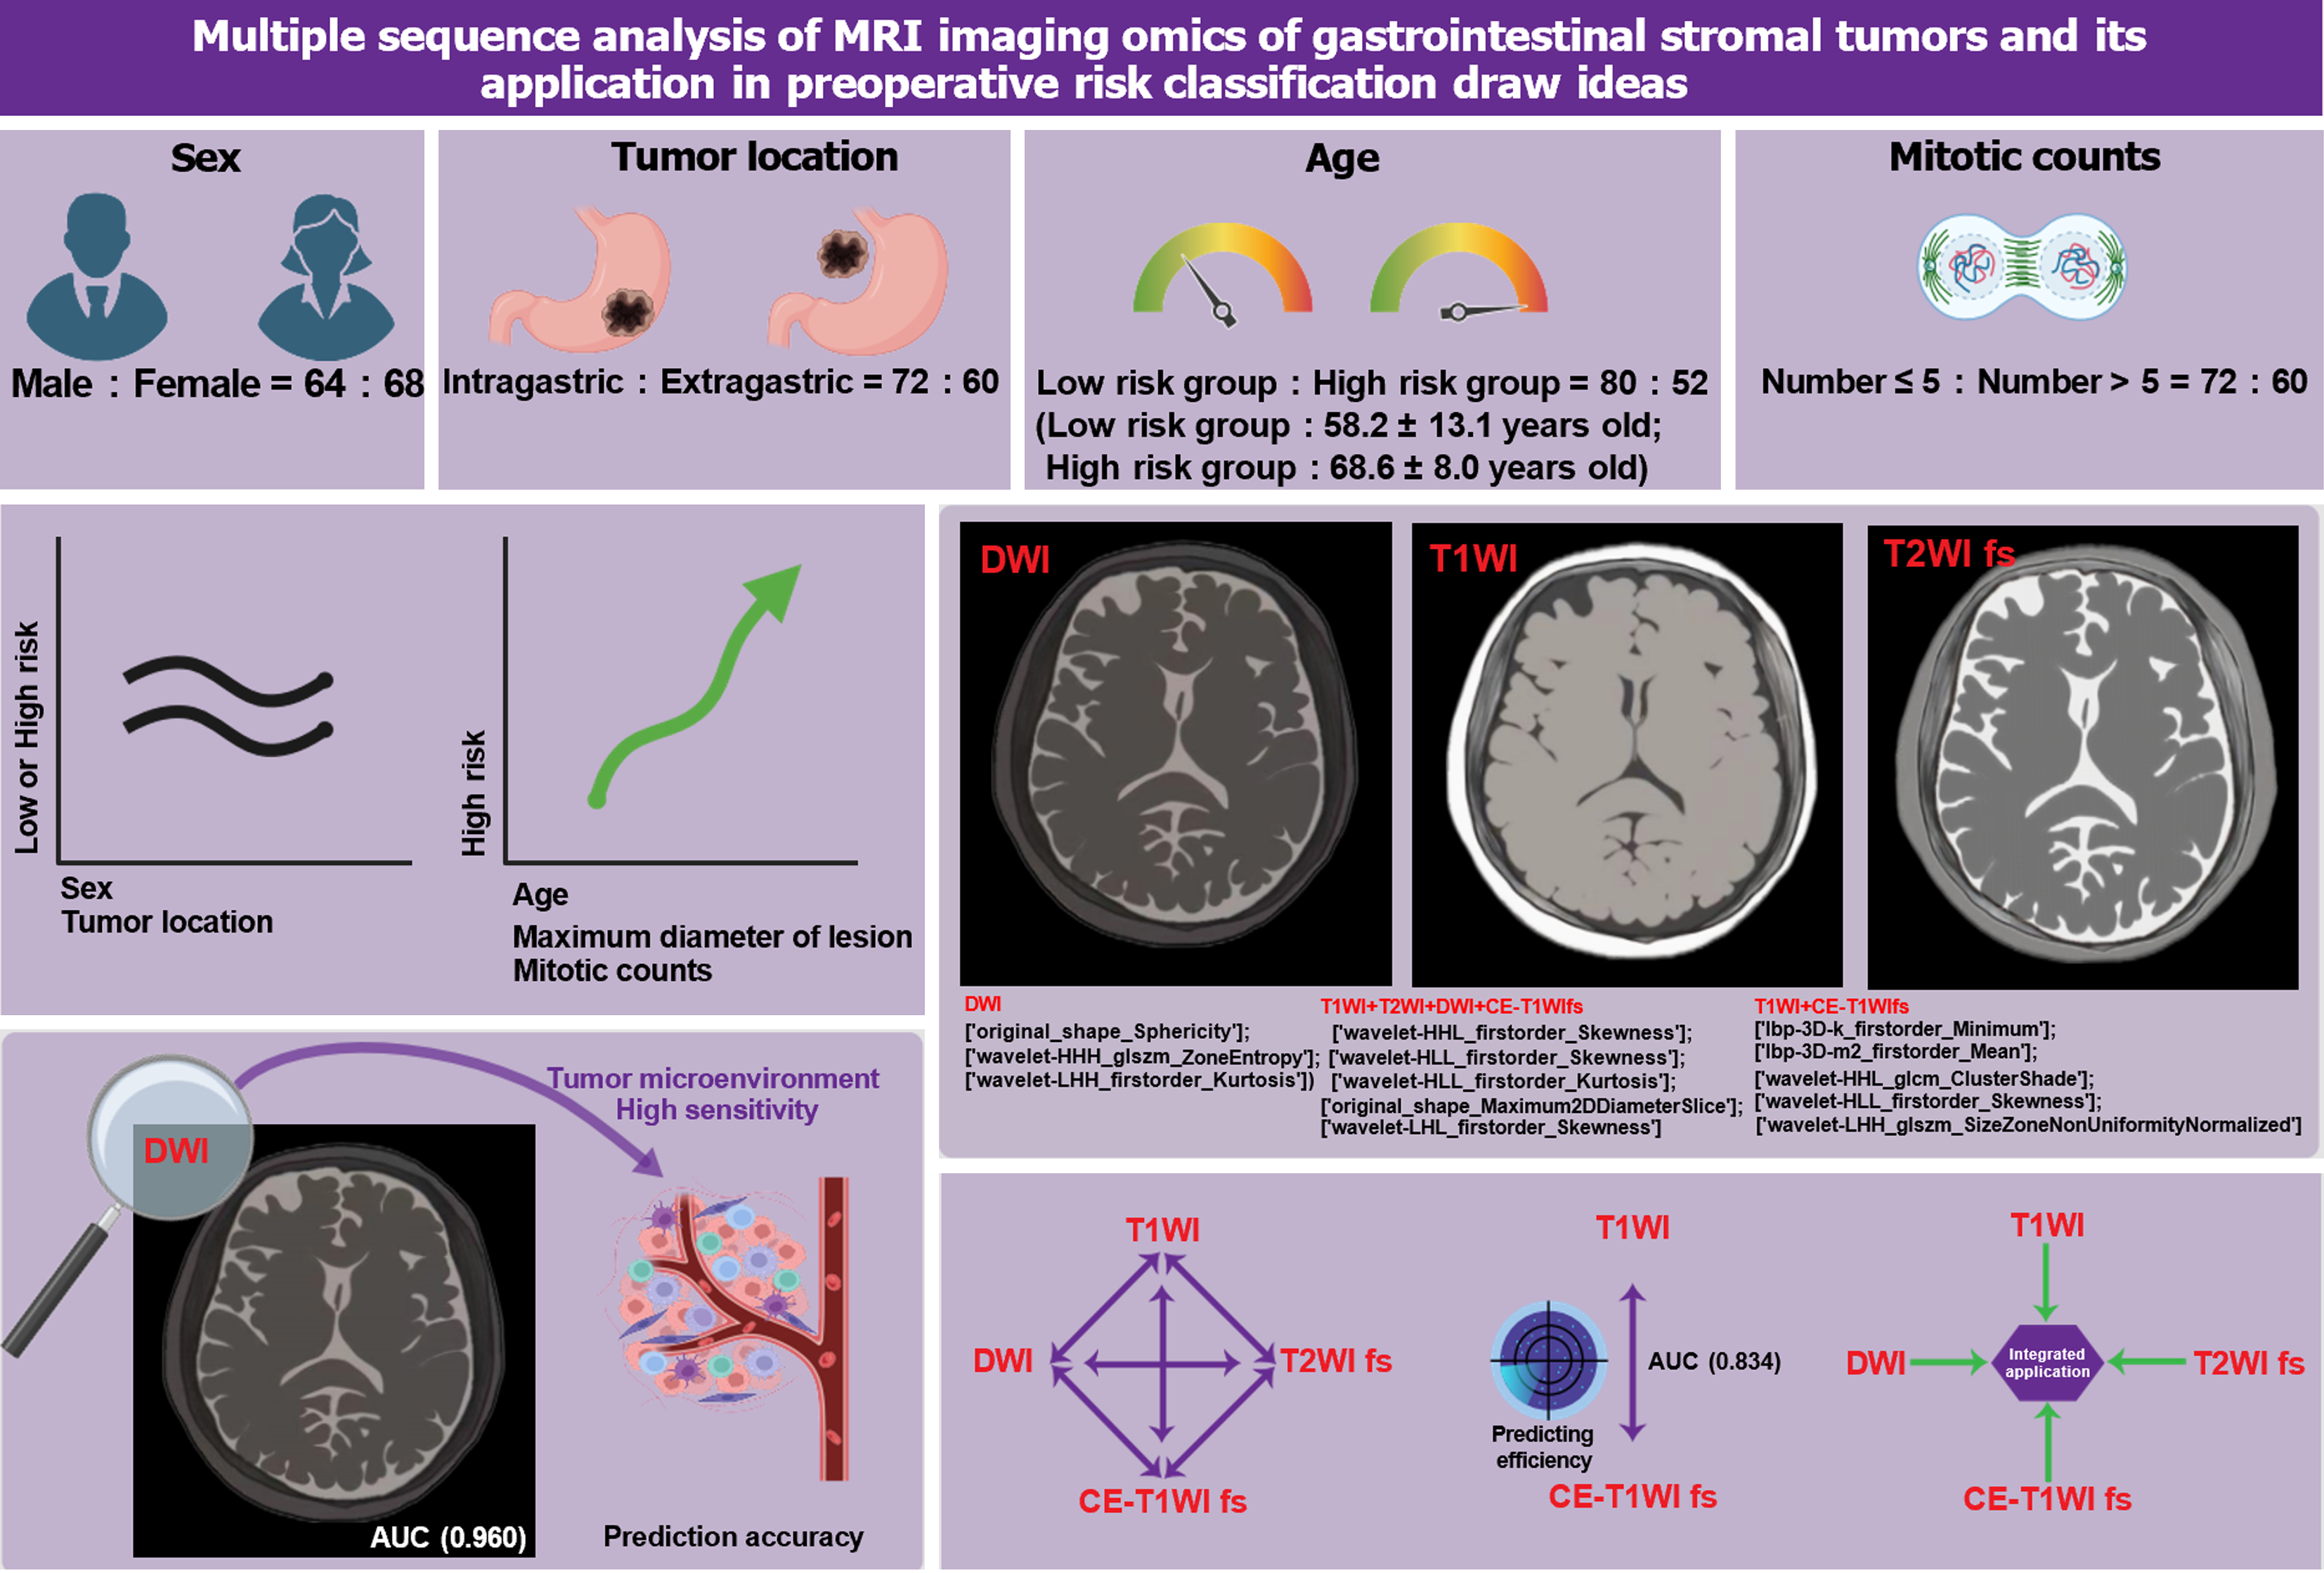
Figure 4 Multi-sequence magnetic resonance imaging imagomics analysis and its application in preoperative risk stratification of gastrointestinal stromal tumors.
AUC: Area under the curve; DWI: Diffusion-weighted imaging; T1WI: T1-weighted imaging; T2WI: T2-weighted imaging; fs: Fat suppress. This figure was created by BioRender.com (Supplementary material).
- Citation: Pan GH, Zhou F, Chen WB, Pan ZJ. Advancing gastrointestinal stromal tumor management: The role of imagomics features in precision risk assessment. World J Gastrointest Surg 2024; 16(9): 2942-2952
- URL: https://www.wjgnet.com/1948-9366/full/v16/i9/2942.htm
- DOI: https://dx.doi.org/10.4240/wjgs.v16.i9.2942


