Copyright
©The Author(s) 2024.
World J Gastrointest Surg. Jul 27, 2024; 16(7): 2308-2318
Published online Jul 27, 2024. doi: 10.4240/wjgs.v16.i7.2308
Published online Jul 27, 2024. doi: 10.4240/wjgs.v16.i7.2308
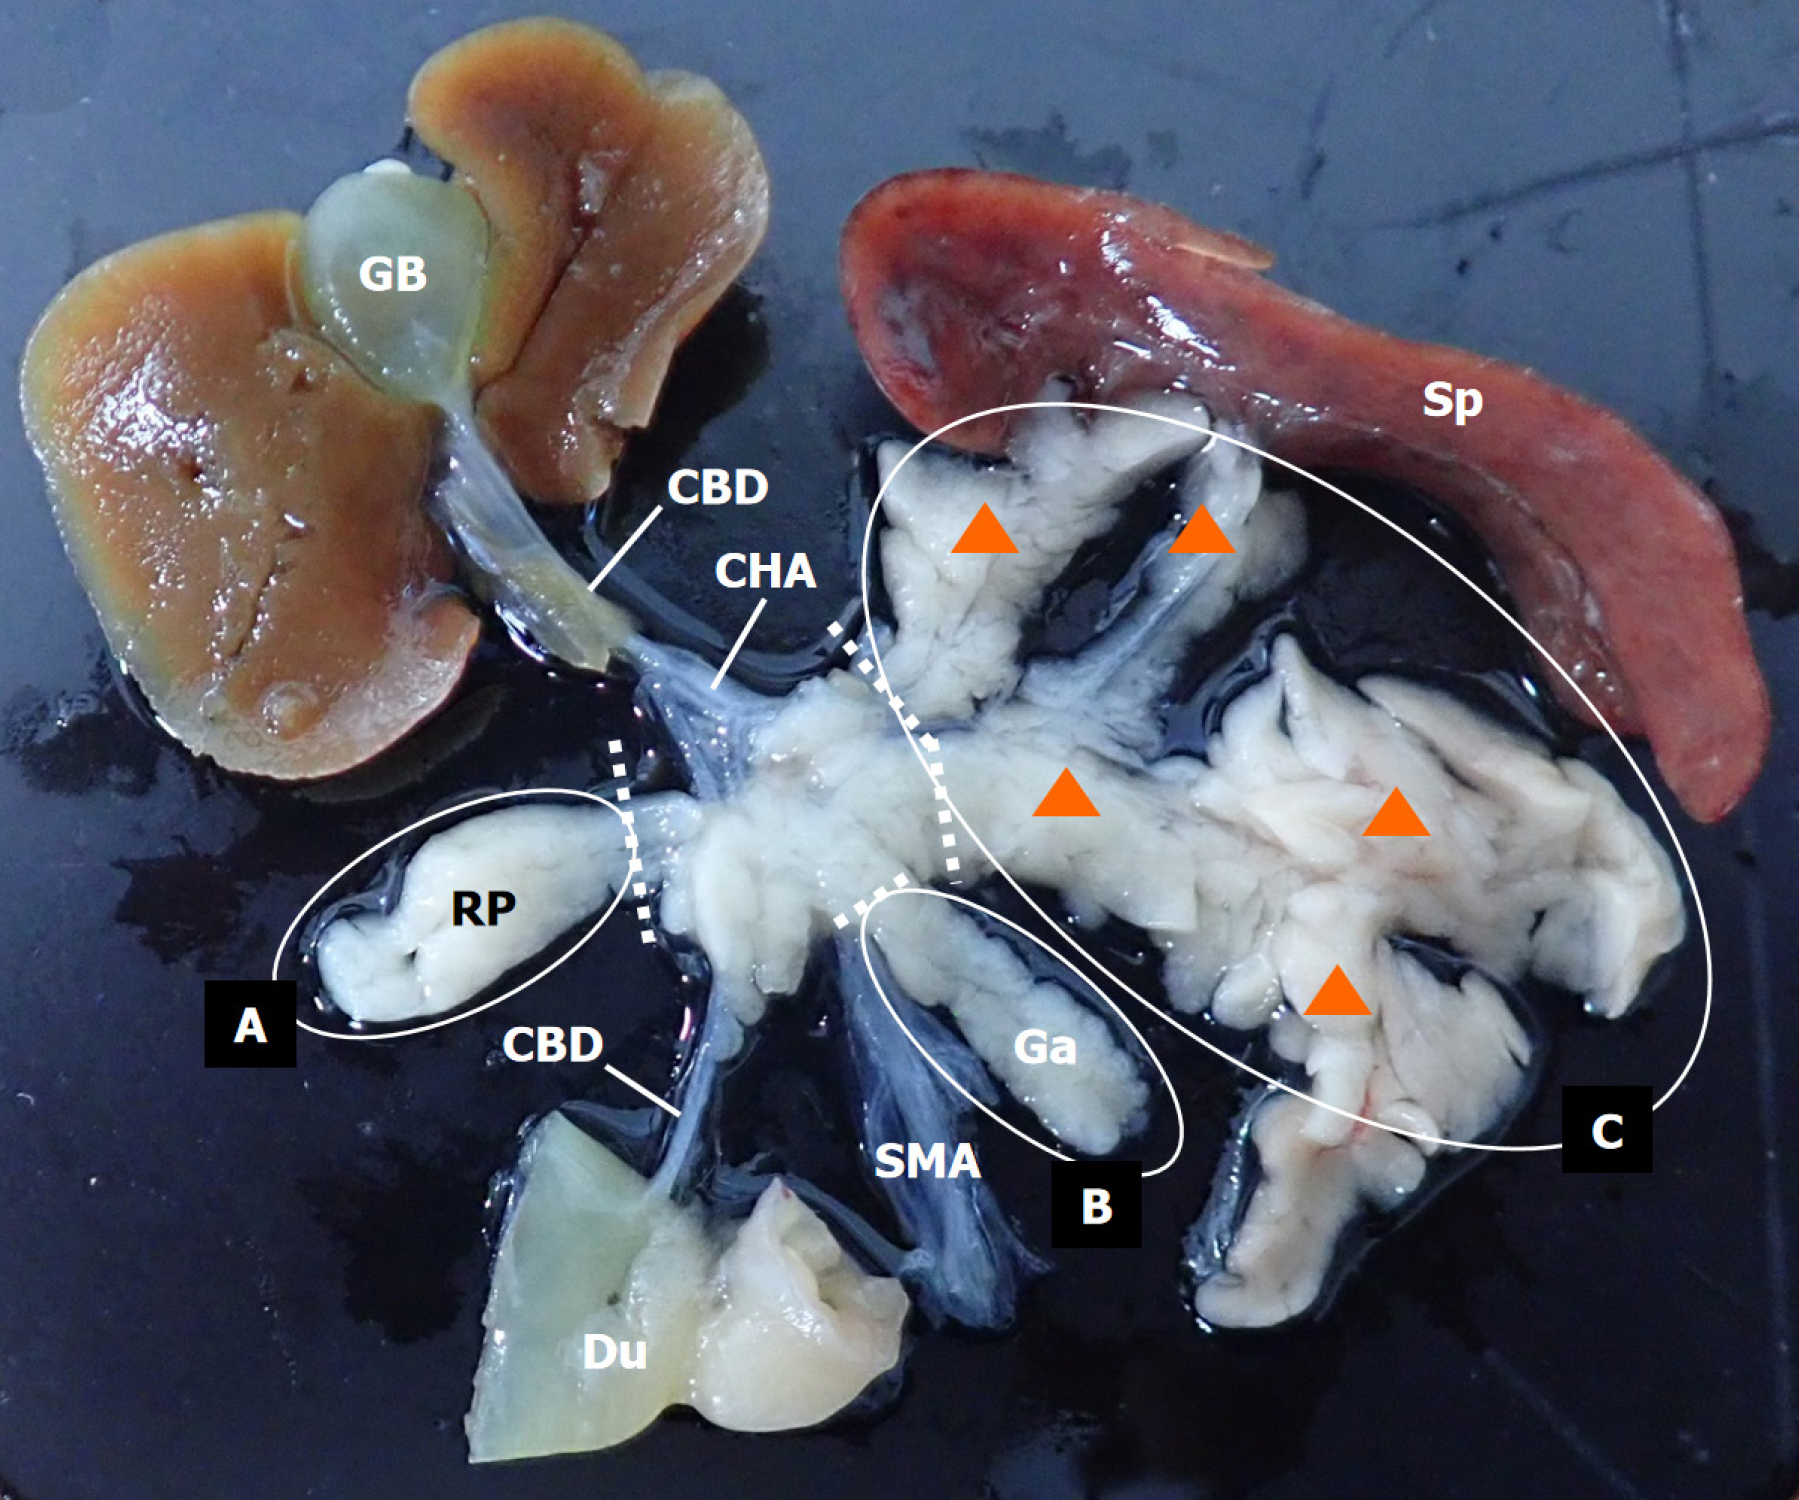
Figure 1 Diagram of the extent of pancreatic resection in Suncus murinus.
Arrowheads indicate the splenic lobe of the left pancreas (area C). CBD: Common bile duct; CHA: Common hepatic artery; Du: Duodenum; Ga: Gastric lobe of the left pancreas (area B); GB: Gallbladder; RP: Right pancreas (area A); SMA: Superior mesenteric artery; Sp: Spleen.
Figure 2 The schedule of experimental data collection.
BC: Blood collection; BGT: Blood glucose testing; BrdU: Bromodeoxiuridin; BWM: Body weight measurement; IPGTT: Intraperitoneal glucose tolerance test.
Figure 3 Variations in blood glucose levels and intraperitoneal glucose tolerance test outcomes over time in Suncus murinus with different pancreatic resection ranges.
A: Blood glucose level; B: Intraperitoneal glucose tolerance test outcomes. aP < 0.05 vs Sham; bP < 0.01 vs Sham; cP < 0.001 vs Sham. AUC: Area under the curve; PPx: Partial pancreatectomy group; SPx: Subtotal pancreatectomy group; VPx: Ventral pancreatectomy group.
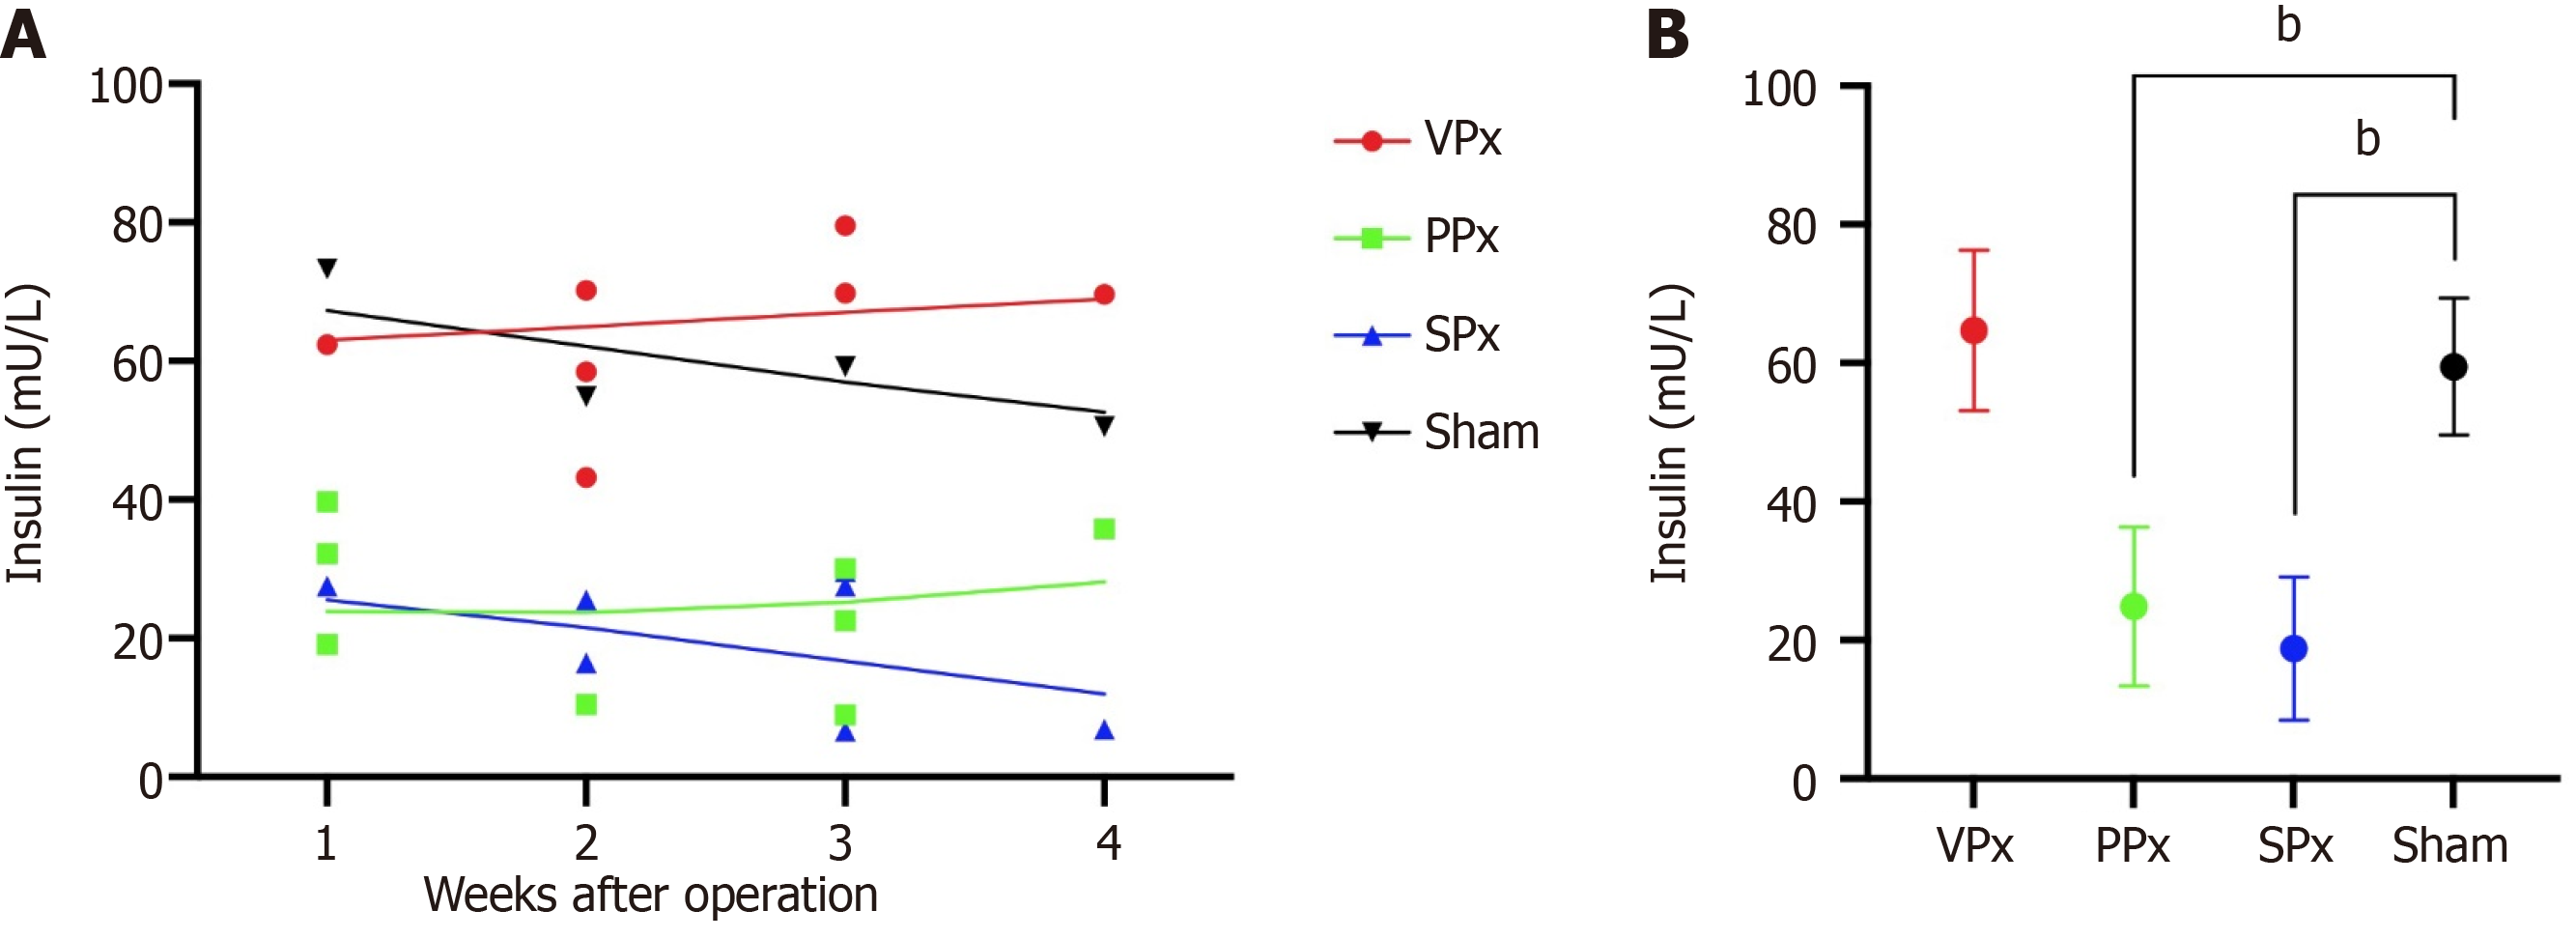
Figure 4 Variations over time and comparisons in insulin release.
A: Insulin release at 30 min after the intraperitoneal glucose tolerance test (IPGTT) in Suncus murinus with different pancreatic resection ranges; B: Comparisons in insulin release at 30 min after the IPGTT between the pancreatectomy (Px) groups and the Sham group. Second-order smoothing was used to describe the trend of value variation over time. bP < 0.01. PPx: Partial pancreatectomy group; SPx: Subtotal pancreatectomy group; VPx: Ventral pancreatectomy group.
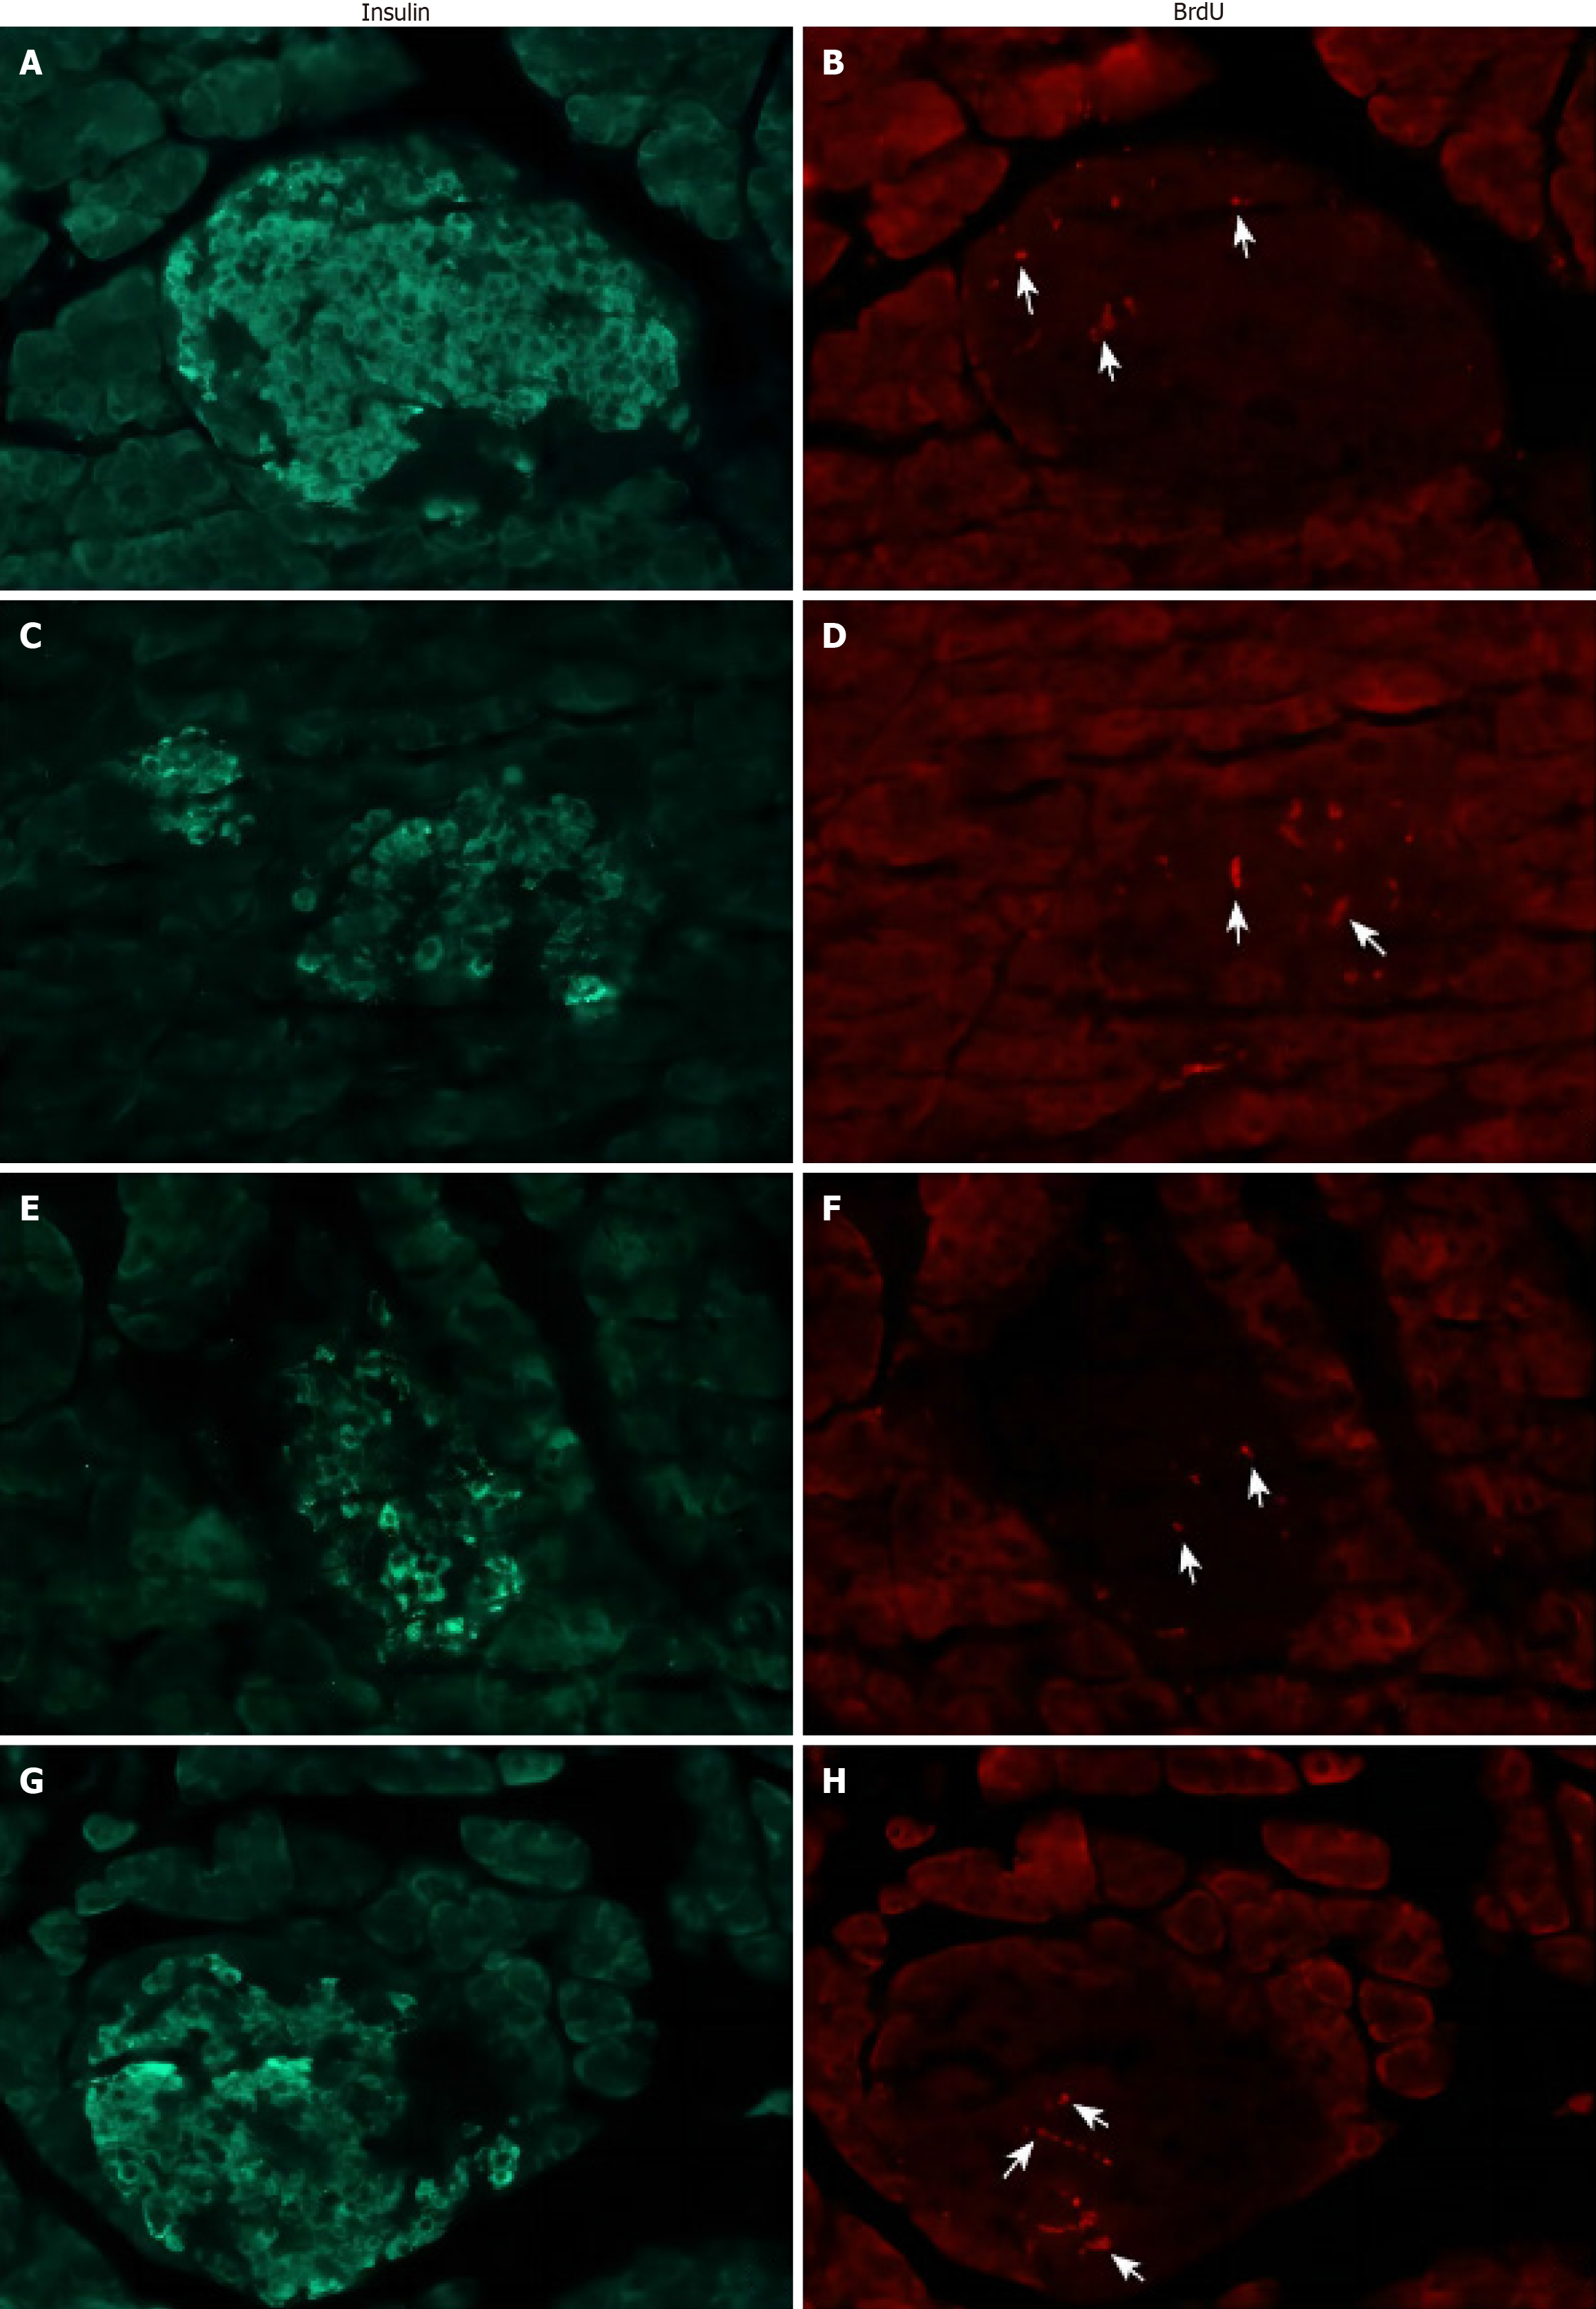
Figure 5 Double fluorescence staining of insulin-positive cells and Bromodeoxyuridine-positive cells in the islets of pancreatic tissue after pancreatectomy.
A: Insulin stained from the ventral pancreatectomy (VPx) group; B: Bromodeoxyuridine (BrdU) stained from the VPx group; C: Insulin stained from the partial pancreatectomy (PPx) group; D: BrdU stained from the PPx group; E: Insulin stained from the subtotal pancreatectomy (SPx) group; F: BrdU stained from the SPx group; G: Insulin stained from the Sham group; H: BrdU stained from the Sham group. Magnification: × 400 in each figure. Arrows indicate BrdU-positive reaction cells.
Figure 6 Variations in body weight and food intake over time, and comparisons between the pancreatectomy groups and the Sham group.
A: Body weight; B: Food intake. aP < 0.05 vs Sham; bP < 0.01 vs Sham. PPx: Partial pancreatectomy group; SPx: Subtotal pancreatectomy group; VPx: Ventral pancreatectomy group.
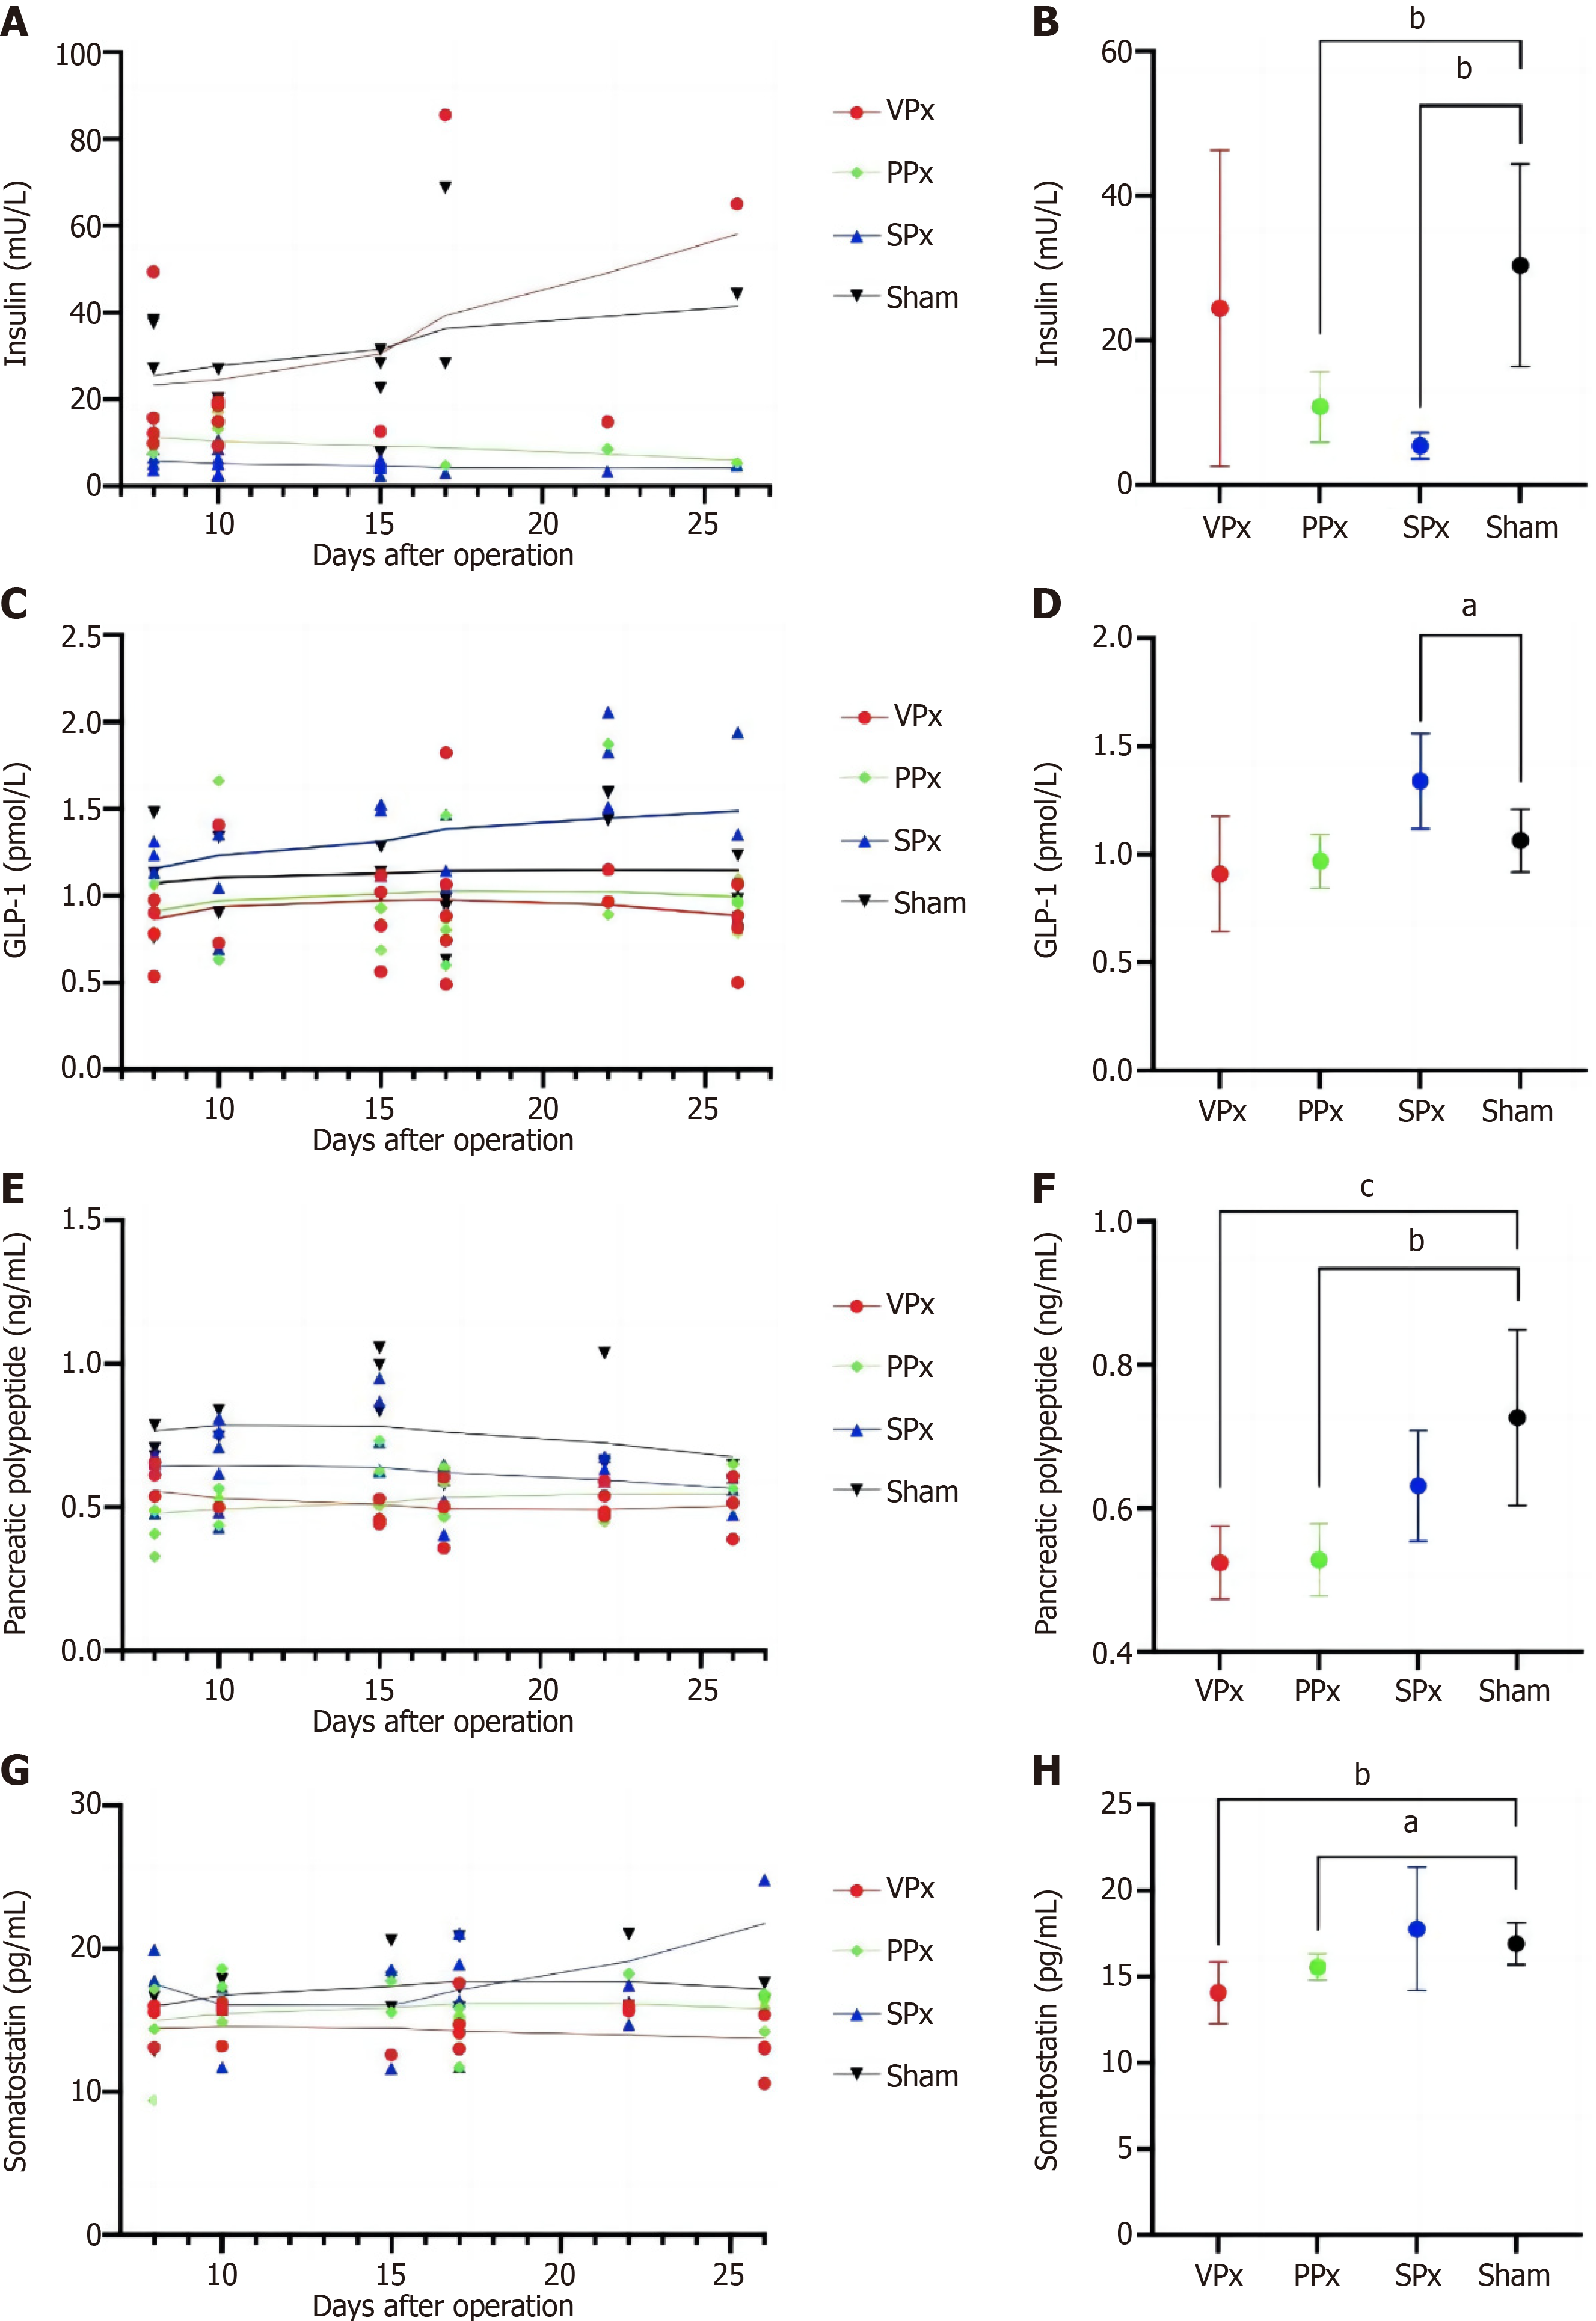
Figure 7 Variations in serum hormone levels at 30 min after feeding over time, and comparisons between the pancreatectomy groups and the Sham group.
A: Serum insulin levels; B: Comparisons of insulin; C: Serum glucagon-like peptide-1 (GLP-1) levels; D: Comparisons of GLP-1; E: Serum pancreatic polypeptide (PP) levels; F: Comparisons of PP; G: Serum somatostatin levels; H: Comparisons of somatostatin. Second-order smoothing was used to describe the trend of value variation over time. aP < 0.05; bP < 0.01; cP < 0.001. PPx: Partial pancreatectomy group; SPx: Subtotal pancreatectomy group; VPx: Ventral pancreatectomy group.
- Citation: Li RJ, Yang T, Zeng YH, Natsuyama Y, Ren K, Li J, Nagakawa Y, Yi SQ. Impacts of different pancreatic resection ranges on endocrine function in Suncus murinus. World J Gastrointest Surg 2024; 16(7): 2308-2318
- URL: https://www.wjgnet.com/1948-9366/full/v16/i7/2308.htm
- DOI: https://dx.doi.org/10.4240/wjgs.v16.i7.2308


