Copyright
©The Author(s) 2024.
World J Gastrointest Surg. Jul 27, 2024; 16(7): 2106-2118
Published online Jul 27, 2024. doi: 10.4240/wjgs.v16.i7.2106
Published online Jul 27, 2024. doi: 10.4240/wjgs.v16.i7.2106
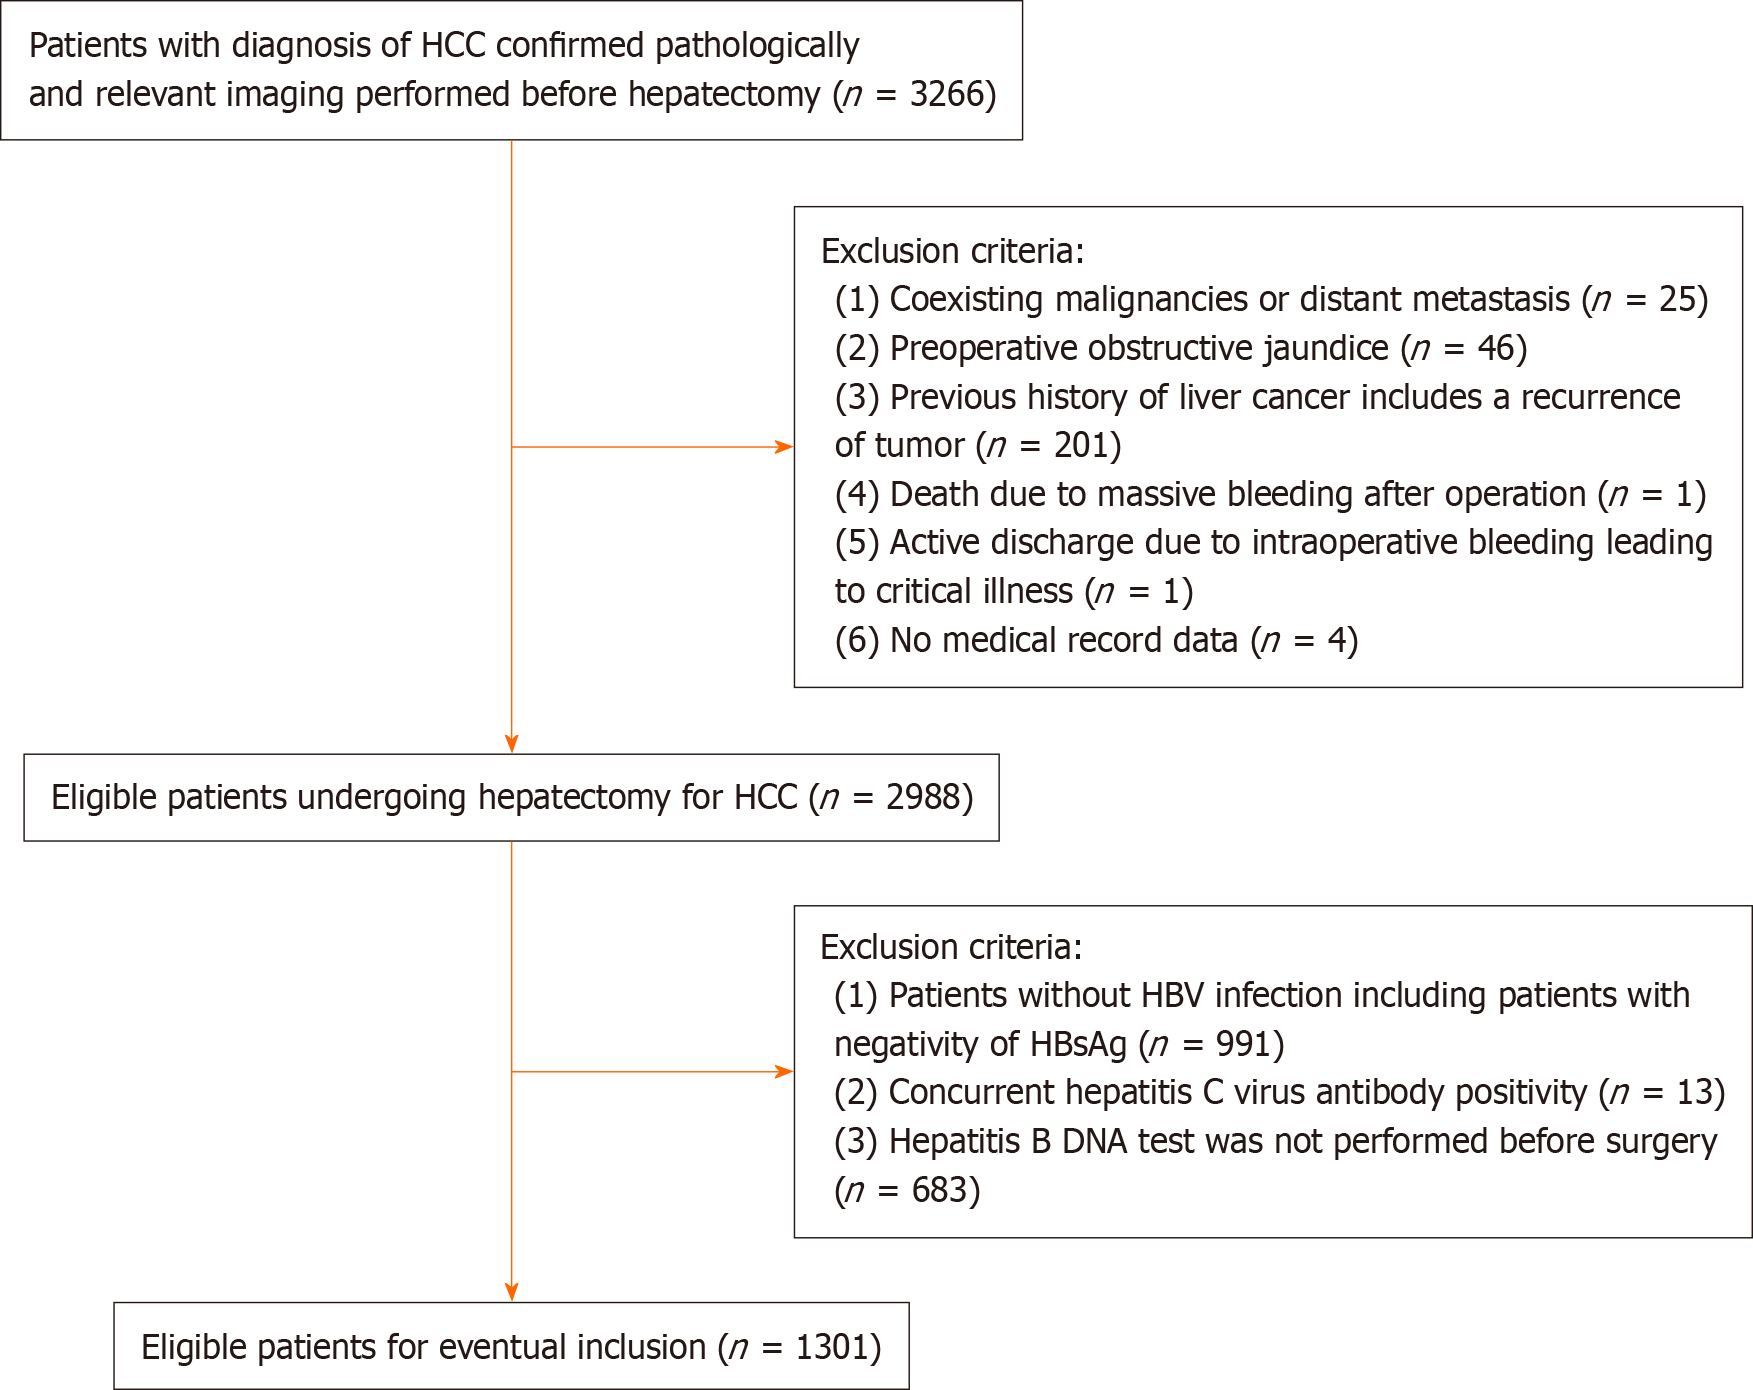
Figure 1 Flow chart of the patient enrolling process.
HCC: Hepatocellular carcinoma; HBV: Hepatitis B virus; HBsAg: Hepatitis B surface antigen.
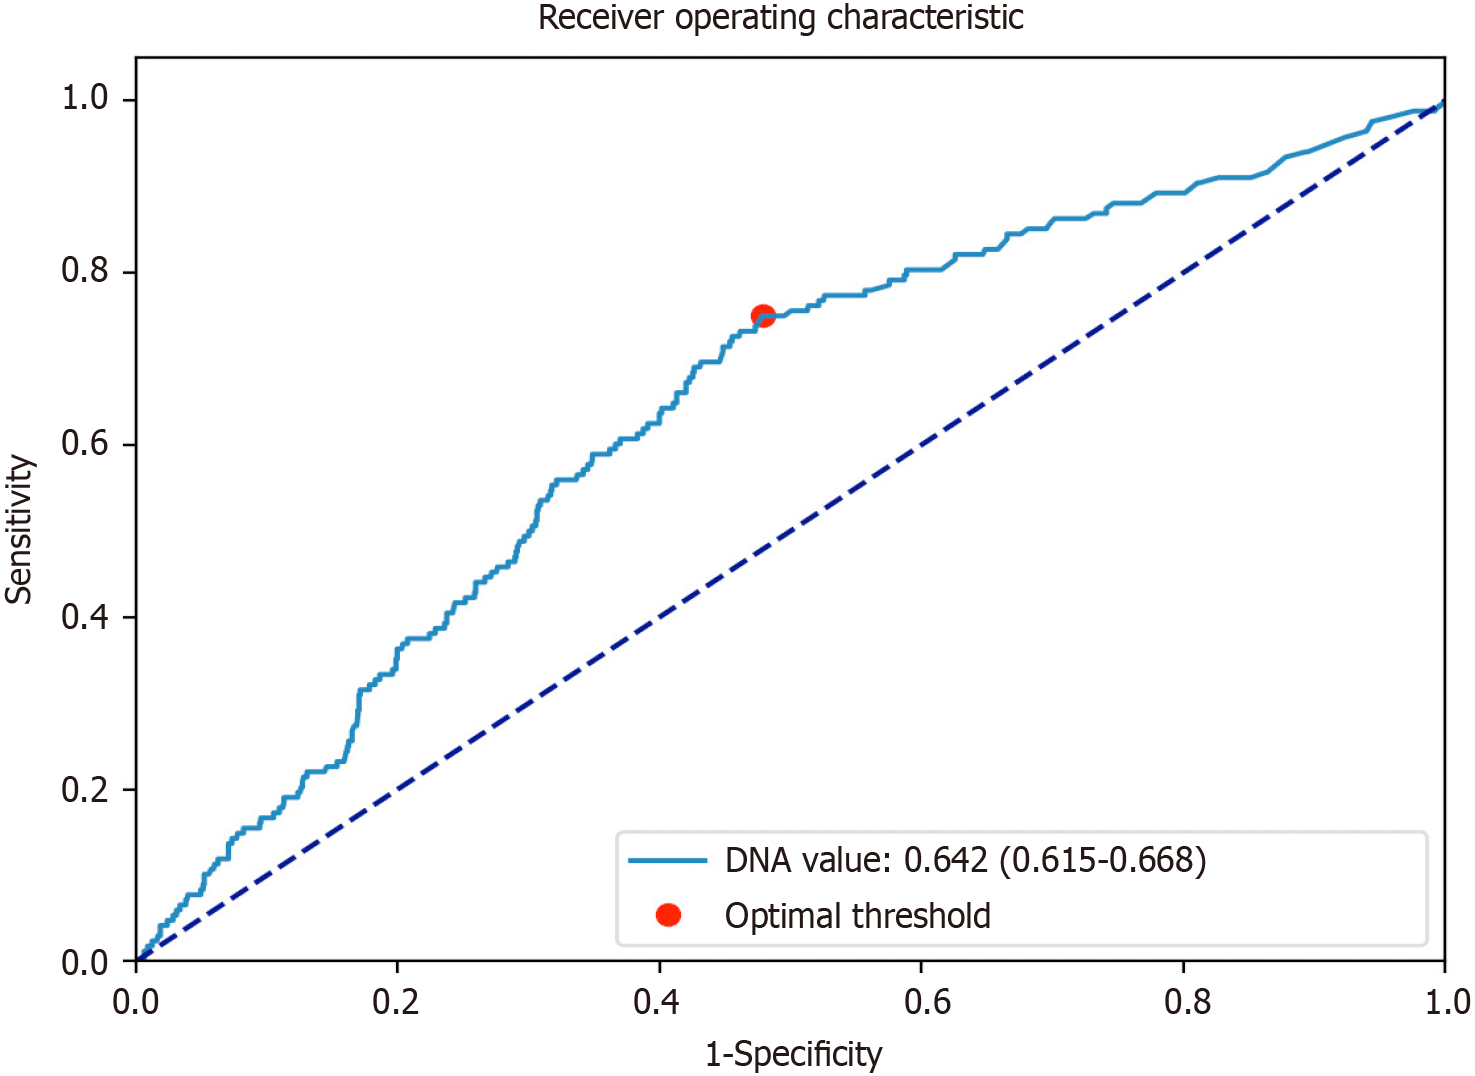
Figure 2 The receiver operating characteristic curve of hepatitis B virus DNA value for predicting the occurrence of post-hepatectomy liver failure.
Figure 3 Comparison of the receiver operating characteristic curves for predicting post-hepatectomy liver failure using each reference score model alone and the new model combining hepatitis B virus DNA level.
A: The receiver operating characteristic (ROC) curves of albumin-bilirubin (ALBI) and ALBI + hepatitis B virus (HBV) DNA level; B: The ROC curves of fibrosis-4 (FIB-4) and FIB-4 + HBV DNA level; C: The ROC curves of aspartate aminotransferase-to-platelet ratio index (APRI) and APRI + HBV DNA level. ROC: Receiver operating characteristic; ALBI: Albumin-bilirubin; AUROC: The area under the receiver operating characteristic; HBV: Hepatitis B virus; FIB-4: Fibrosis-4.
Figure 4 Decision curve of the reference score models and the developed models combining hepatitis B virus DNA level.
A: Decision curves of albumin-bilirubin (ALBI) and ALBI + hepatitis B virus (HBV) DNA level; B: Decision curves of fibrosis-4 (FIB4) and FIB4 + HBV DNA level; C: Decision curves of aspartate aminotransferase-to-platelet ratio index (APRI) and APRI + HBV DNA level. ALBI: Albumin-bilirubin; HBV: Hepatitis B virus; FIB-4: Fibrosis-4.
- Citation: Wang X, Lin ZY, Zhou Y, Zhong Q, Li ZR, Lin XX, Hu MG, He KL. Association of preoperative antiviral treatment with incidences of post-hepatectomy liver failure in hepatitis B virus-related hepatocellular carcinoma. World J Gastrointest Surg 2024; 16(7): 2106-2118
- URL: https://www.wjgnet.com/1948-9366/full/v16/i7/2106.htm
- DOI: https://dx.doi.org/10.4240/wjgs.v16.i7.2106


