Copyright
©The Author(s) 2024.
World J Gastrointest Surg. Apr 27, 2024; 16(4): 1087-1096
Published online Apr 27, 2024. doi: 10.4240/wjgs.v16.i4.1087
Published online Apr 27, 2024. doi: 10.4240/wjgs.v16.i4.1087
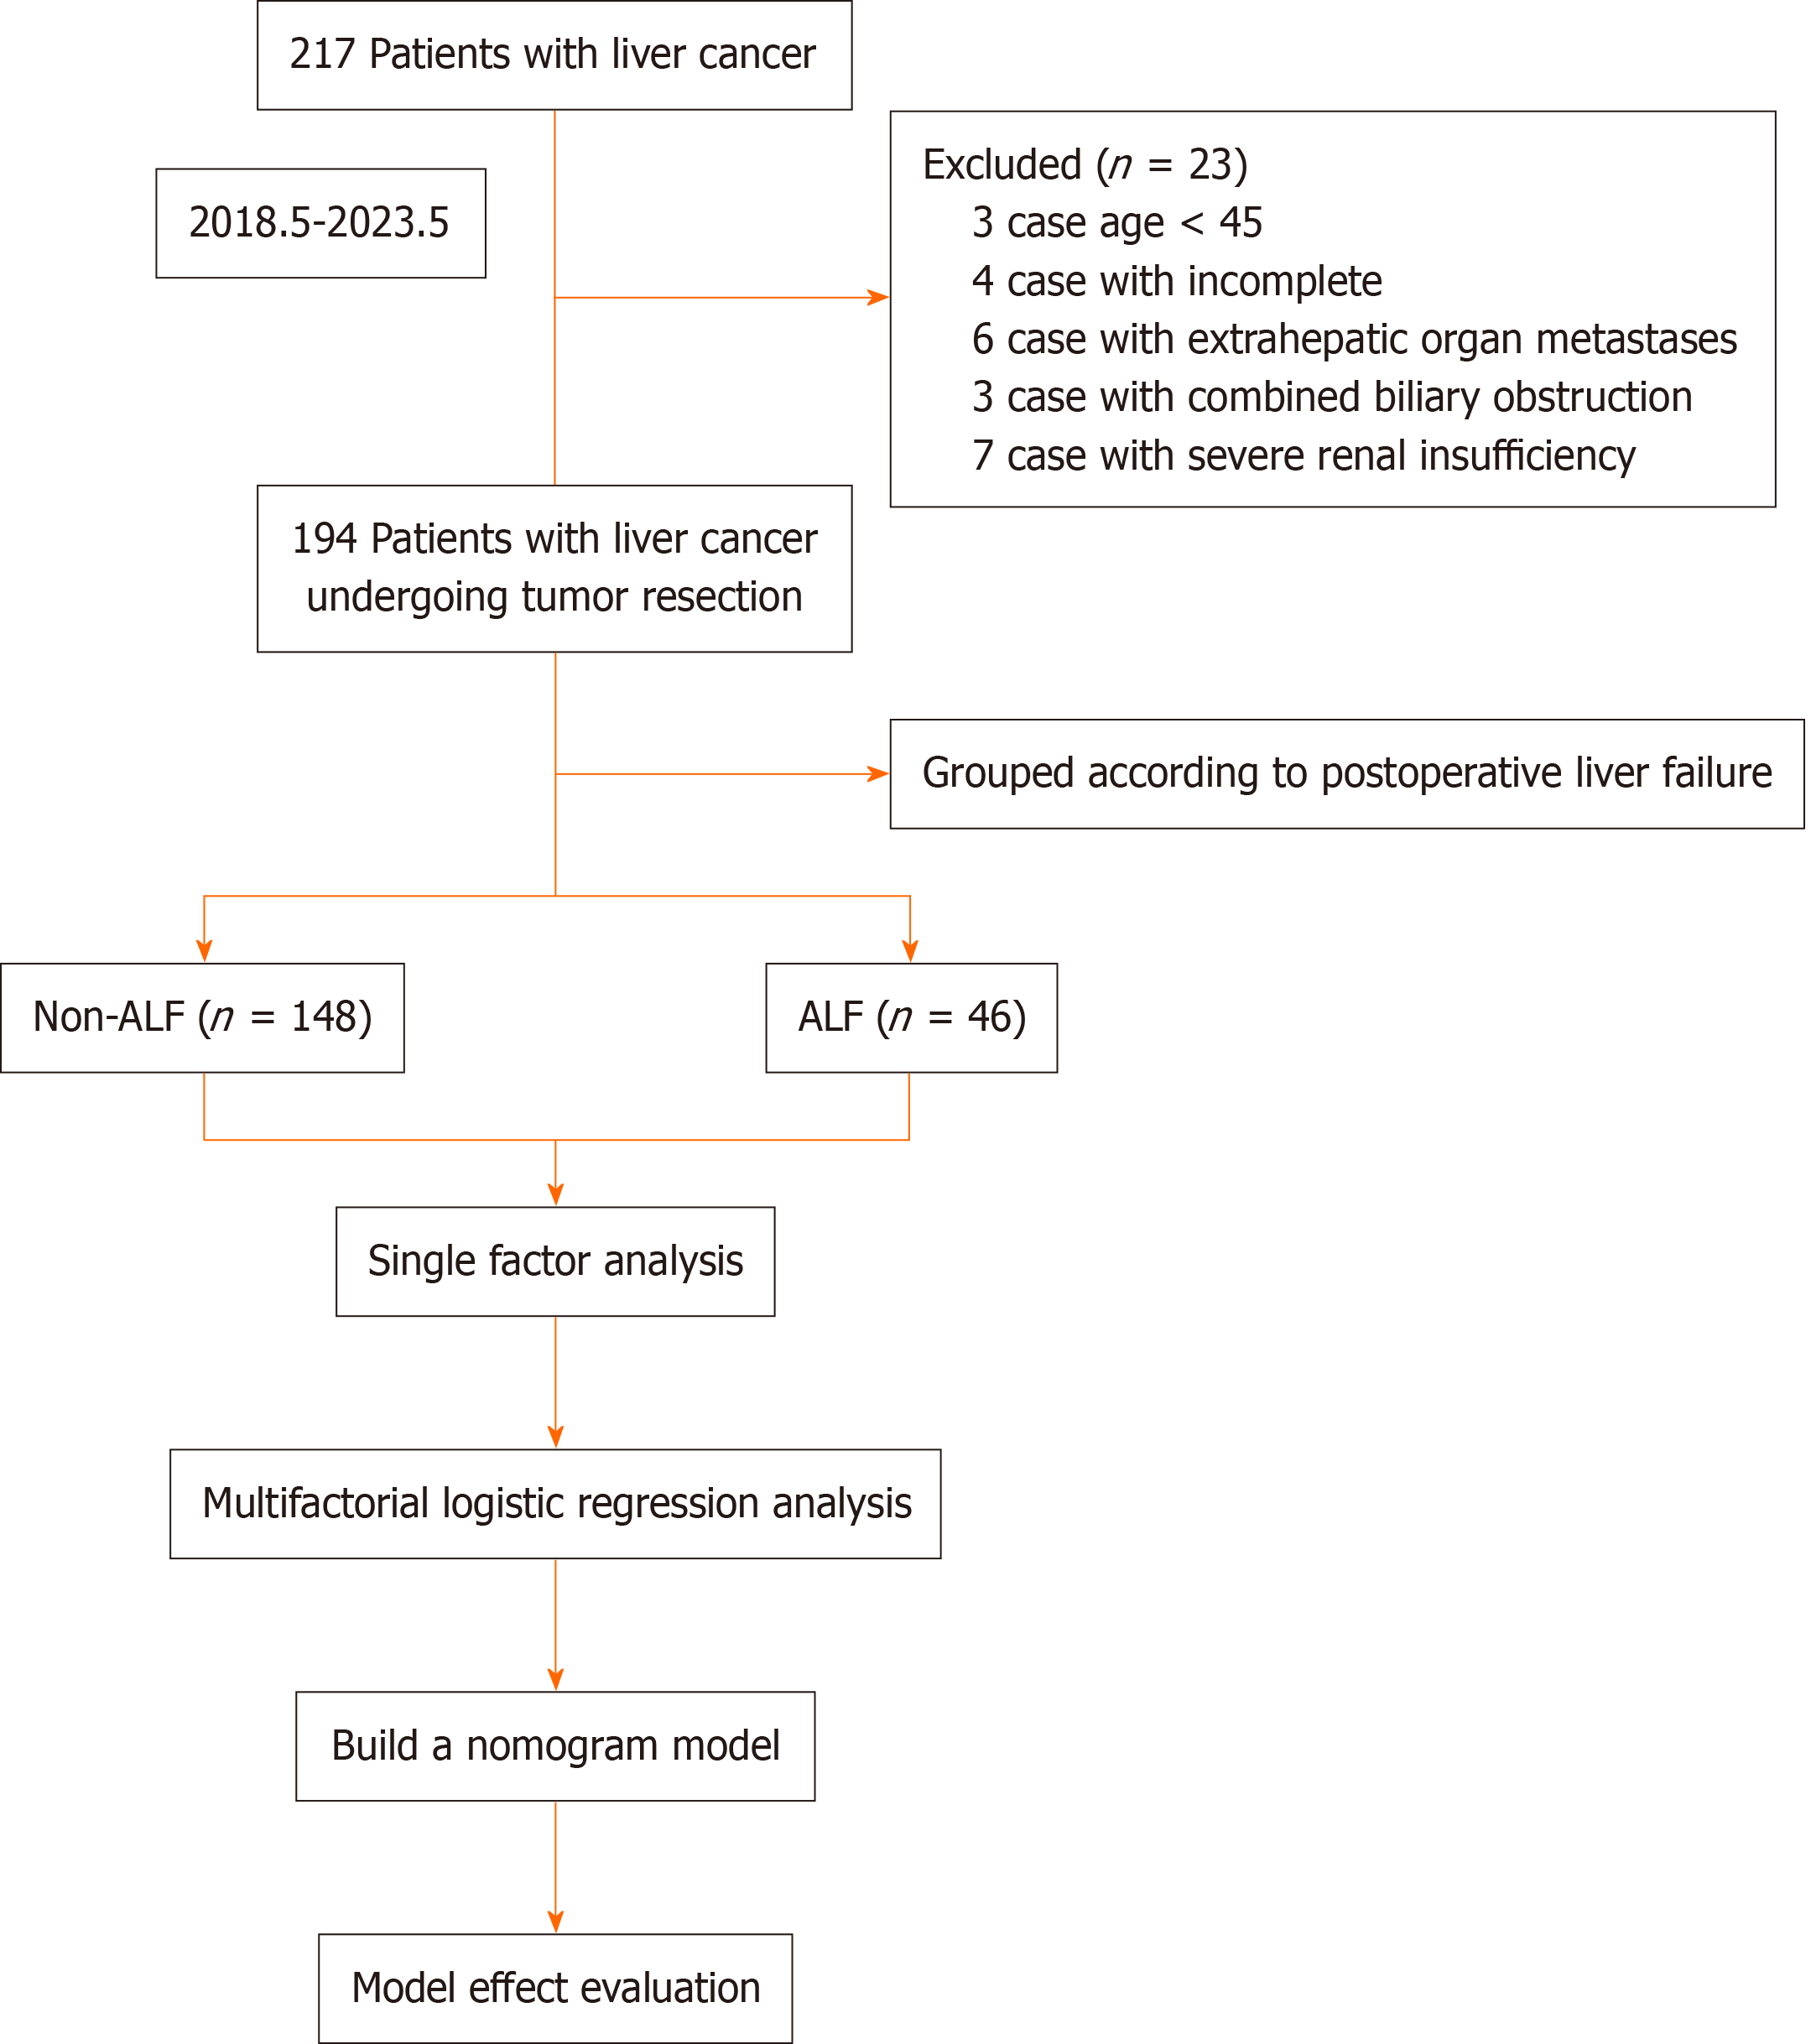
Figure 1 Experimental flow chart.
ALF: Acute liver failure.
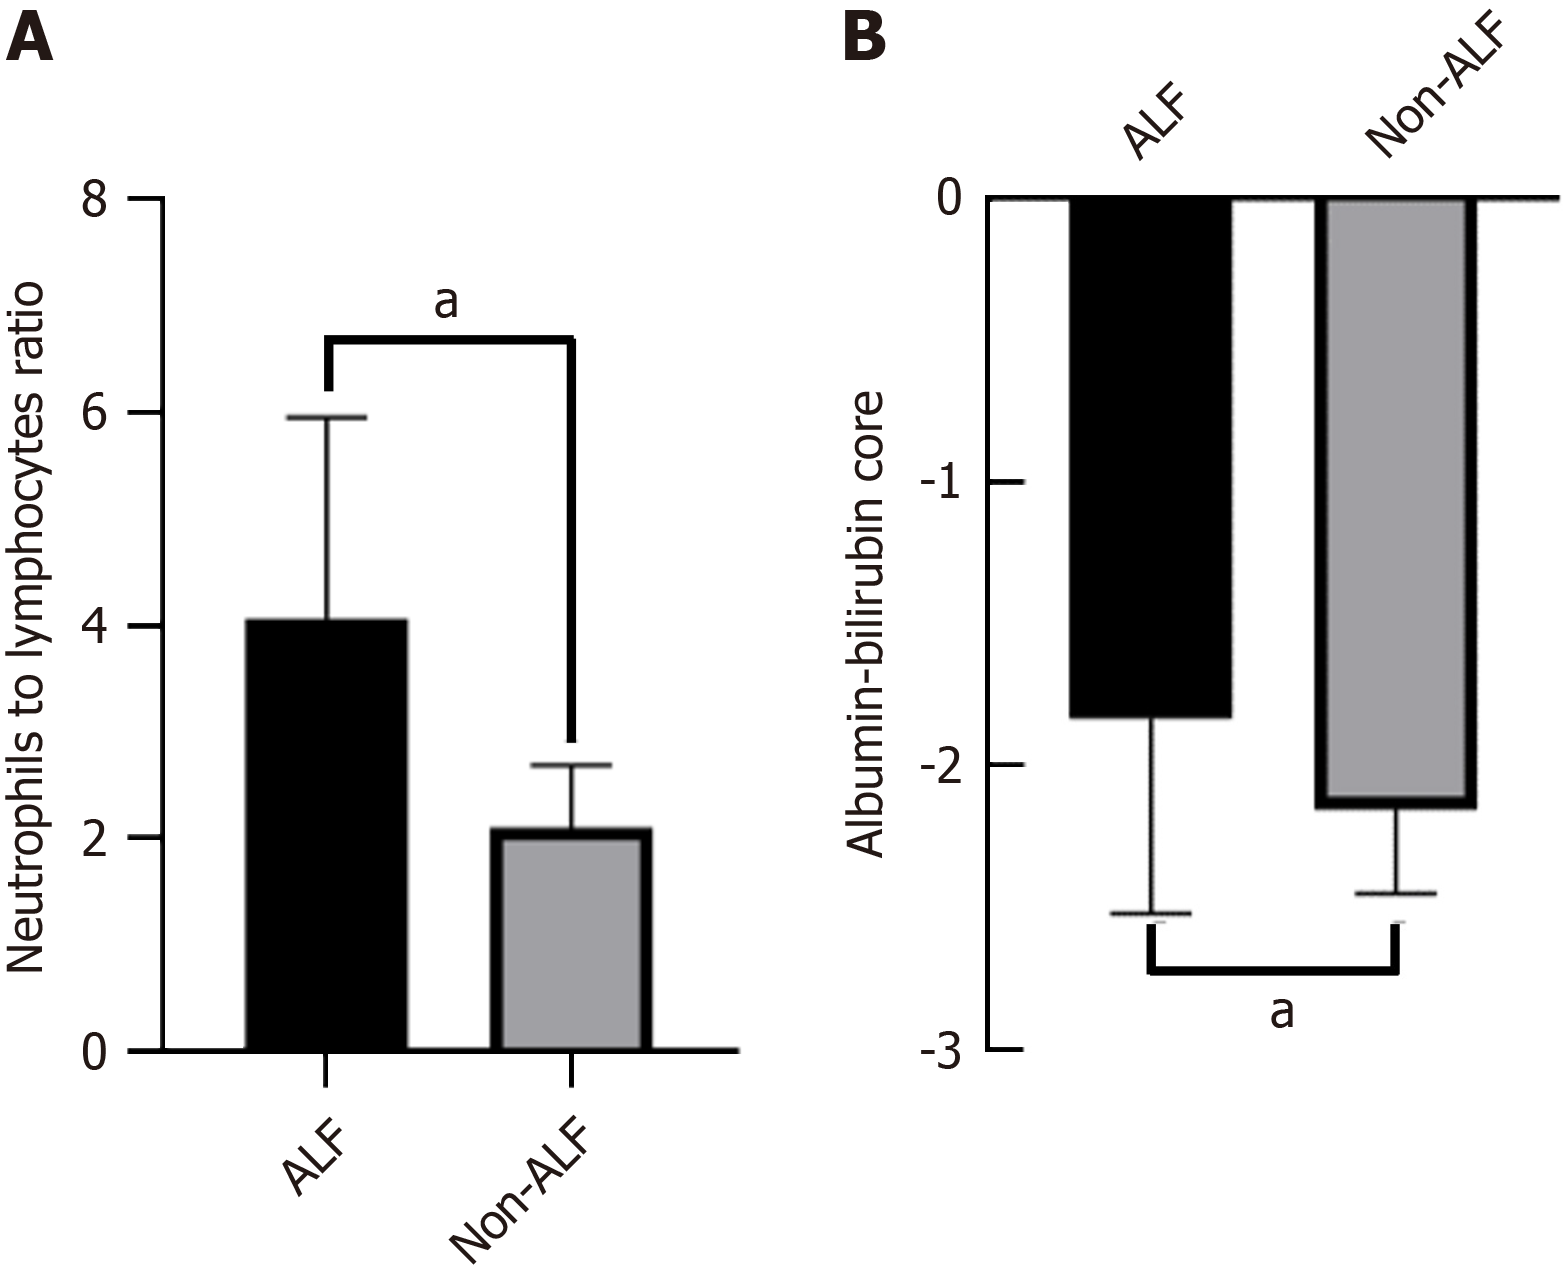
Figure 2 Comparison of the differences between the acute liver failure group and non-acute liver failure group.
A: Neutrophil-to-lymphocyte ratio; B: Albumin-bilirubin score. aP < 0.05. ALF: Acute liver failure.
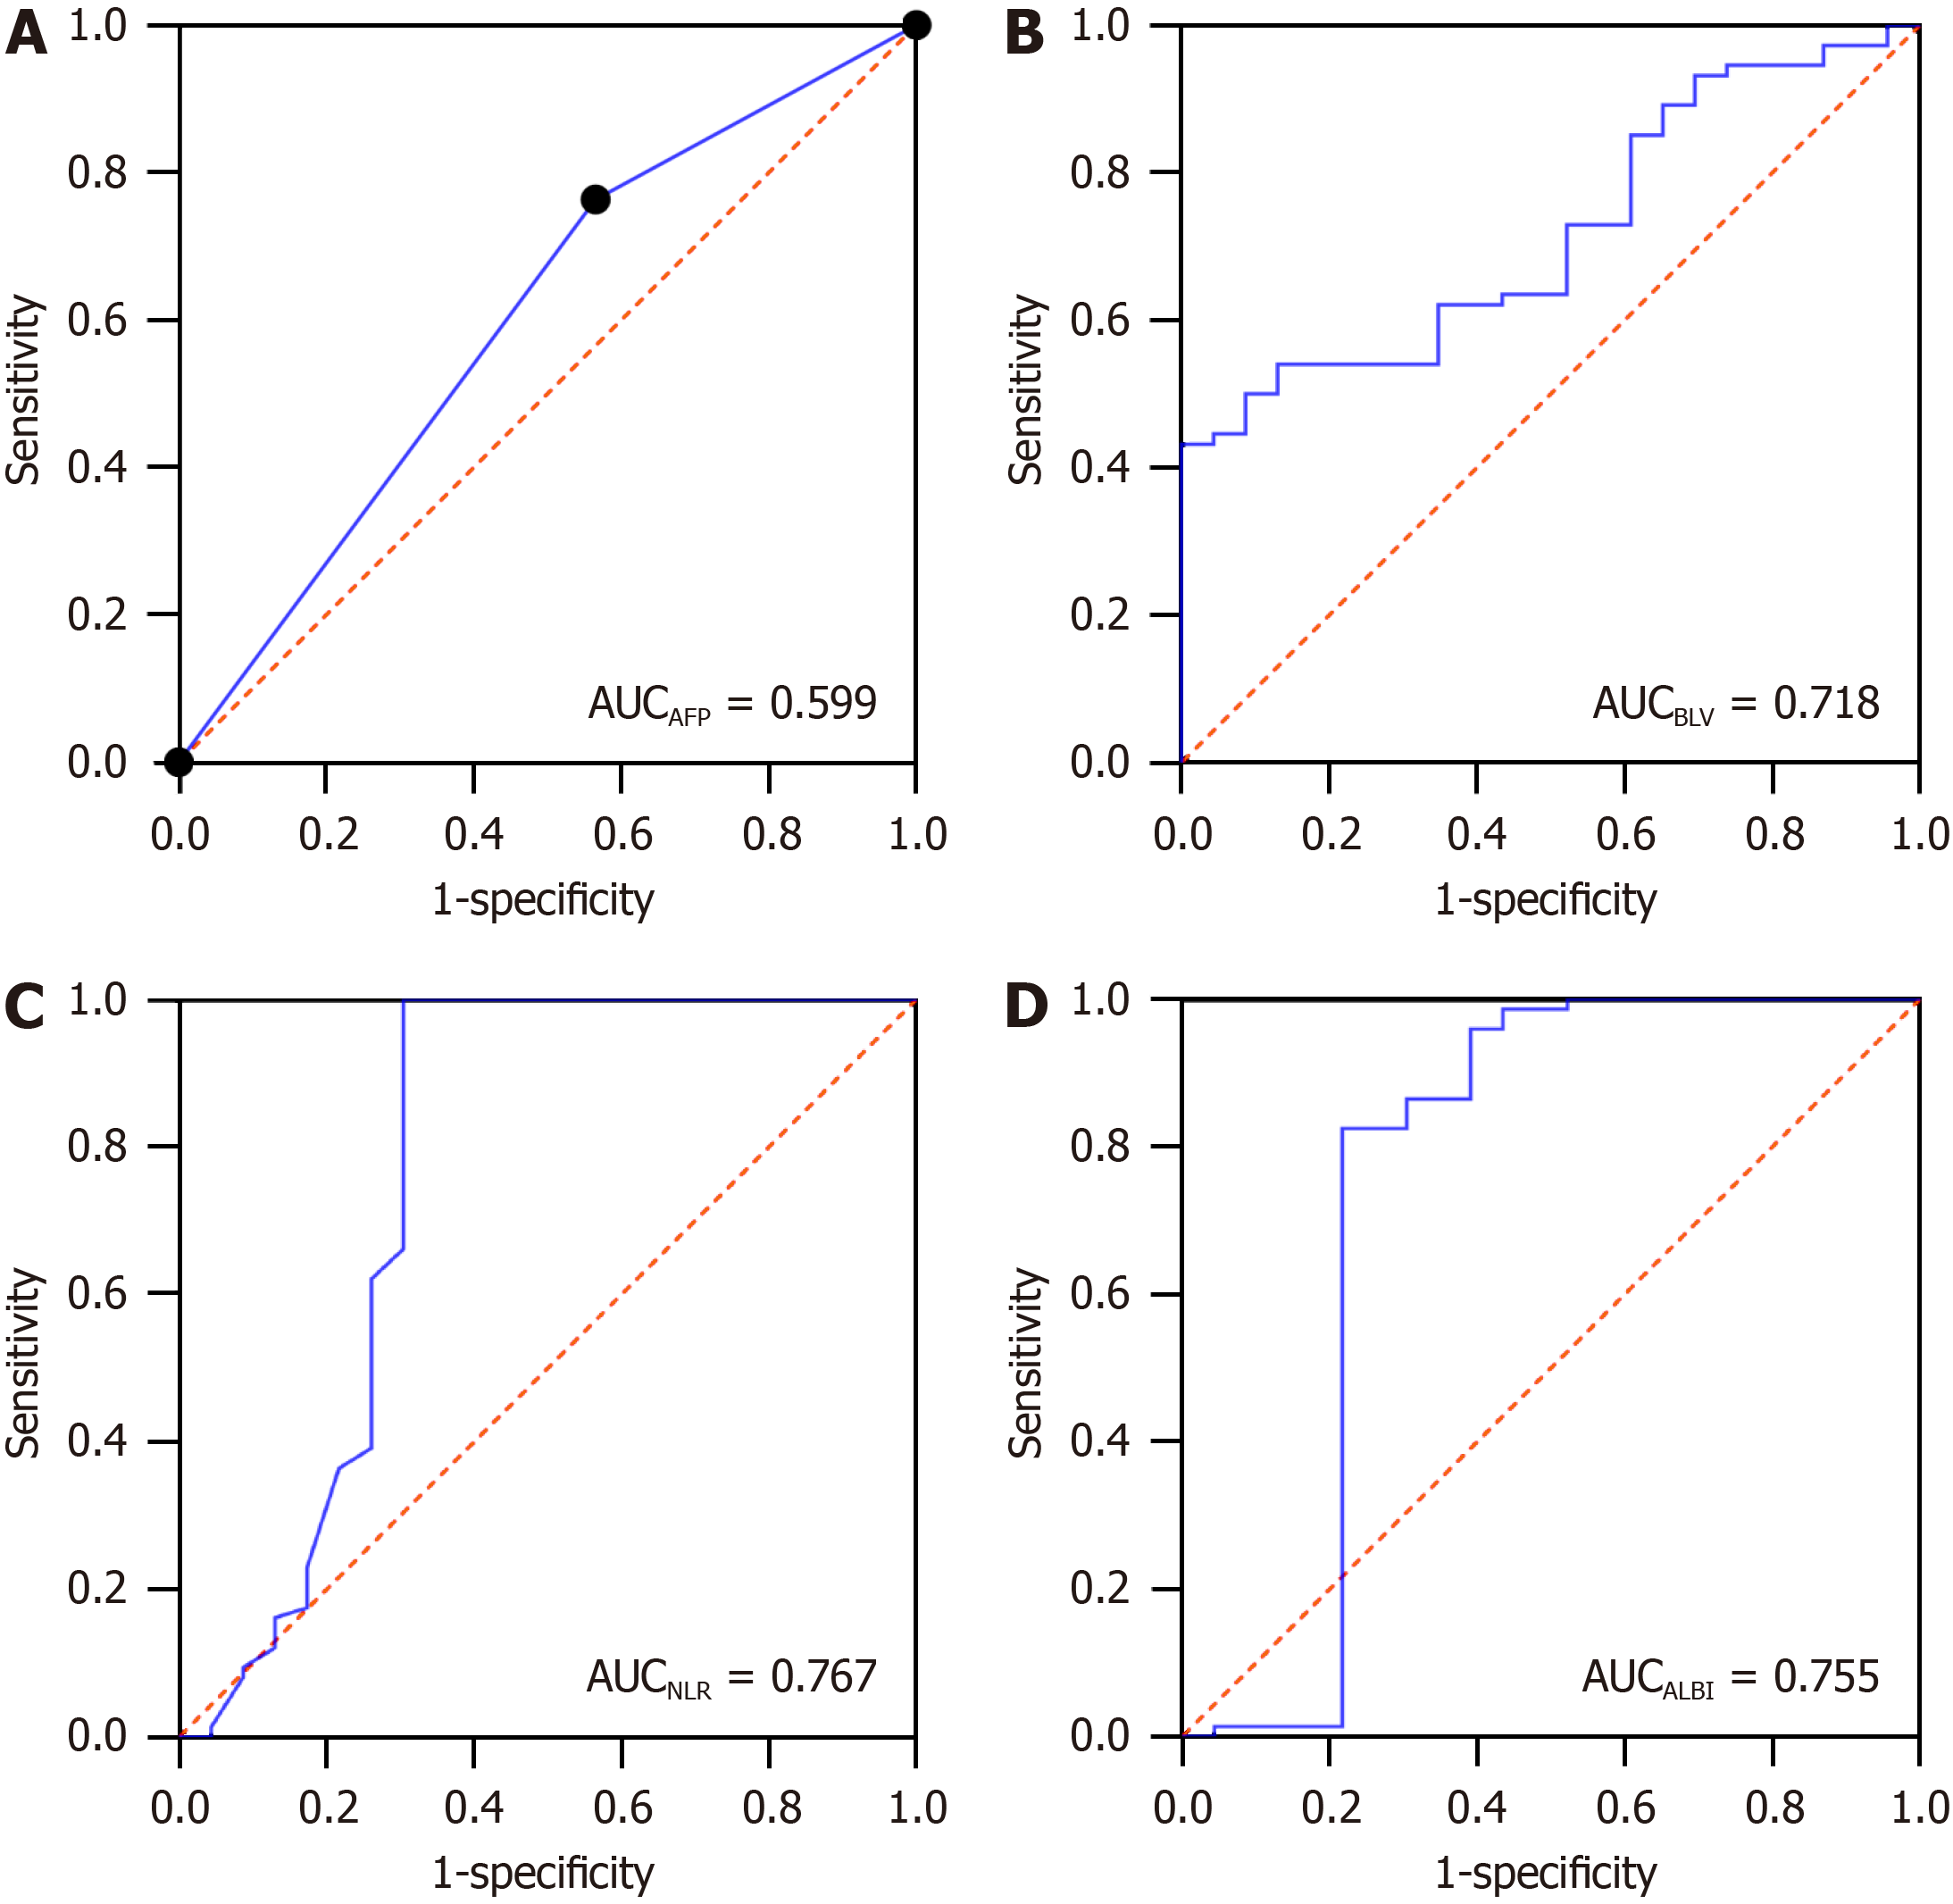
Figure 3 Receiver operating characteristic curves of predicting the occurrence of acute liver failure after R0 surgery for hepatocellular carcinoma.
A: Acute liver failure; B: Blood loss volume; C: Neutrophil-to-lymphocyte ratio; D: Albumin-bilirubin score. AFP: Acute liver failure; BLV: Blood loss volume; NLR: Neutrophil-to-lymphocyte ratio; ALBI: Albumin-bilirubin score; AUC: Area under the curve.
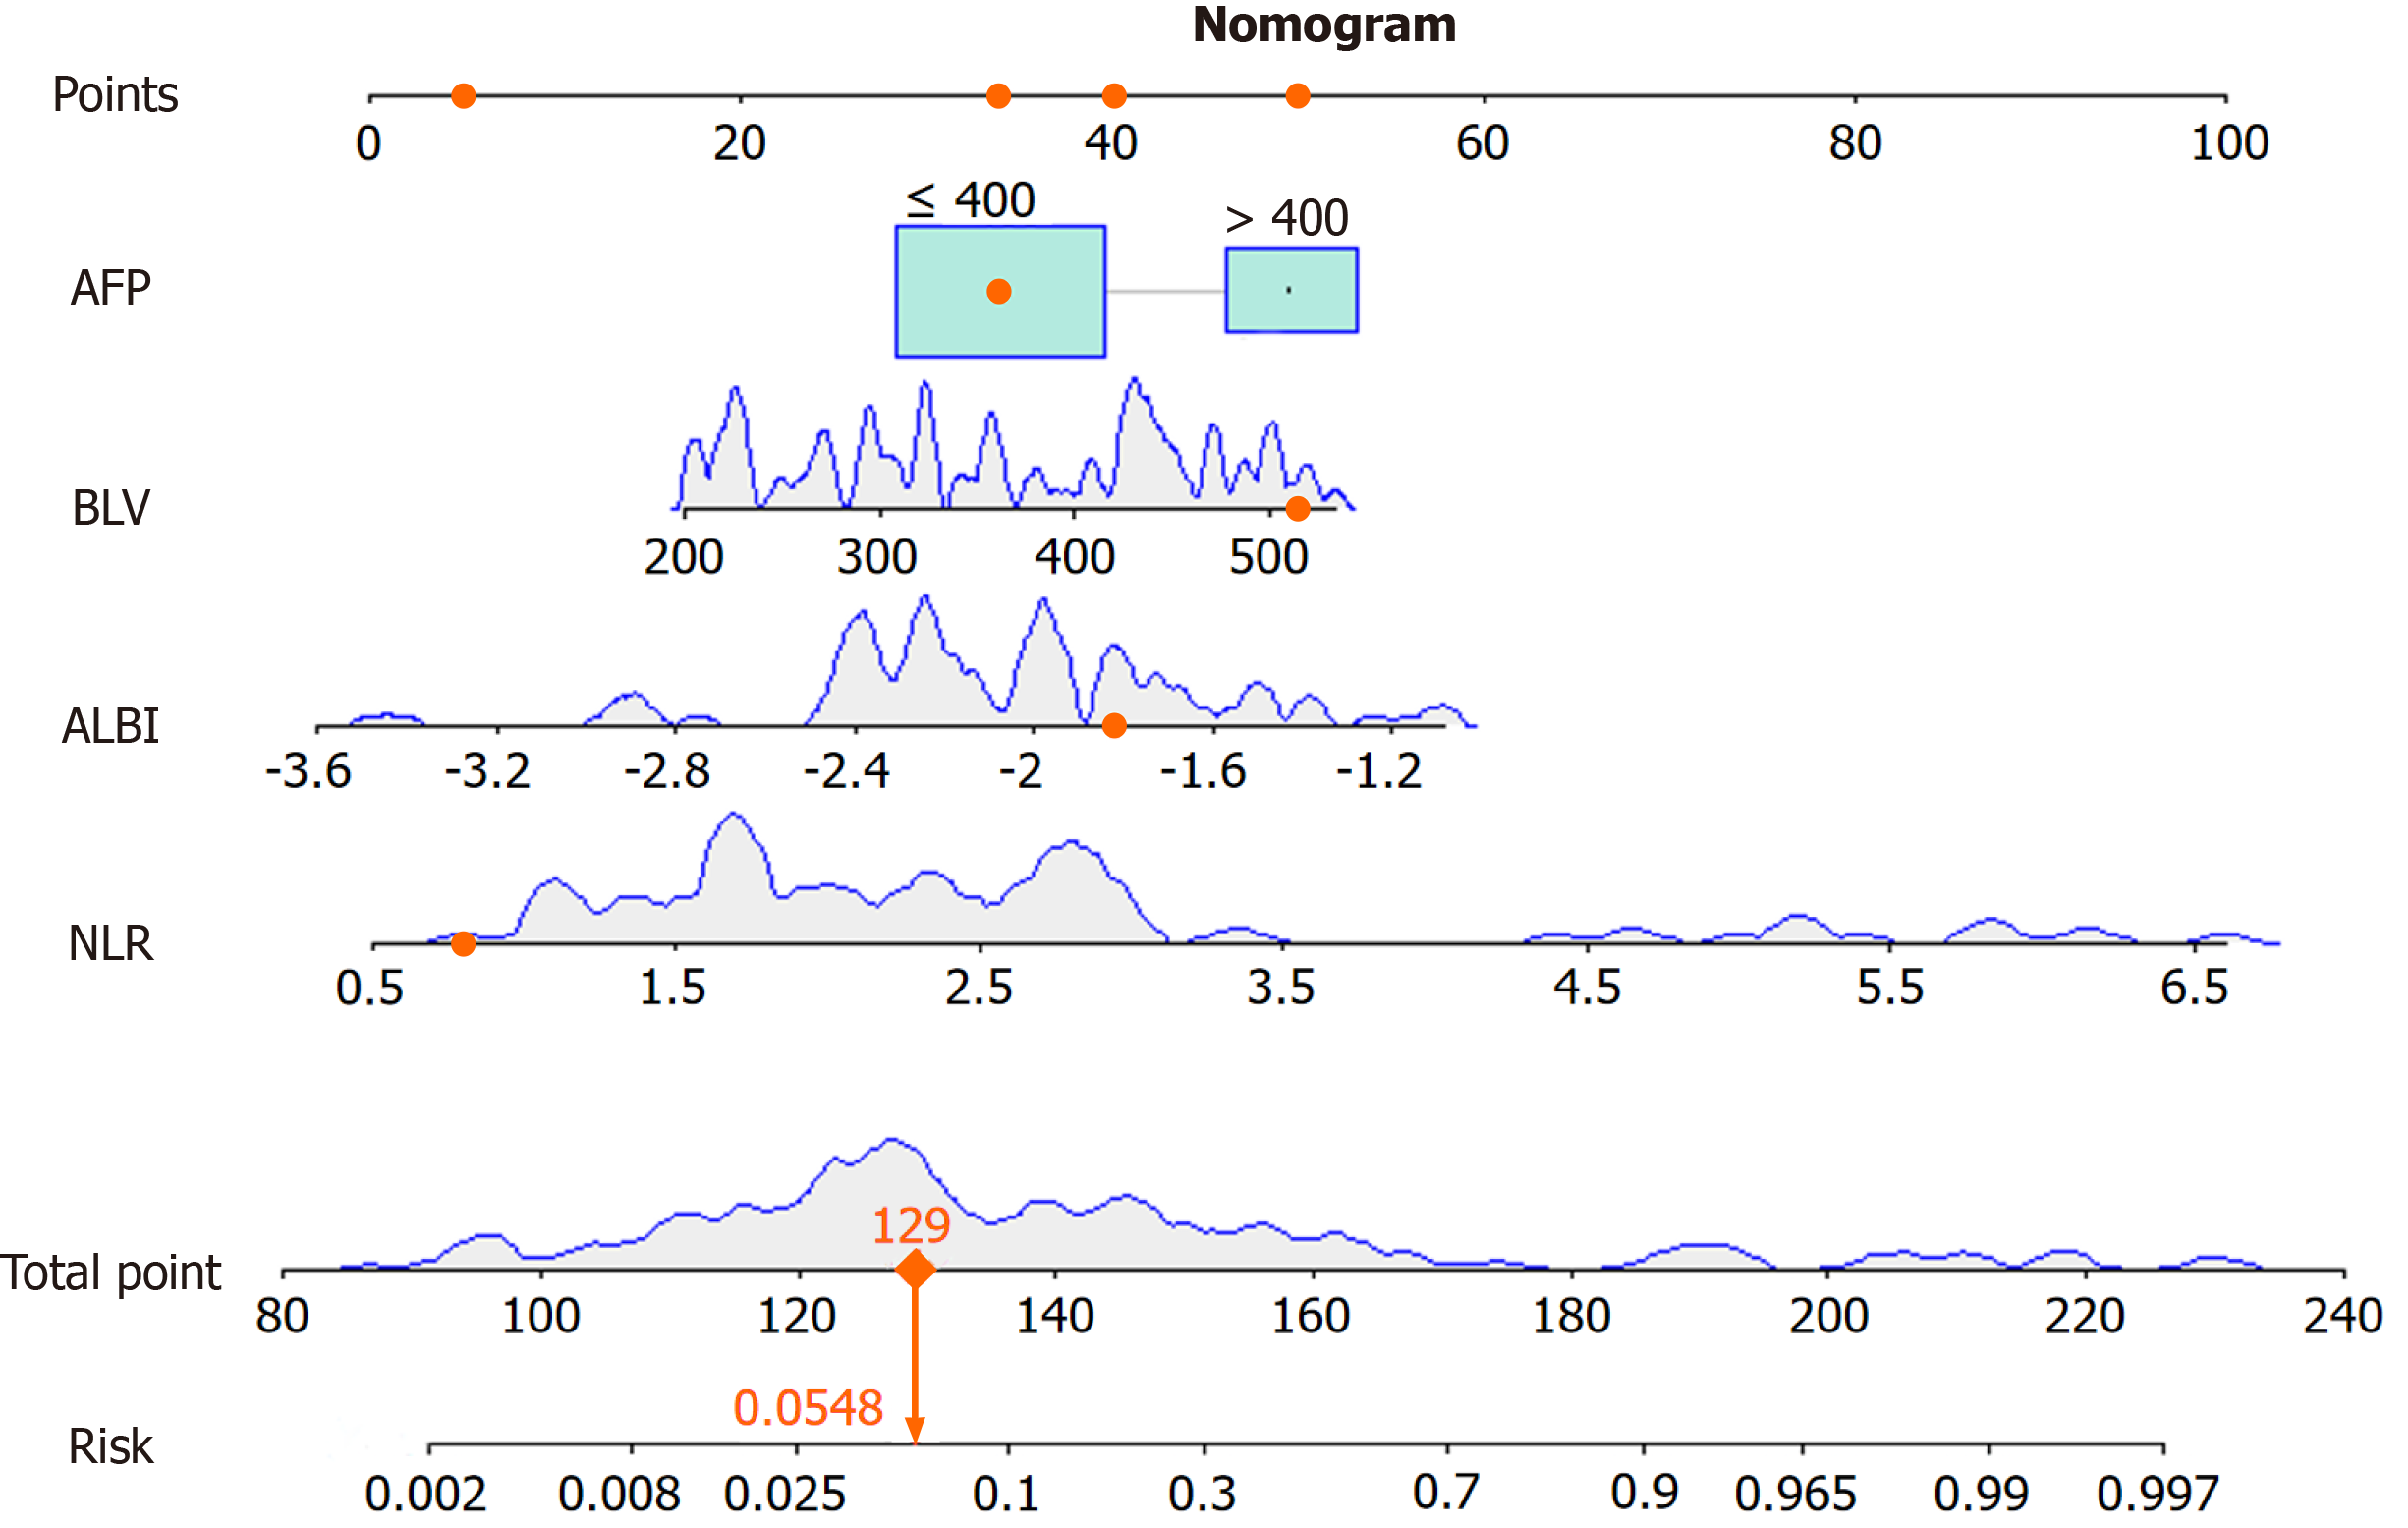
Figure 4 Nomogram prediction model for the occurrence of acute liver failure after R0 surgery for hepatocellular carcinoma.
AFP: Acute liver failure; BLV: Blood loss volume; NLR: Neutrophil-to-lymphocyte ratio; ALBI: Albumin-bilirubin score.
Figure 5 Evaluation of the nomogram prediction model.
A: Receiver operating characteristic curve; B: Calibration curve; C: Decision curve analysis. AUC: Area under the curve.
- Citation: Li XP, Bao ZT, Wang L, Zhang CY, Yang W. Construction of a predictive model for acute liver failure after hepatectomy based on neutrophil-to-lymphocyte ratio and albumin-bilirubin score. World J Gastrointest Surg 2024; 16(4): 1087-1096
- URL: https://www.wjgnet.com/1948-9366/full/v16/i4/1087.htm
- DOI: https://dx.doi.org/10.4240/wjgs.v16.i4.1087


