Copyright
©The Author(s) 2024.
World J Gastrointest Surg. Feb 27, 2024; 16(2): 345-356
Published online Feb 27, 2024. doi: 10.4240/wjgs.v16.i2.345
Published online Feb 27, 2024. doi: 10.4240/wjgs.v16.i2.345
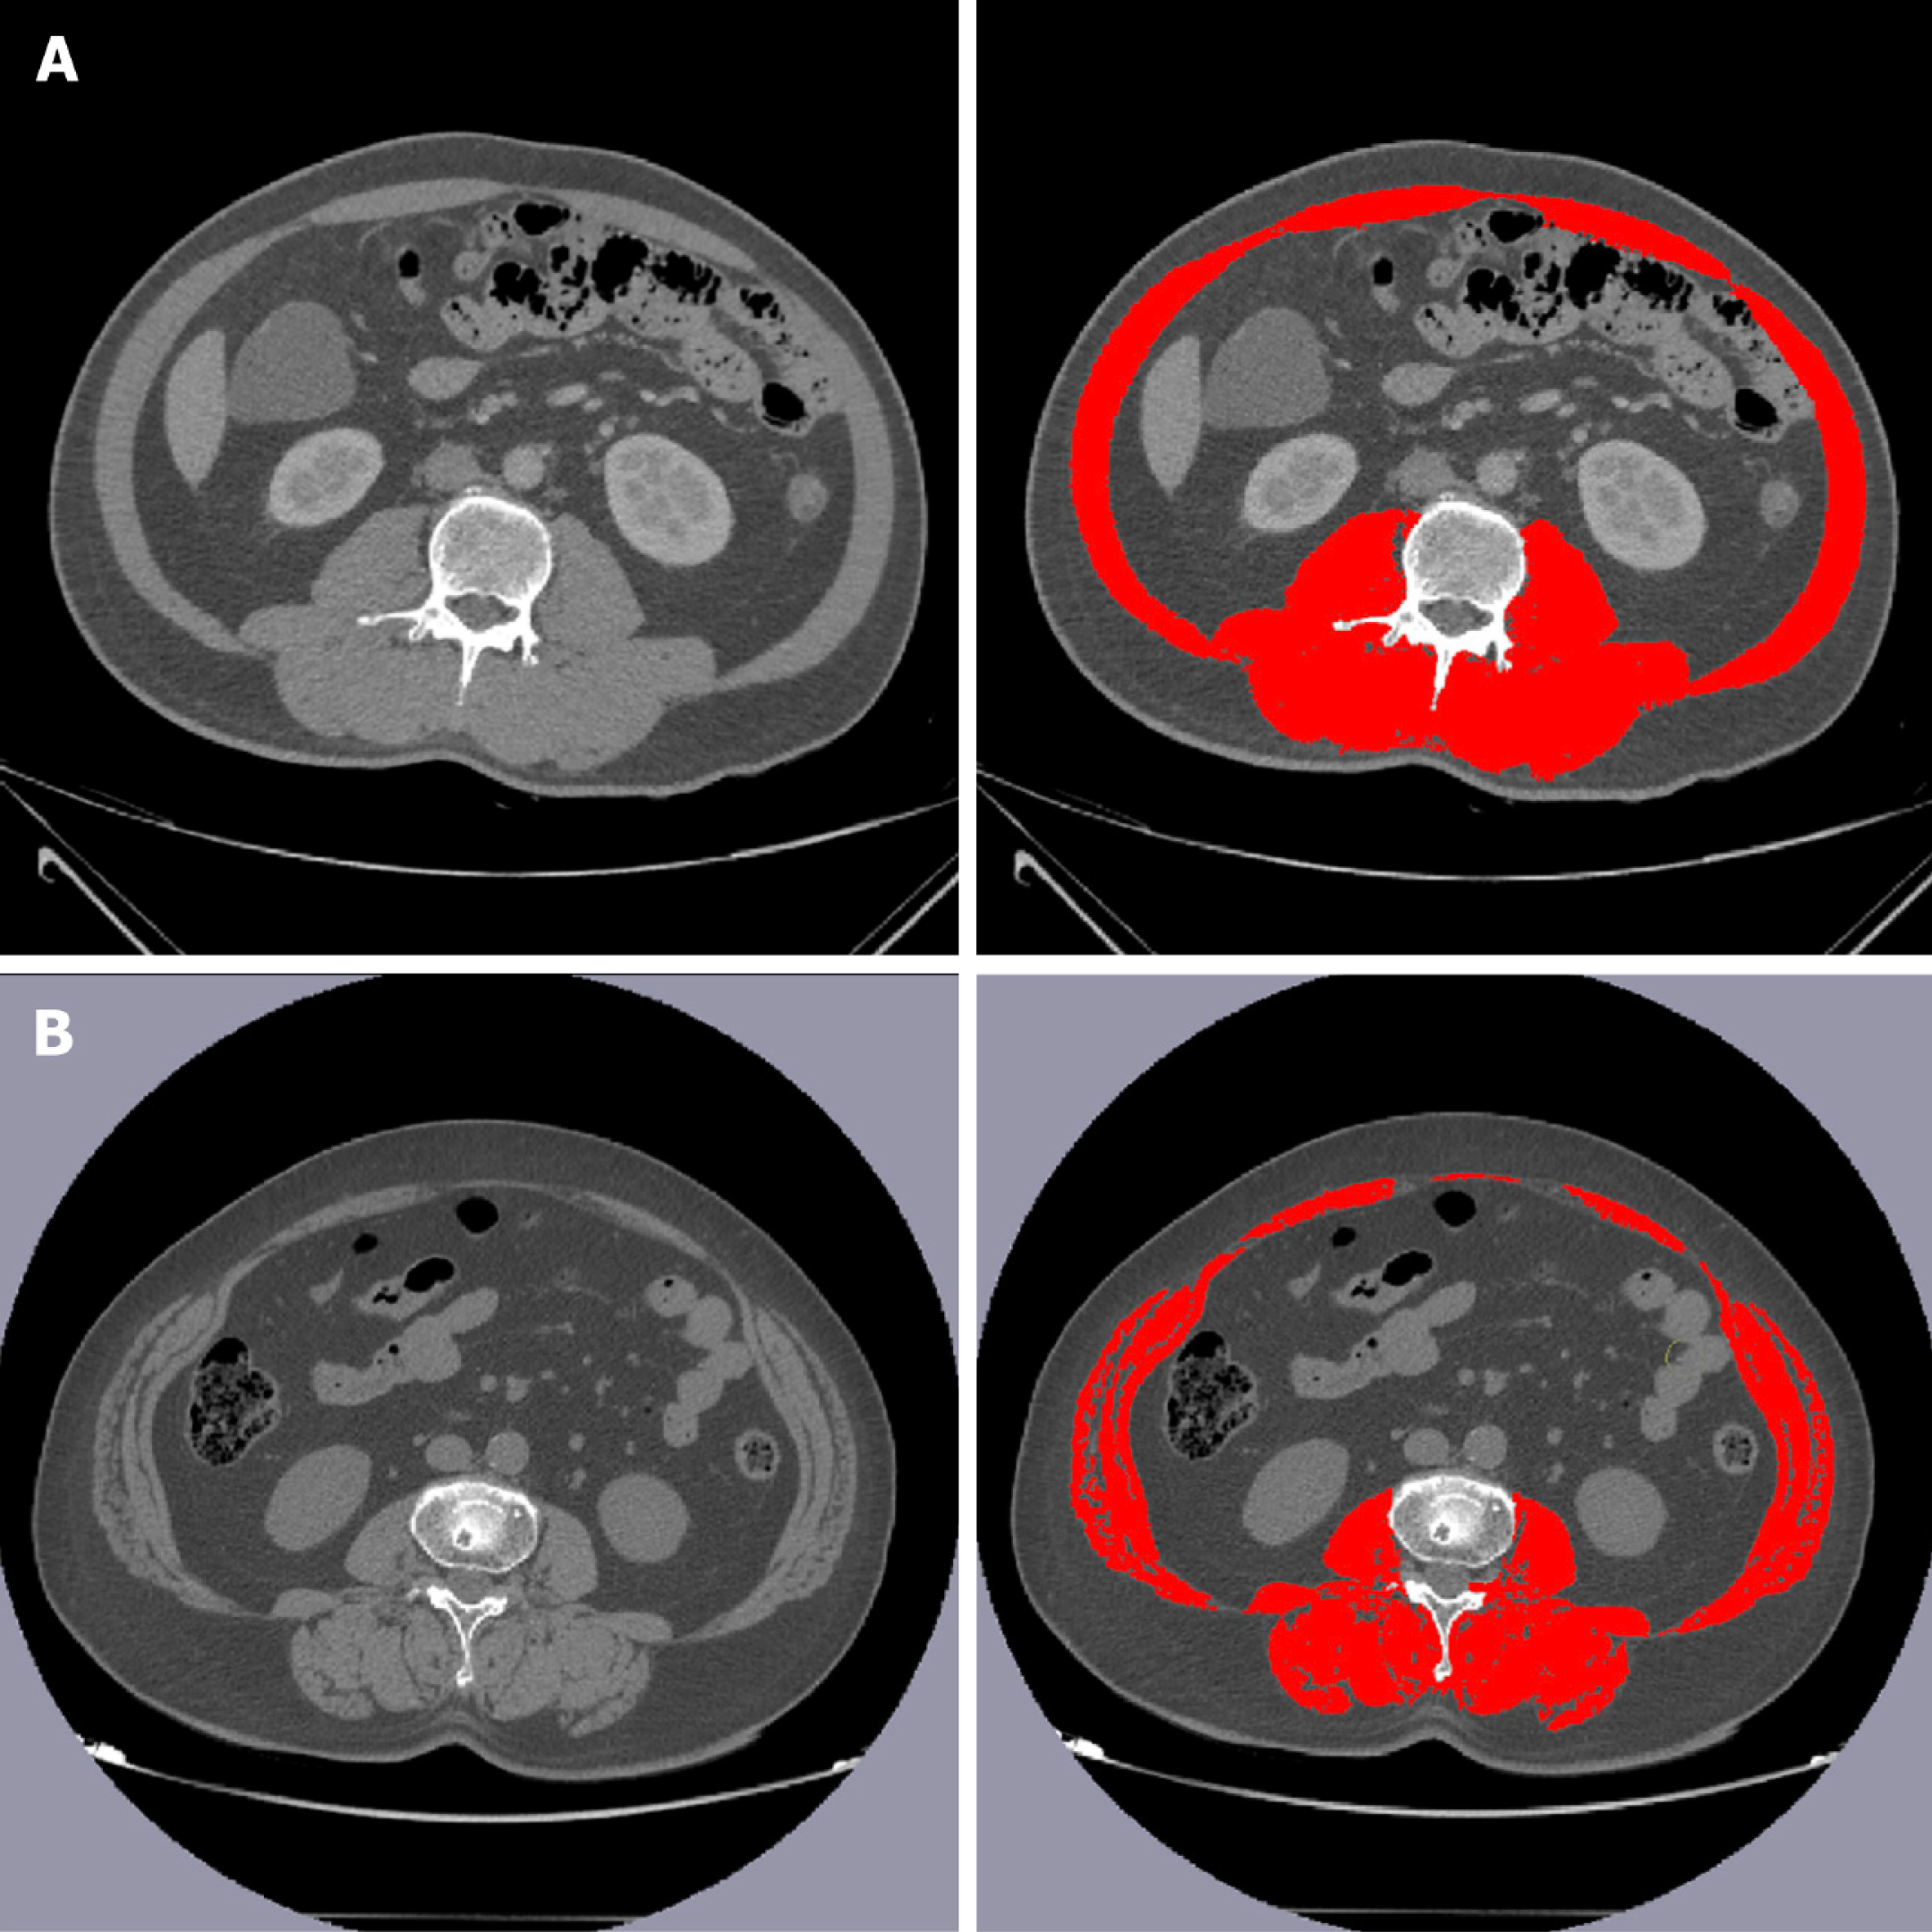
Figure 1 Schematic diagram of skeletal muscle density and skeletal muscle index measurement.
A: A 58-year-old male with a skeletal muscle density (SMD) and skeletal muscle index (SMI) of 47.8 and 50.3; B: A 62-year-old male with a SMD and SMI of 28.1 and 42.5.
Figure 2 Flow chart for radiomics extraction.
ROI: Regions of interest.
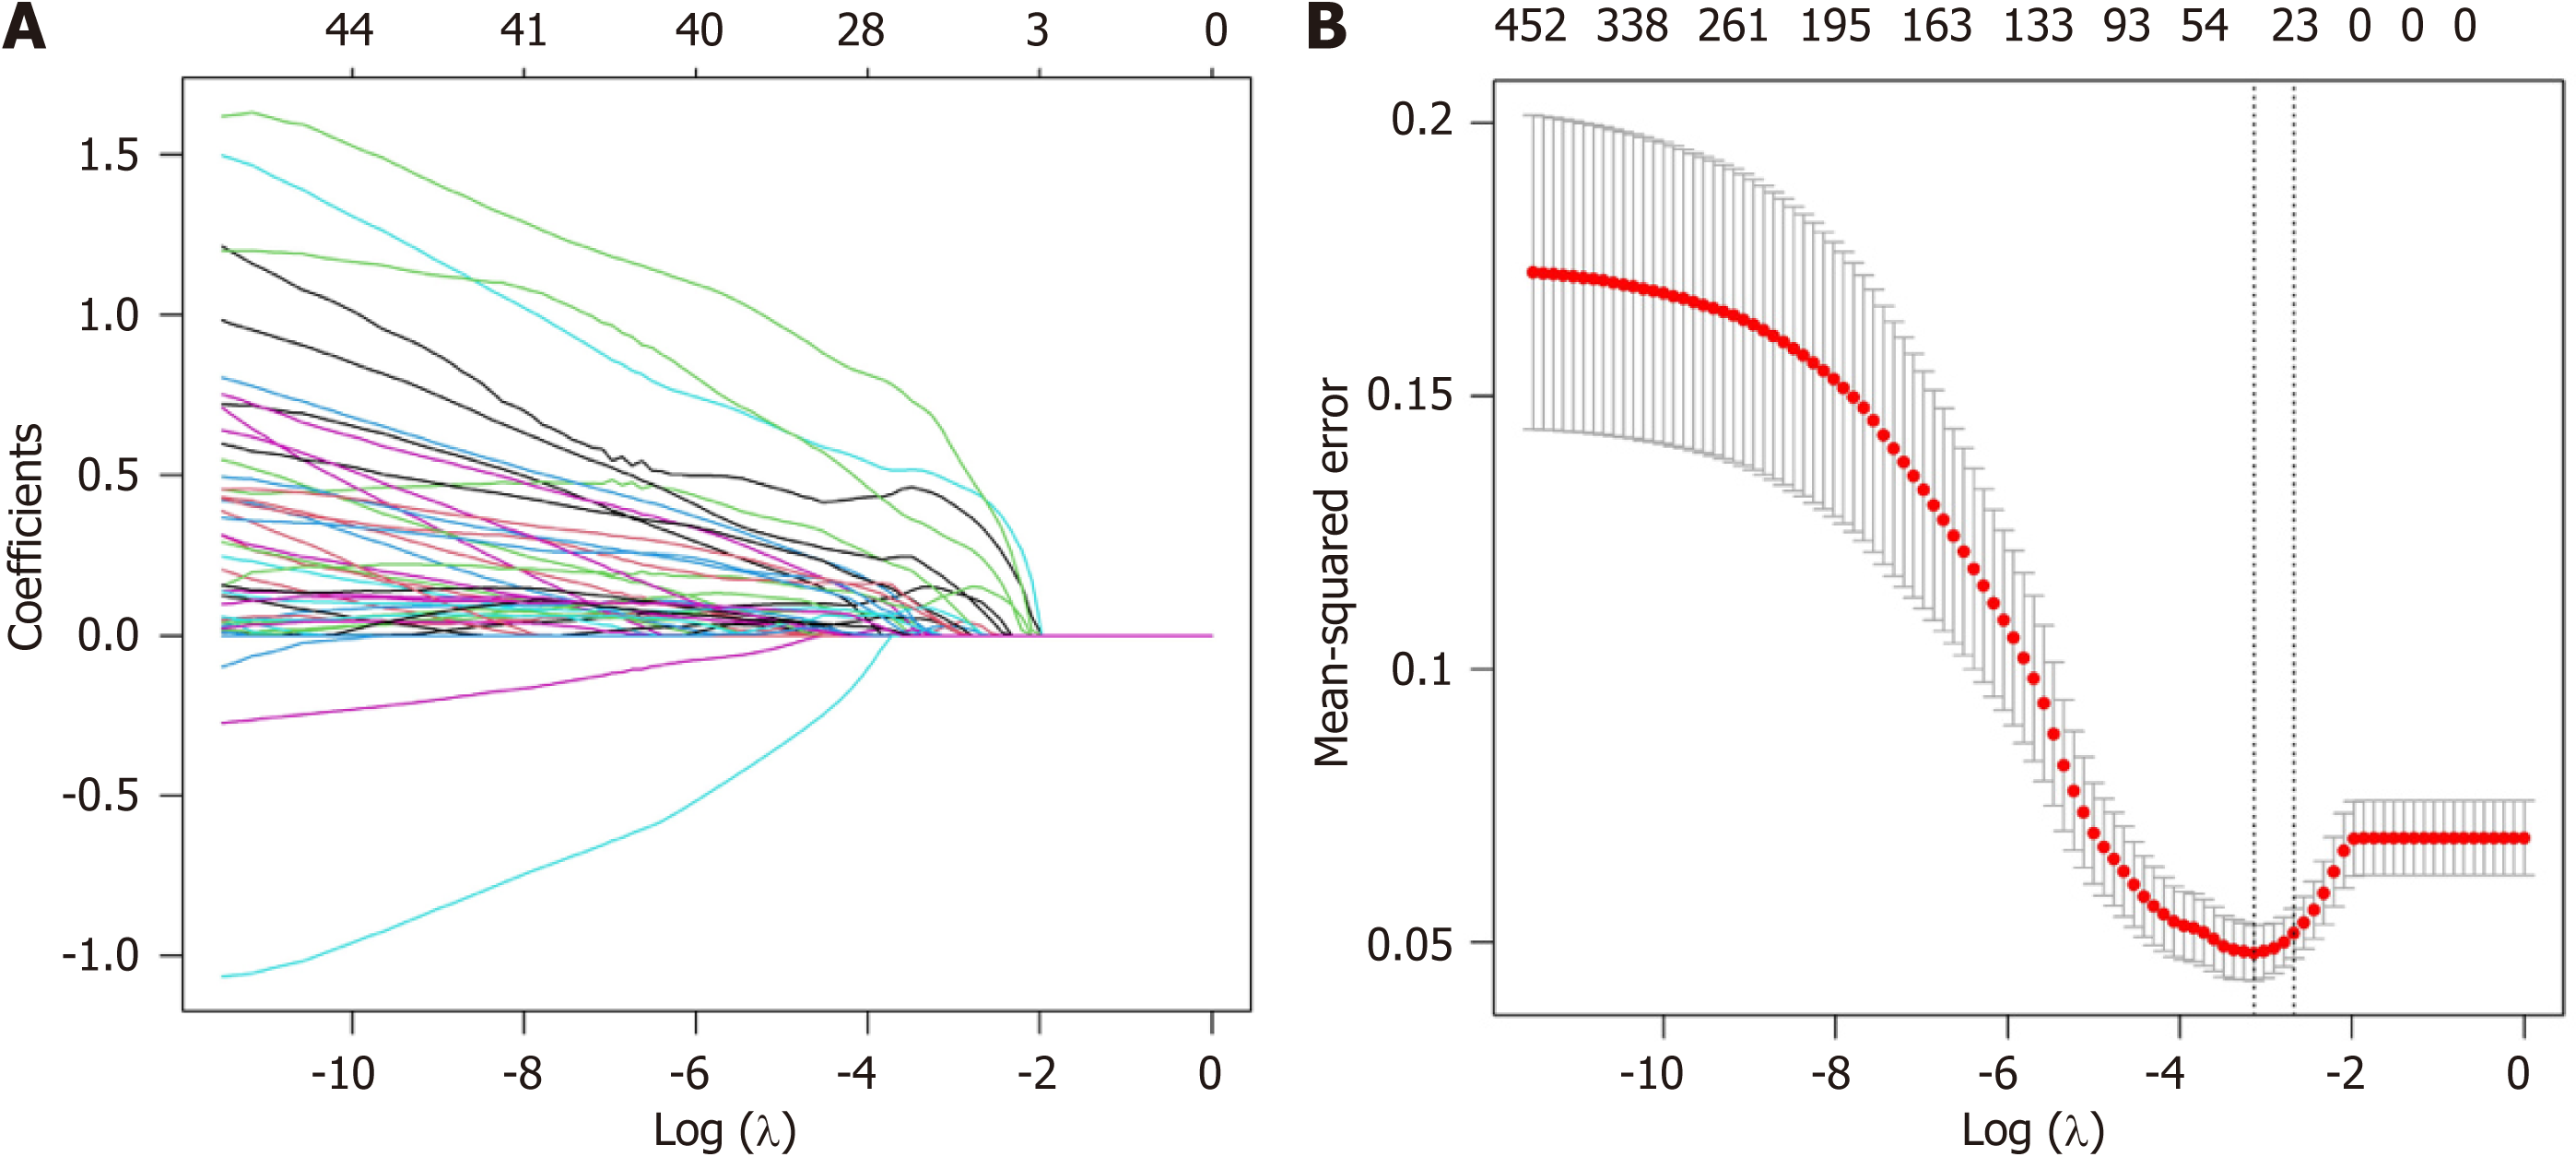
Figure 3 Feature selection using least absolute shrinkage and selection operator regression.
A: Least absolute shrinkage and selection operator (LASSO) coefficient path for radiomics features selection; B: LASSO regularization path of radiomics features.
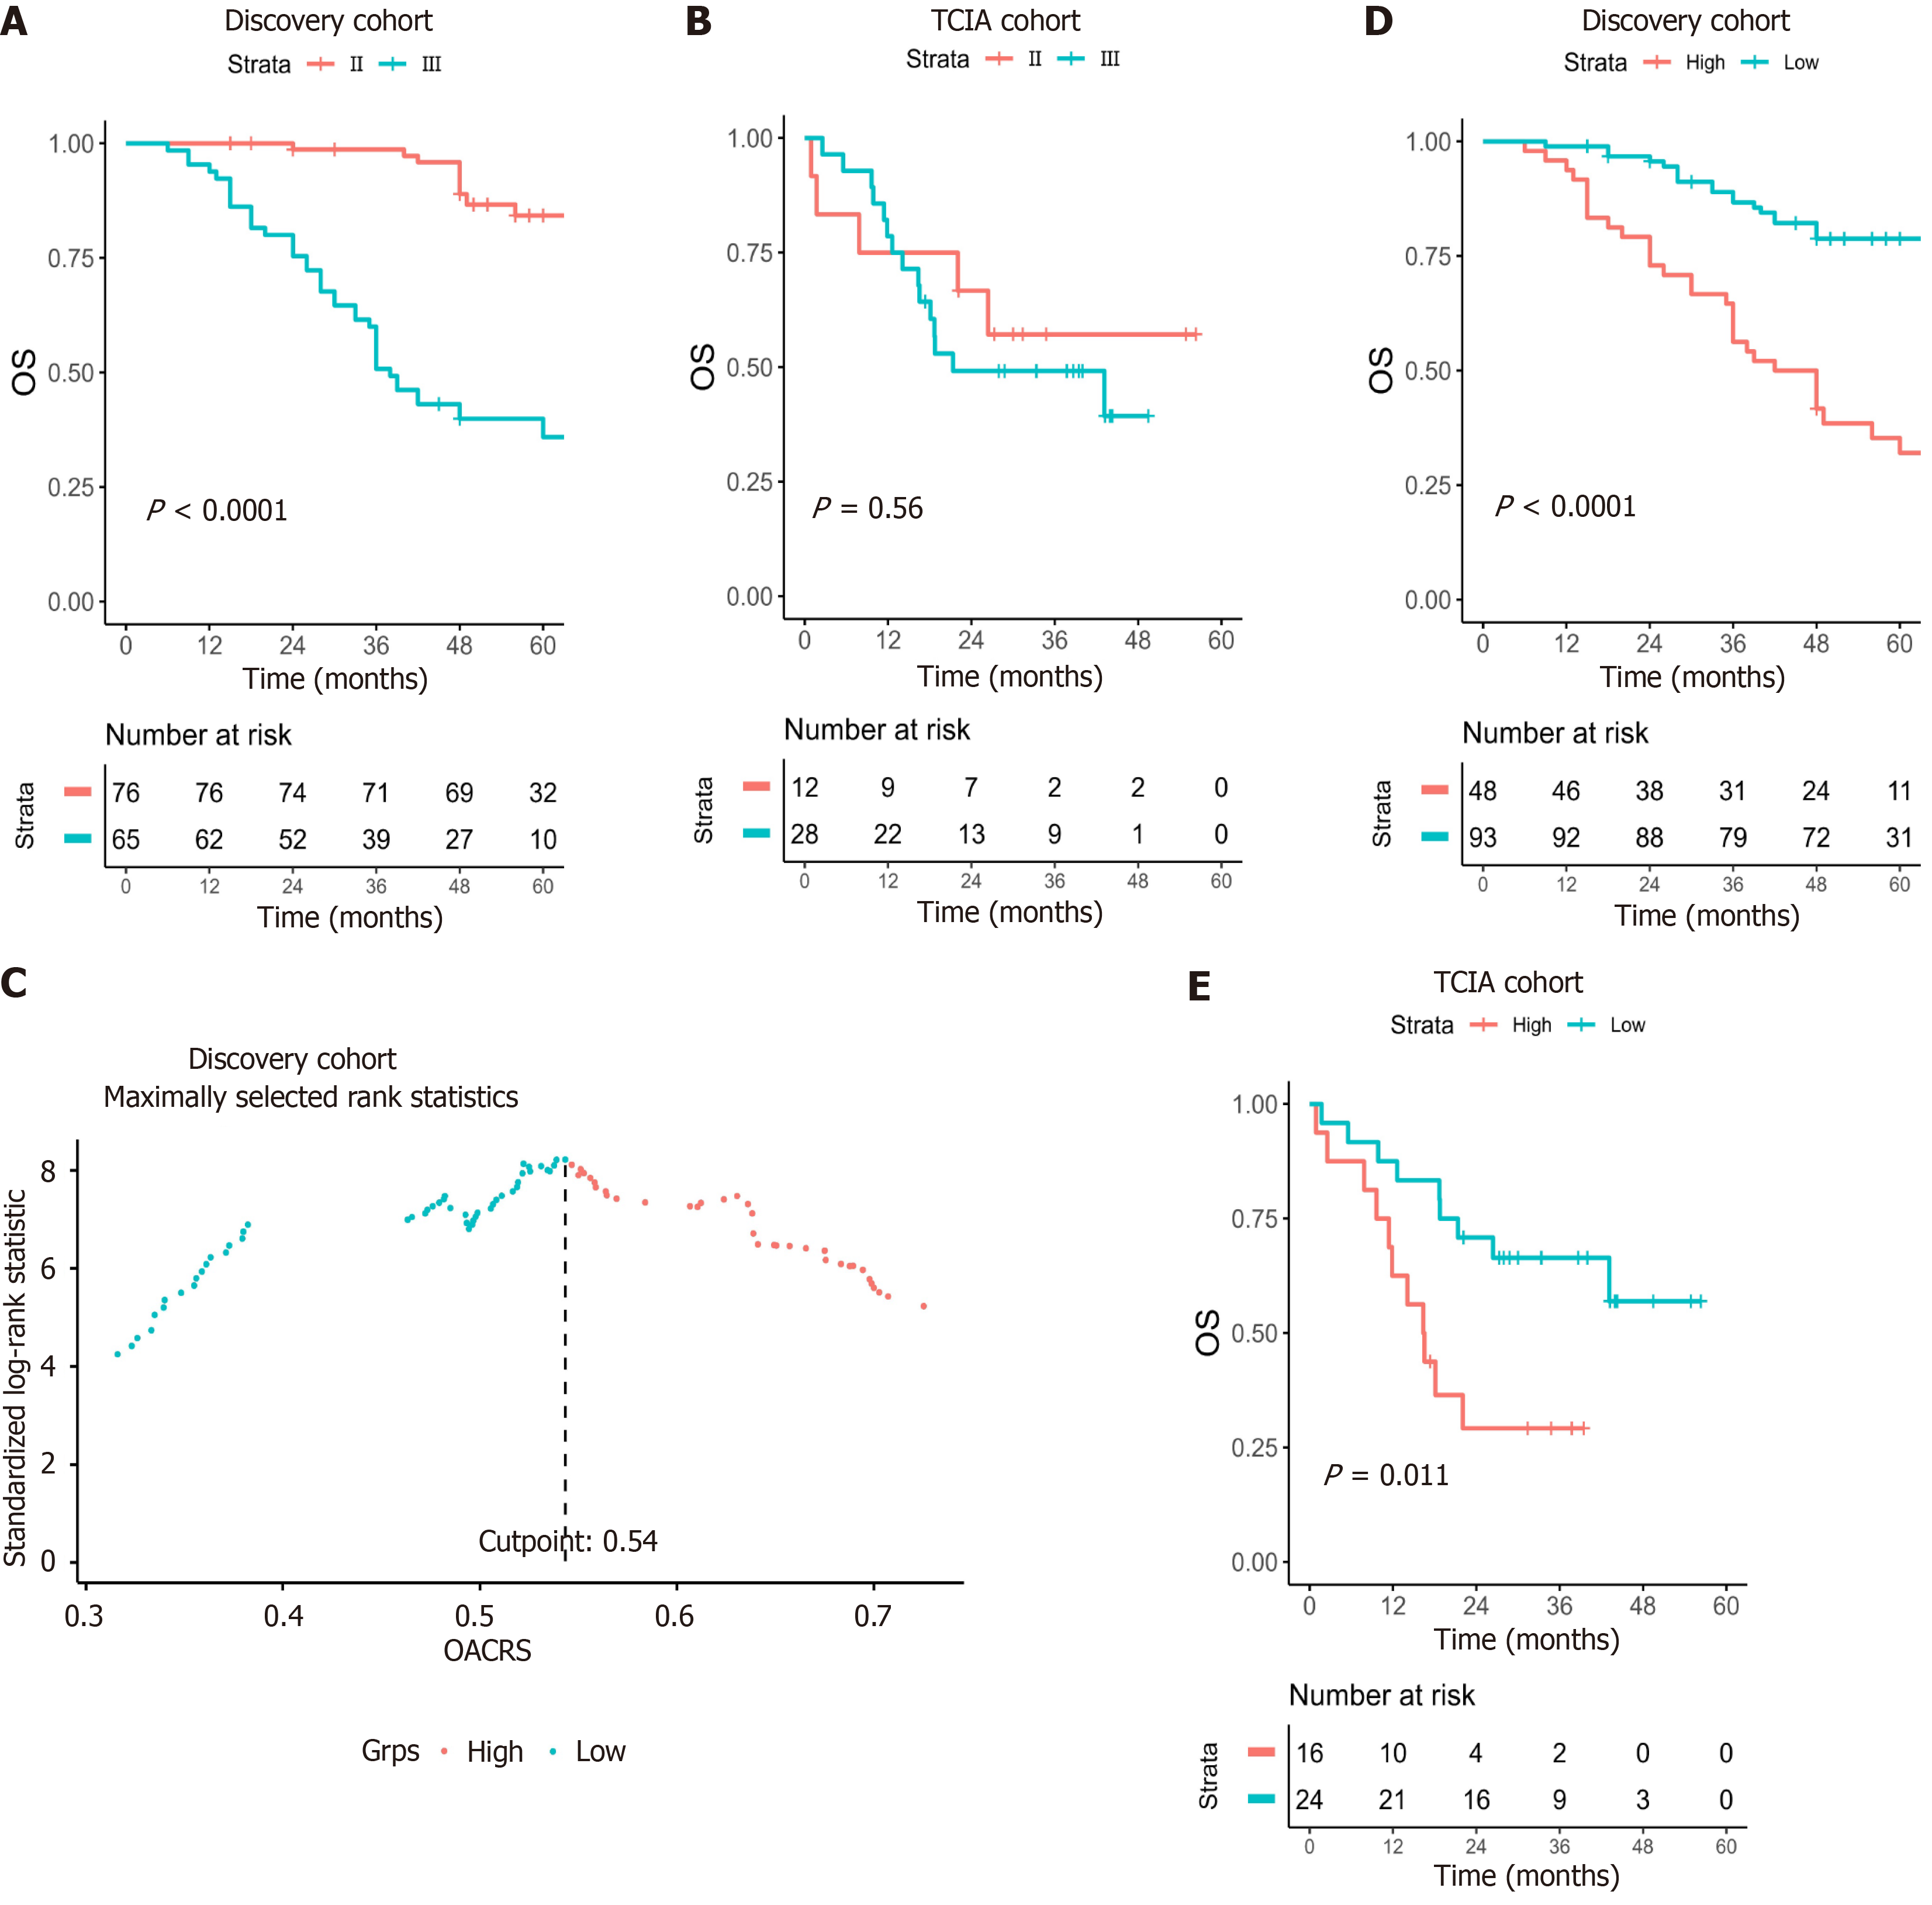
Figure 4 Overall survival-associated computed tomography image radiomics score as a biomarker for overall survival.
A and B: Survival curves of stage II/III patients in the discovery and the Cancer Imaging Archive (TCIA) cohorts; C: Calculating the optimal cut-off value of the overall survival-associated computed tomography image radiomics score (OACRS); D and E: Survival curves of patients with low and high OACRS in the discovery and TCIA cohorts. TCIA: The Cancer Imaging Archive; OS: Overall survival; OACRS: Overall survival-associated computed tomography image radiomics score.
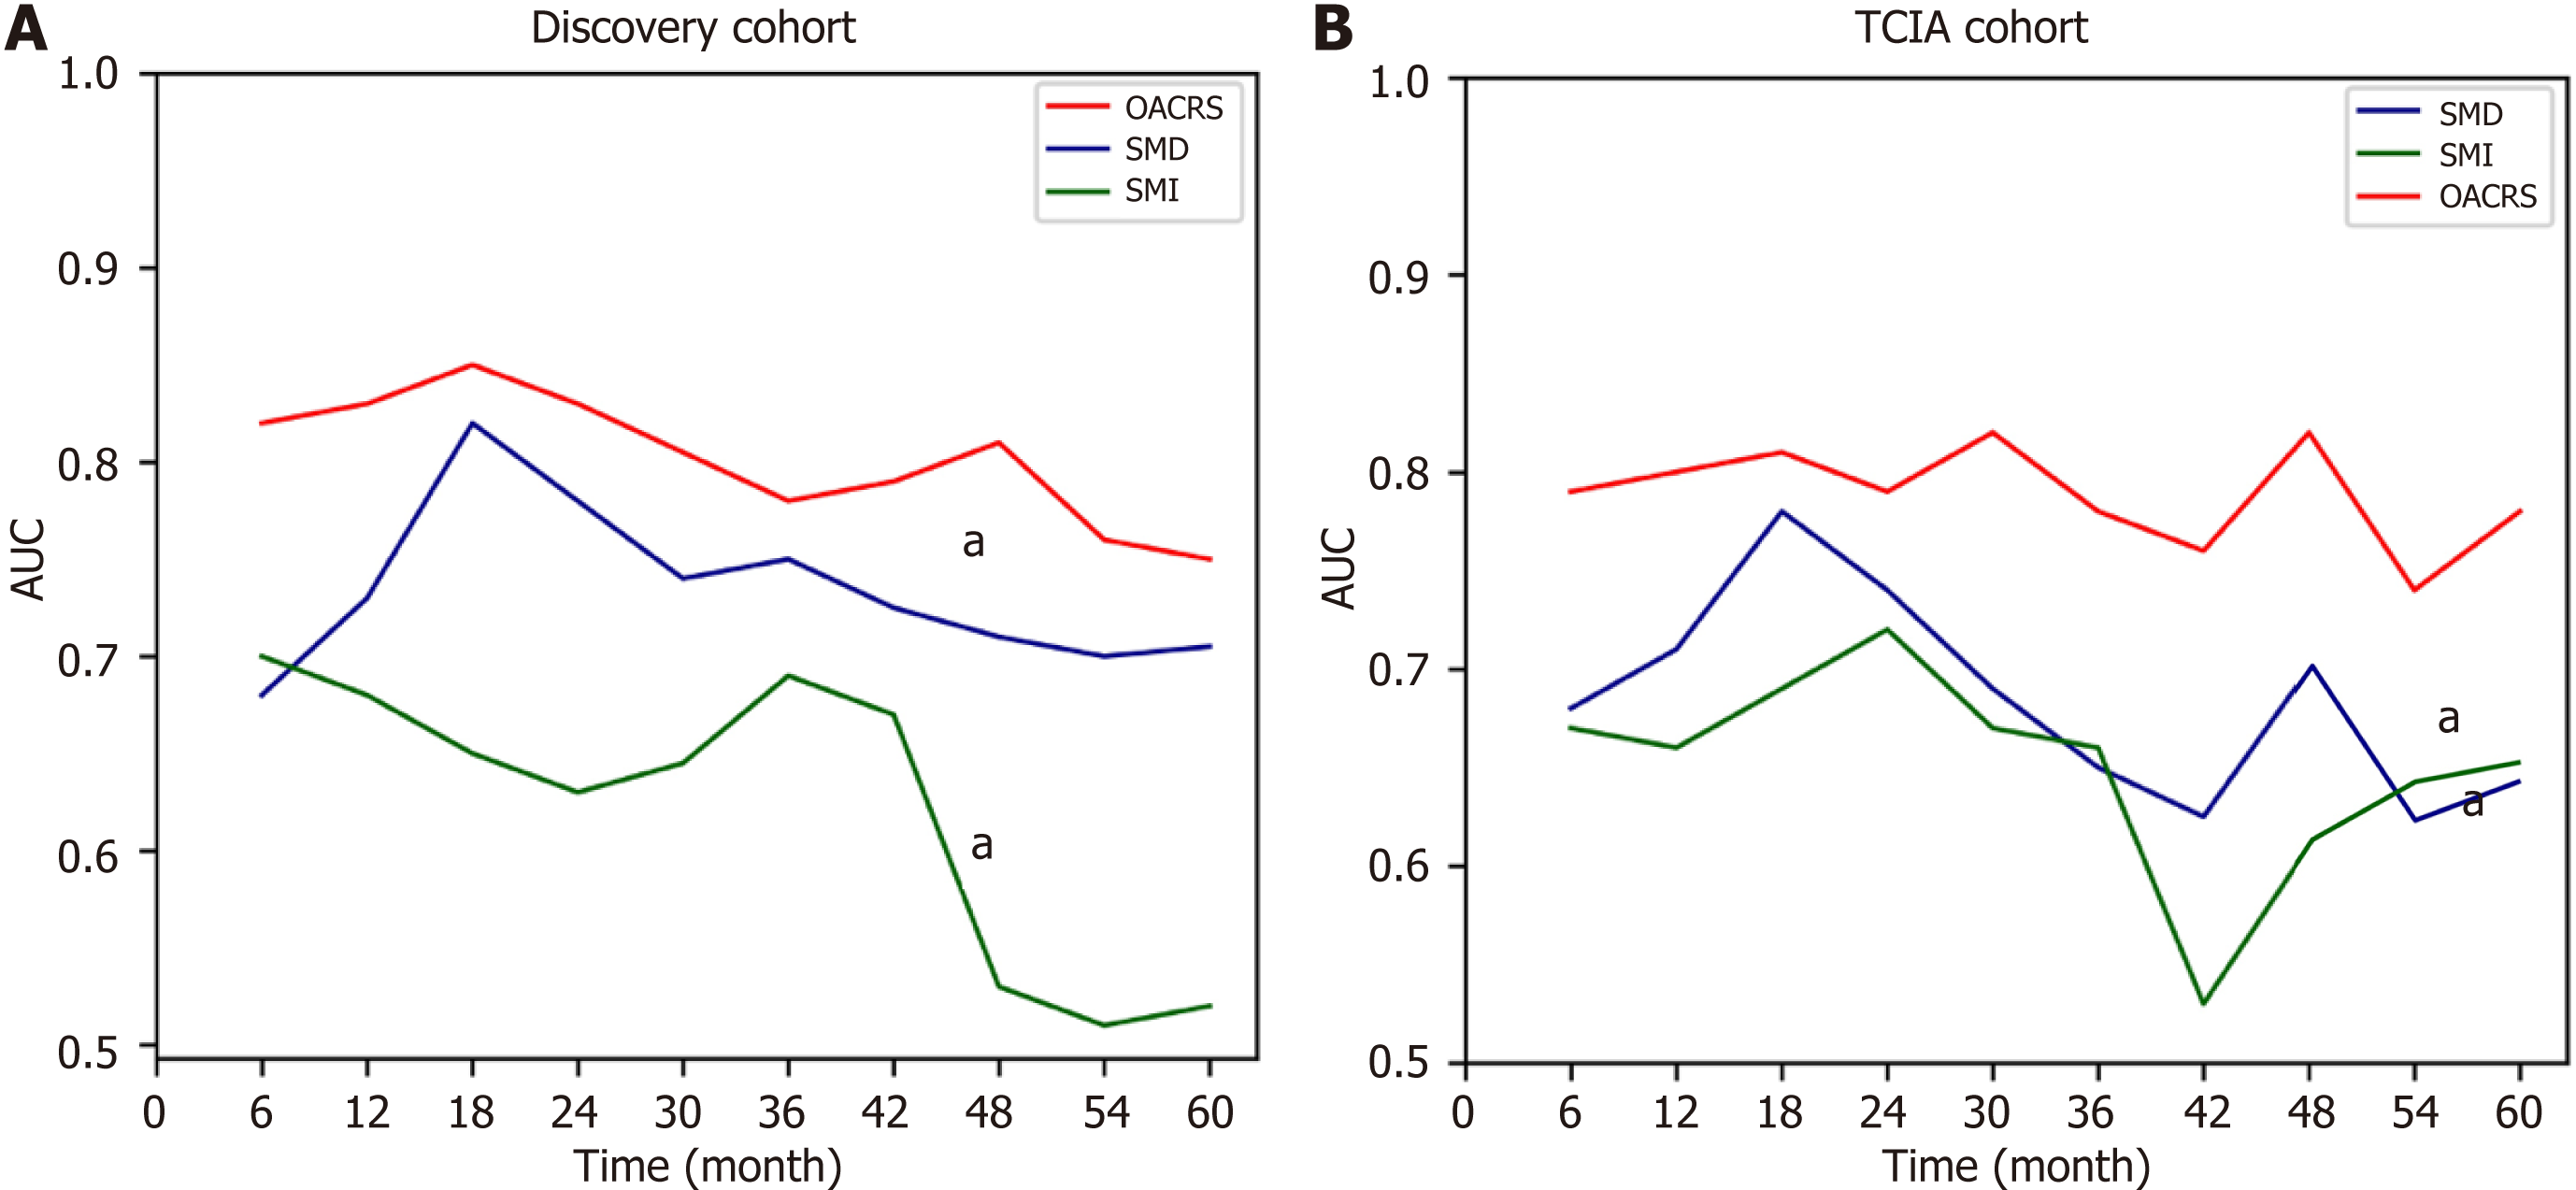
Figure 5 The area under the curve of skeletal muscle index, skeletal muscle density, and overall survival-associated computed tomography image radiomics score for overall survival prediction.
A: Discovery cohort; B: The Cancer Imaging Archive cohort. AUC: Area under the curve; TCIA: The Cancer Imaging Archive; OACRS: Overall survival-associated computed tomography image radiomics score; SMI: Skeletal muscle index; SMD: Skeletal muscle density.
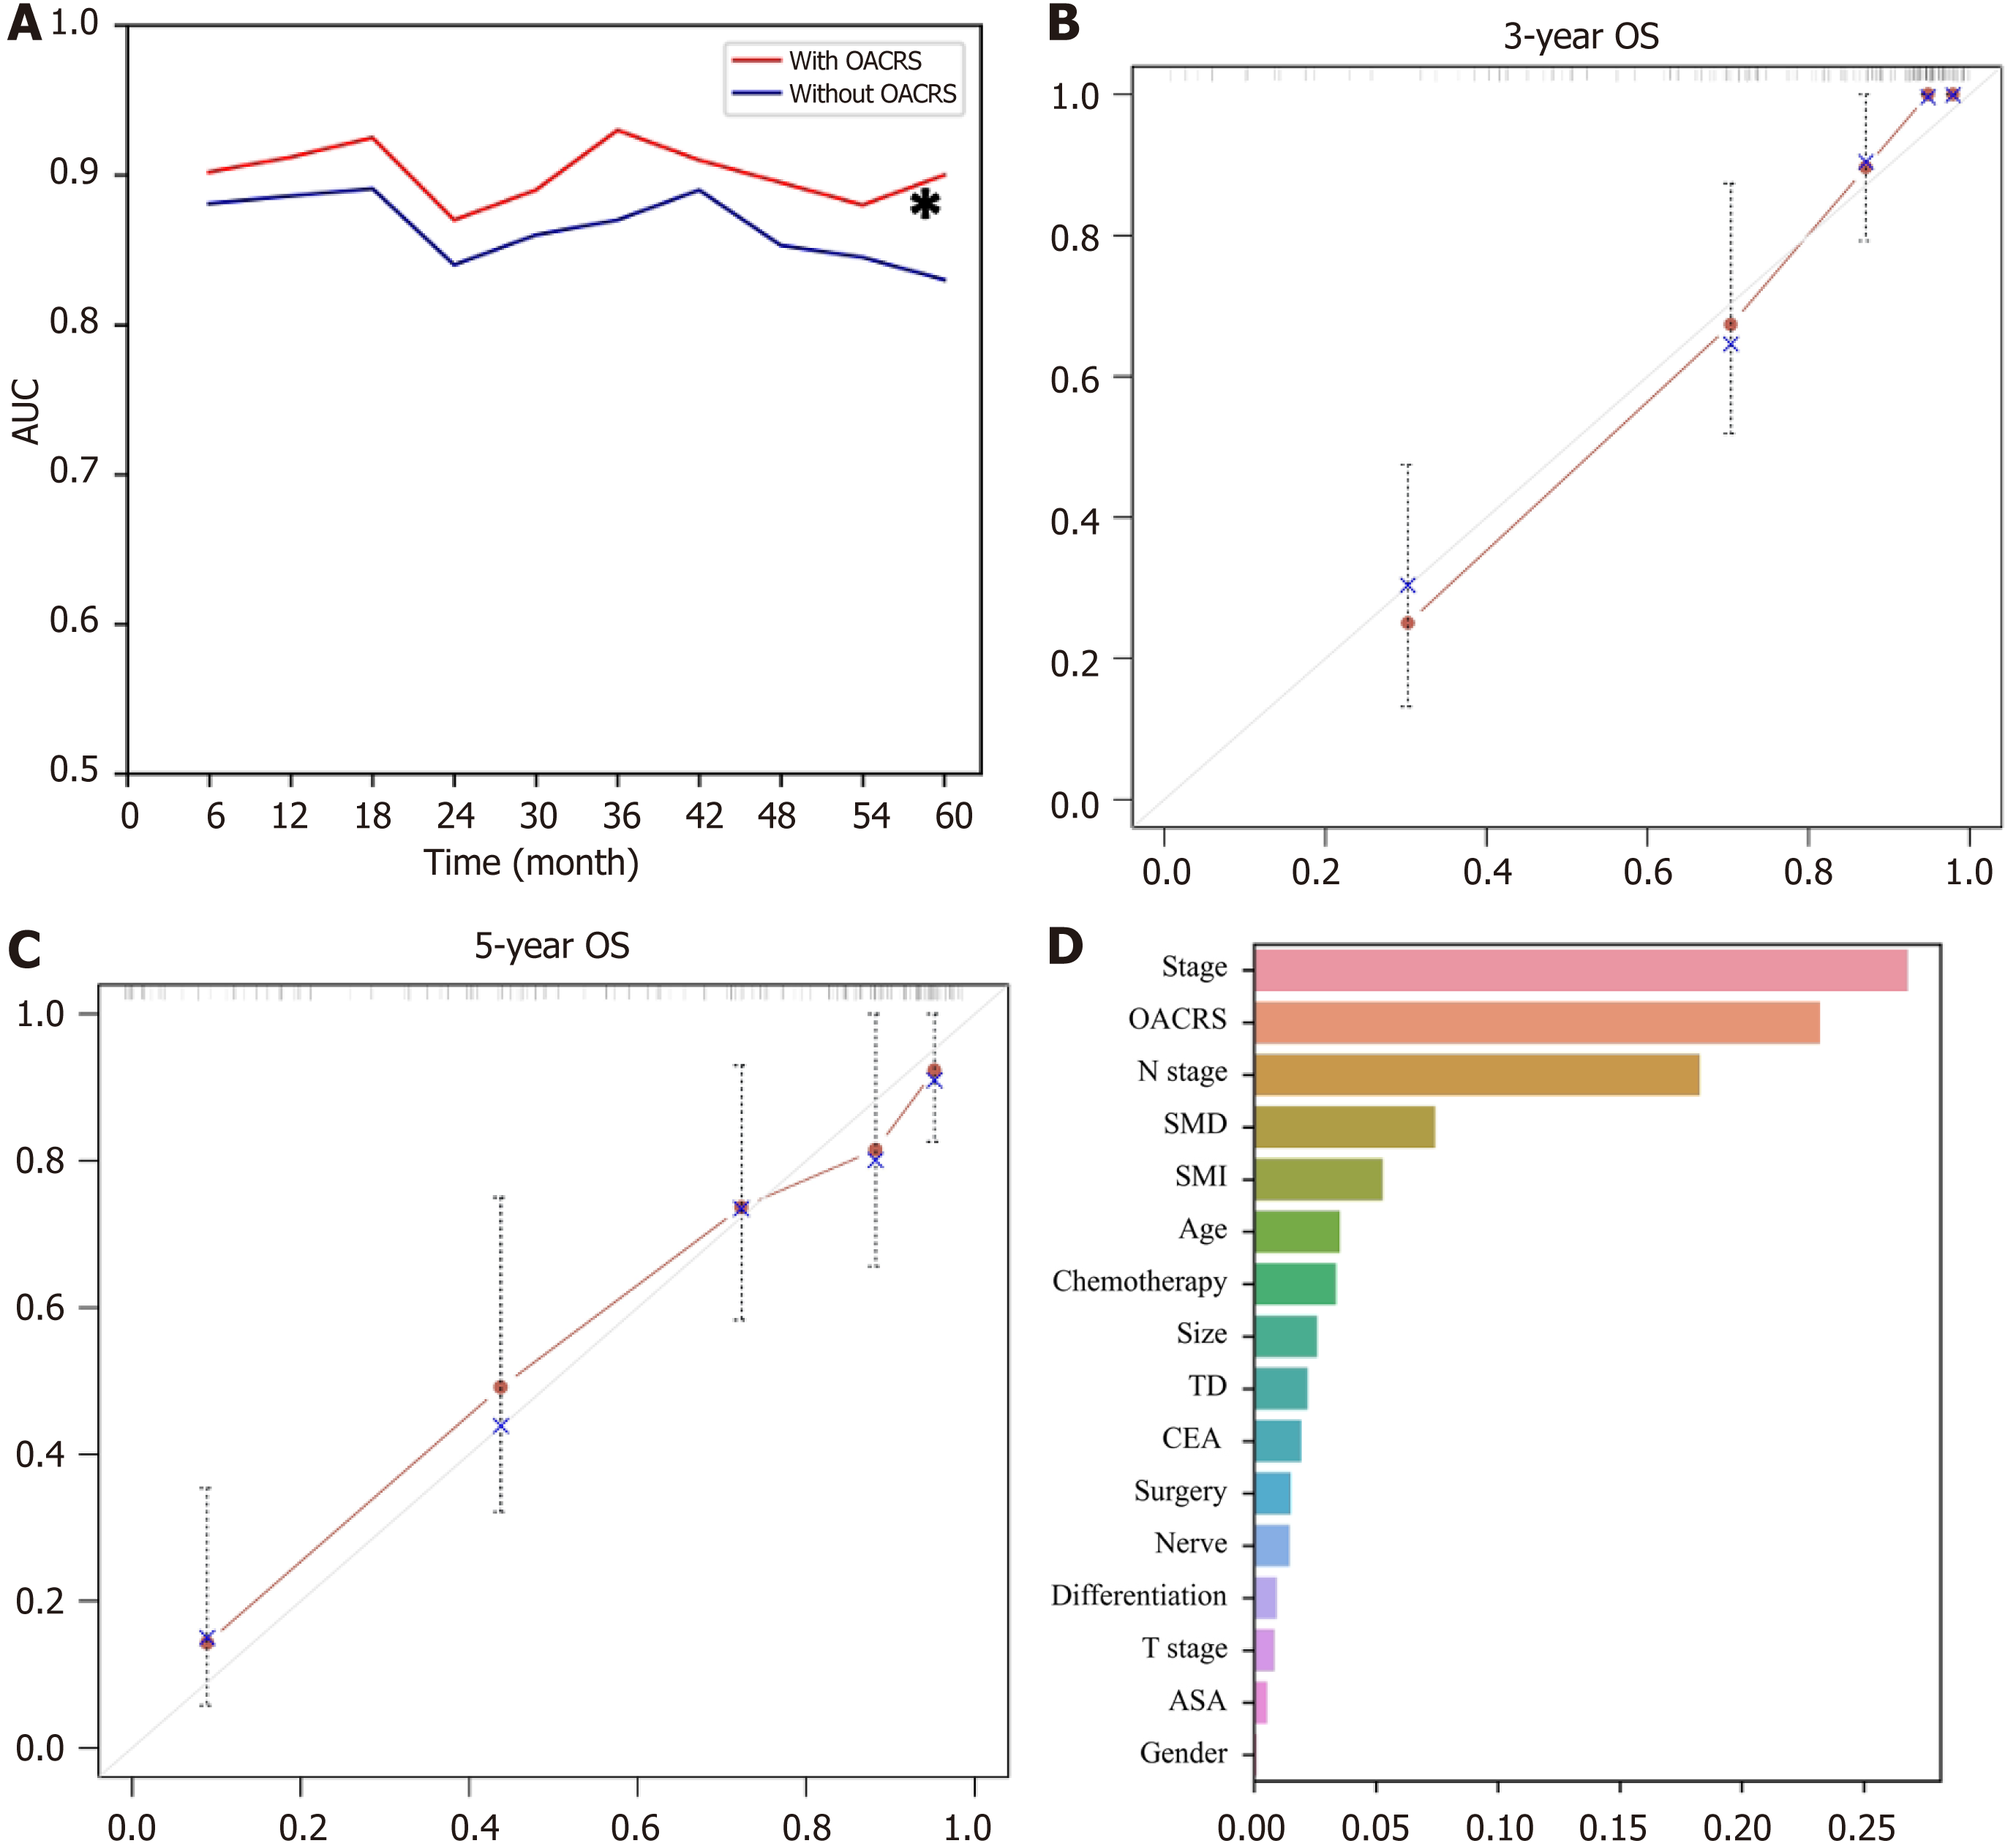
Figure 6 Performance of the random survival forest model.
A: The area under the curve of random survival forest model with and without the overall survival-associated computed tomography image radiomics score; B: Calibration curve of random survival forest model for 3-year overall survival prediction; C: Calibration curve for 5-year overall survival; D: Feature importance analysis of all the variables included in the random survival forest model. OACRS: Overall survival-associated computed tomography image radiomics score; SMI: Skeletal muscle index; SMD: Skeletal muscle density; TD: Tumor deposition; ASA: American Association of Anesthesiologists score; CEA: Carcinoembryonic antigen; OS: Overall survival; AUC: Area under the curve.
- Citation: Xiang YH, Mou H, Qu B, Sun HR. Machine learning-based radiomics score improves prognostic prediction accuracy of stage II/III gastric cancer: A multi-cohort study. World J Gastrointest Surg 2024; 16(2): 345-356
- URL: https://www.wjgnet.com/1948-9366/full/v16/i2/345.htm
- DOI: https://dx.doi.org/10.4240/wjgs.v16.i2.345


