Copyright
©The Author(s) 2024.
World J Gastrointest Surg. Feb 27, 2024; 16(2): 289-306
Published online Feb 27, 2024. doi: 10.4240/wjgs.v16.i2.289
Published online Feb 27, 2024. doi: 10.4240/wjgs.v16.i2.289
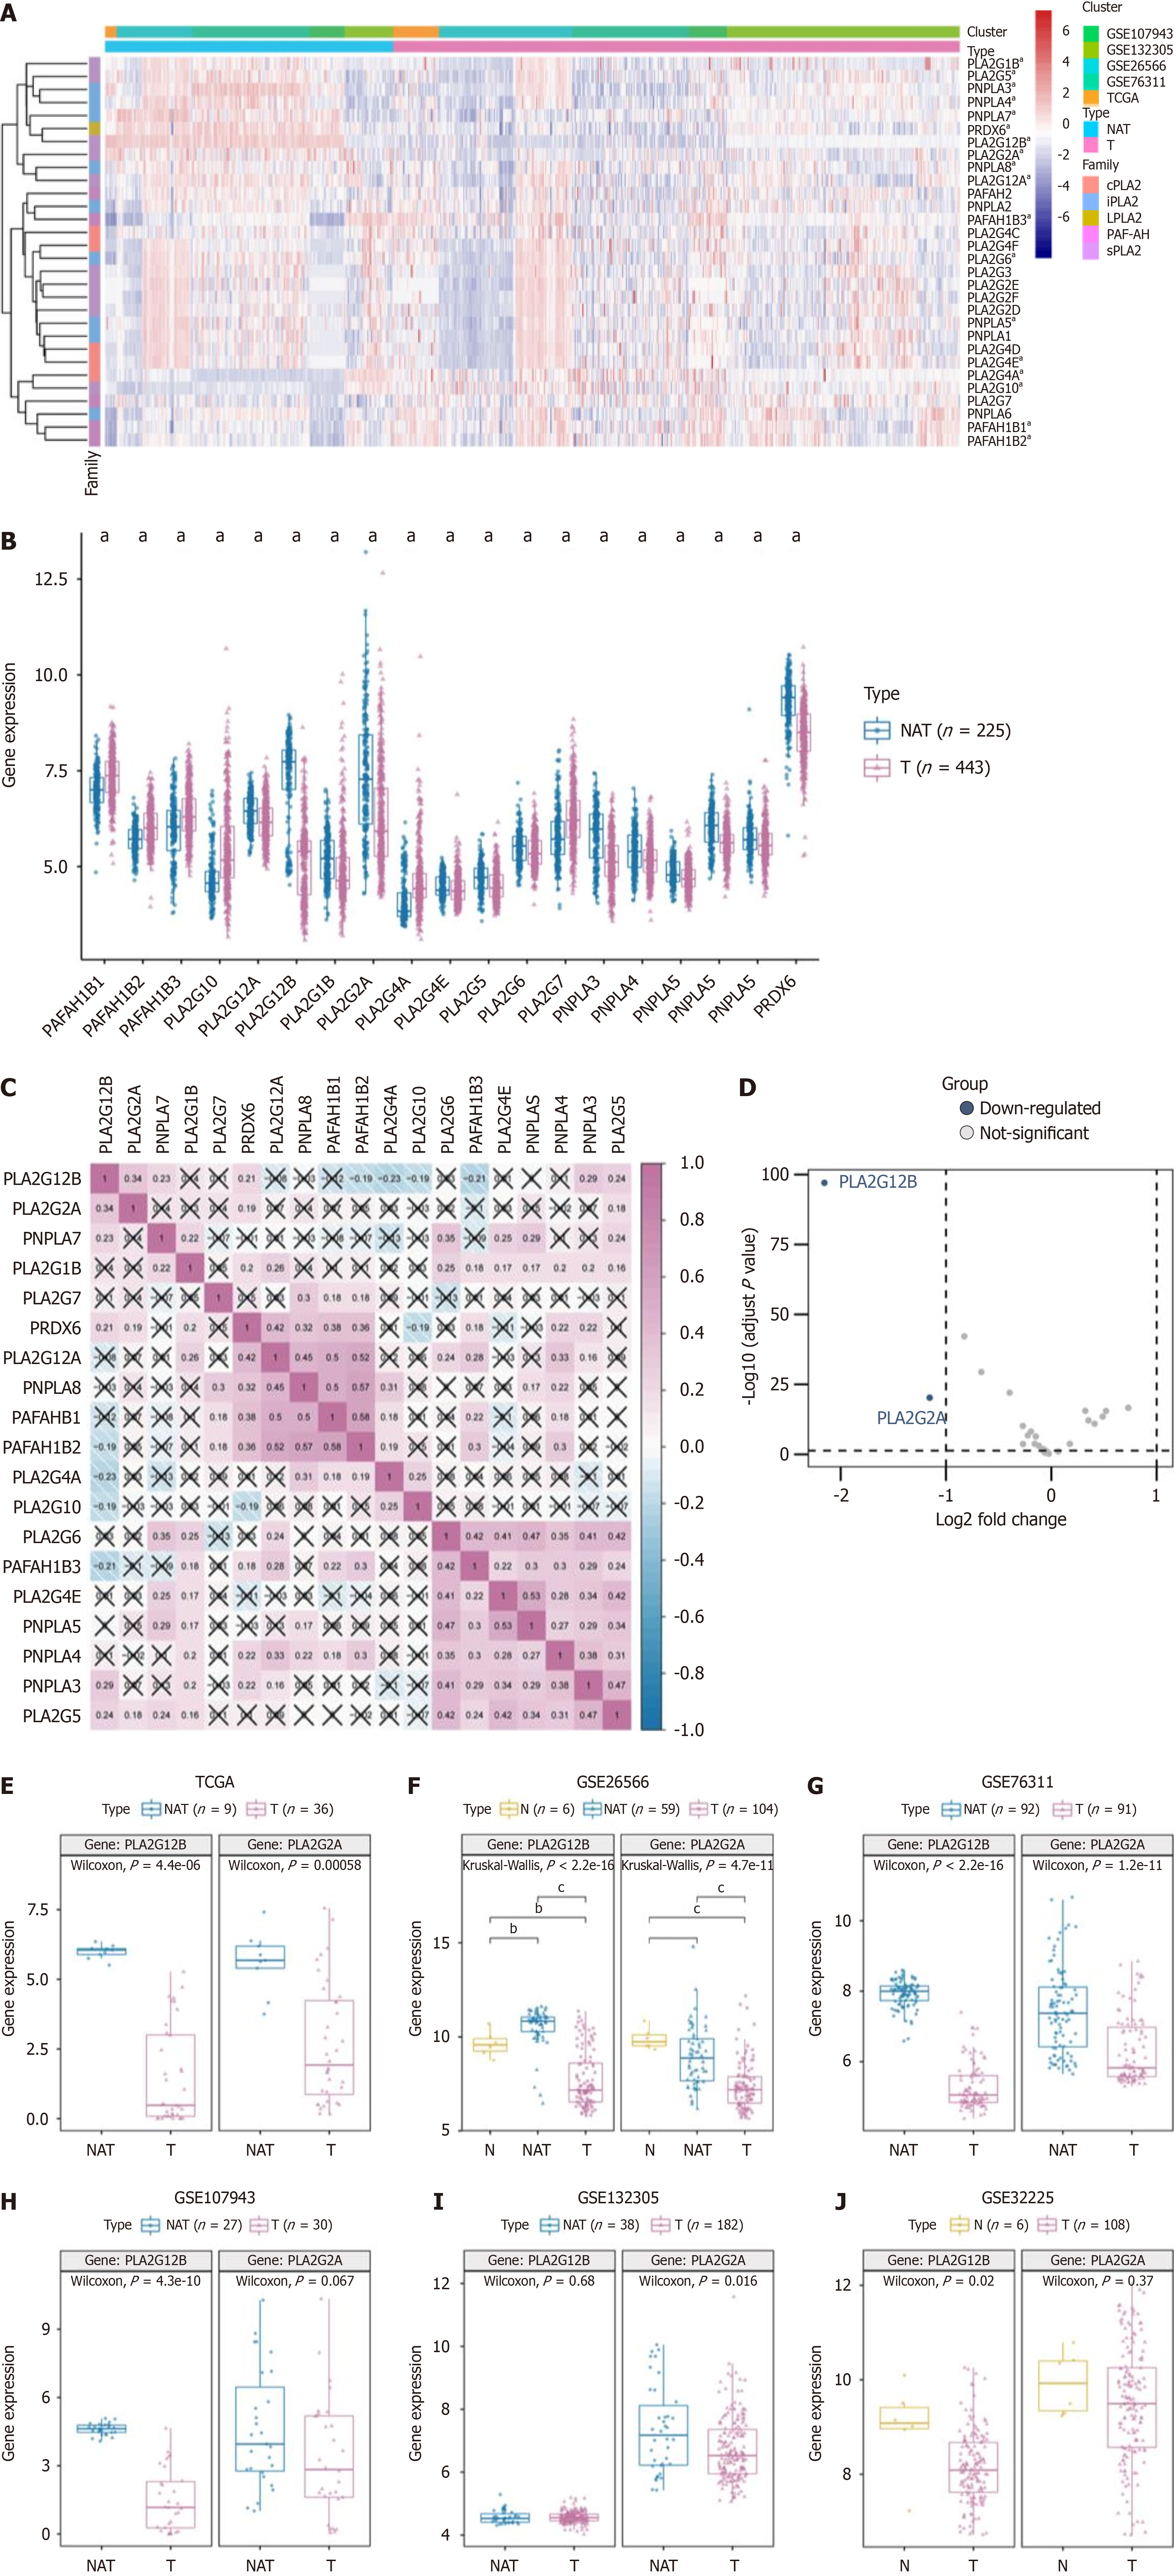
Figure 1 Analyzing phospholipase A2 gene family in cholangiocarcinoma: Expression patterns and correlations.
A: The enrichment levels of the 5 phospholipase A2 (PLA2) gene families include cytosolic PLA2, calcium-independent PLA2, lysosomal PLA2, platelet-activating factor acetylhydrolase, and secreted PLA2; B: The expression level of PLA2 gene family in cholangiocarcinoma (T) and normal tissues adjacent (NAT); C: Correlations between the expression of each PLA2 family member in cholangiocarcinoma; D: Differentially expressed genes between the PLA2 gene family in tumor and normal samples were shown in the volcano plot, with blue dots representing significantly down-regulated genes and red dots representing significantly up-regulated genes.; E-J: The expression levels of PLA2G2A and PLA2G12B in public databases (The Cancer Genome Atlas and the Gene Expression Omnibus) were found in the T and NAT groups. . aP < 0.05, bP < 0.01, cP < 0.001. NAT: Adjacent normal tissues
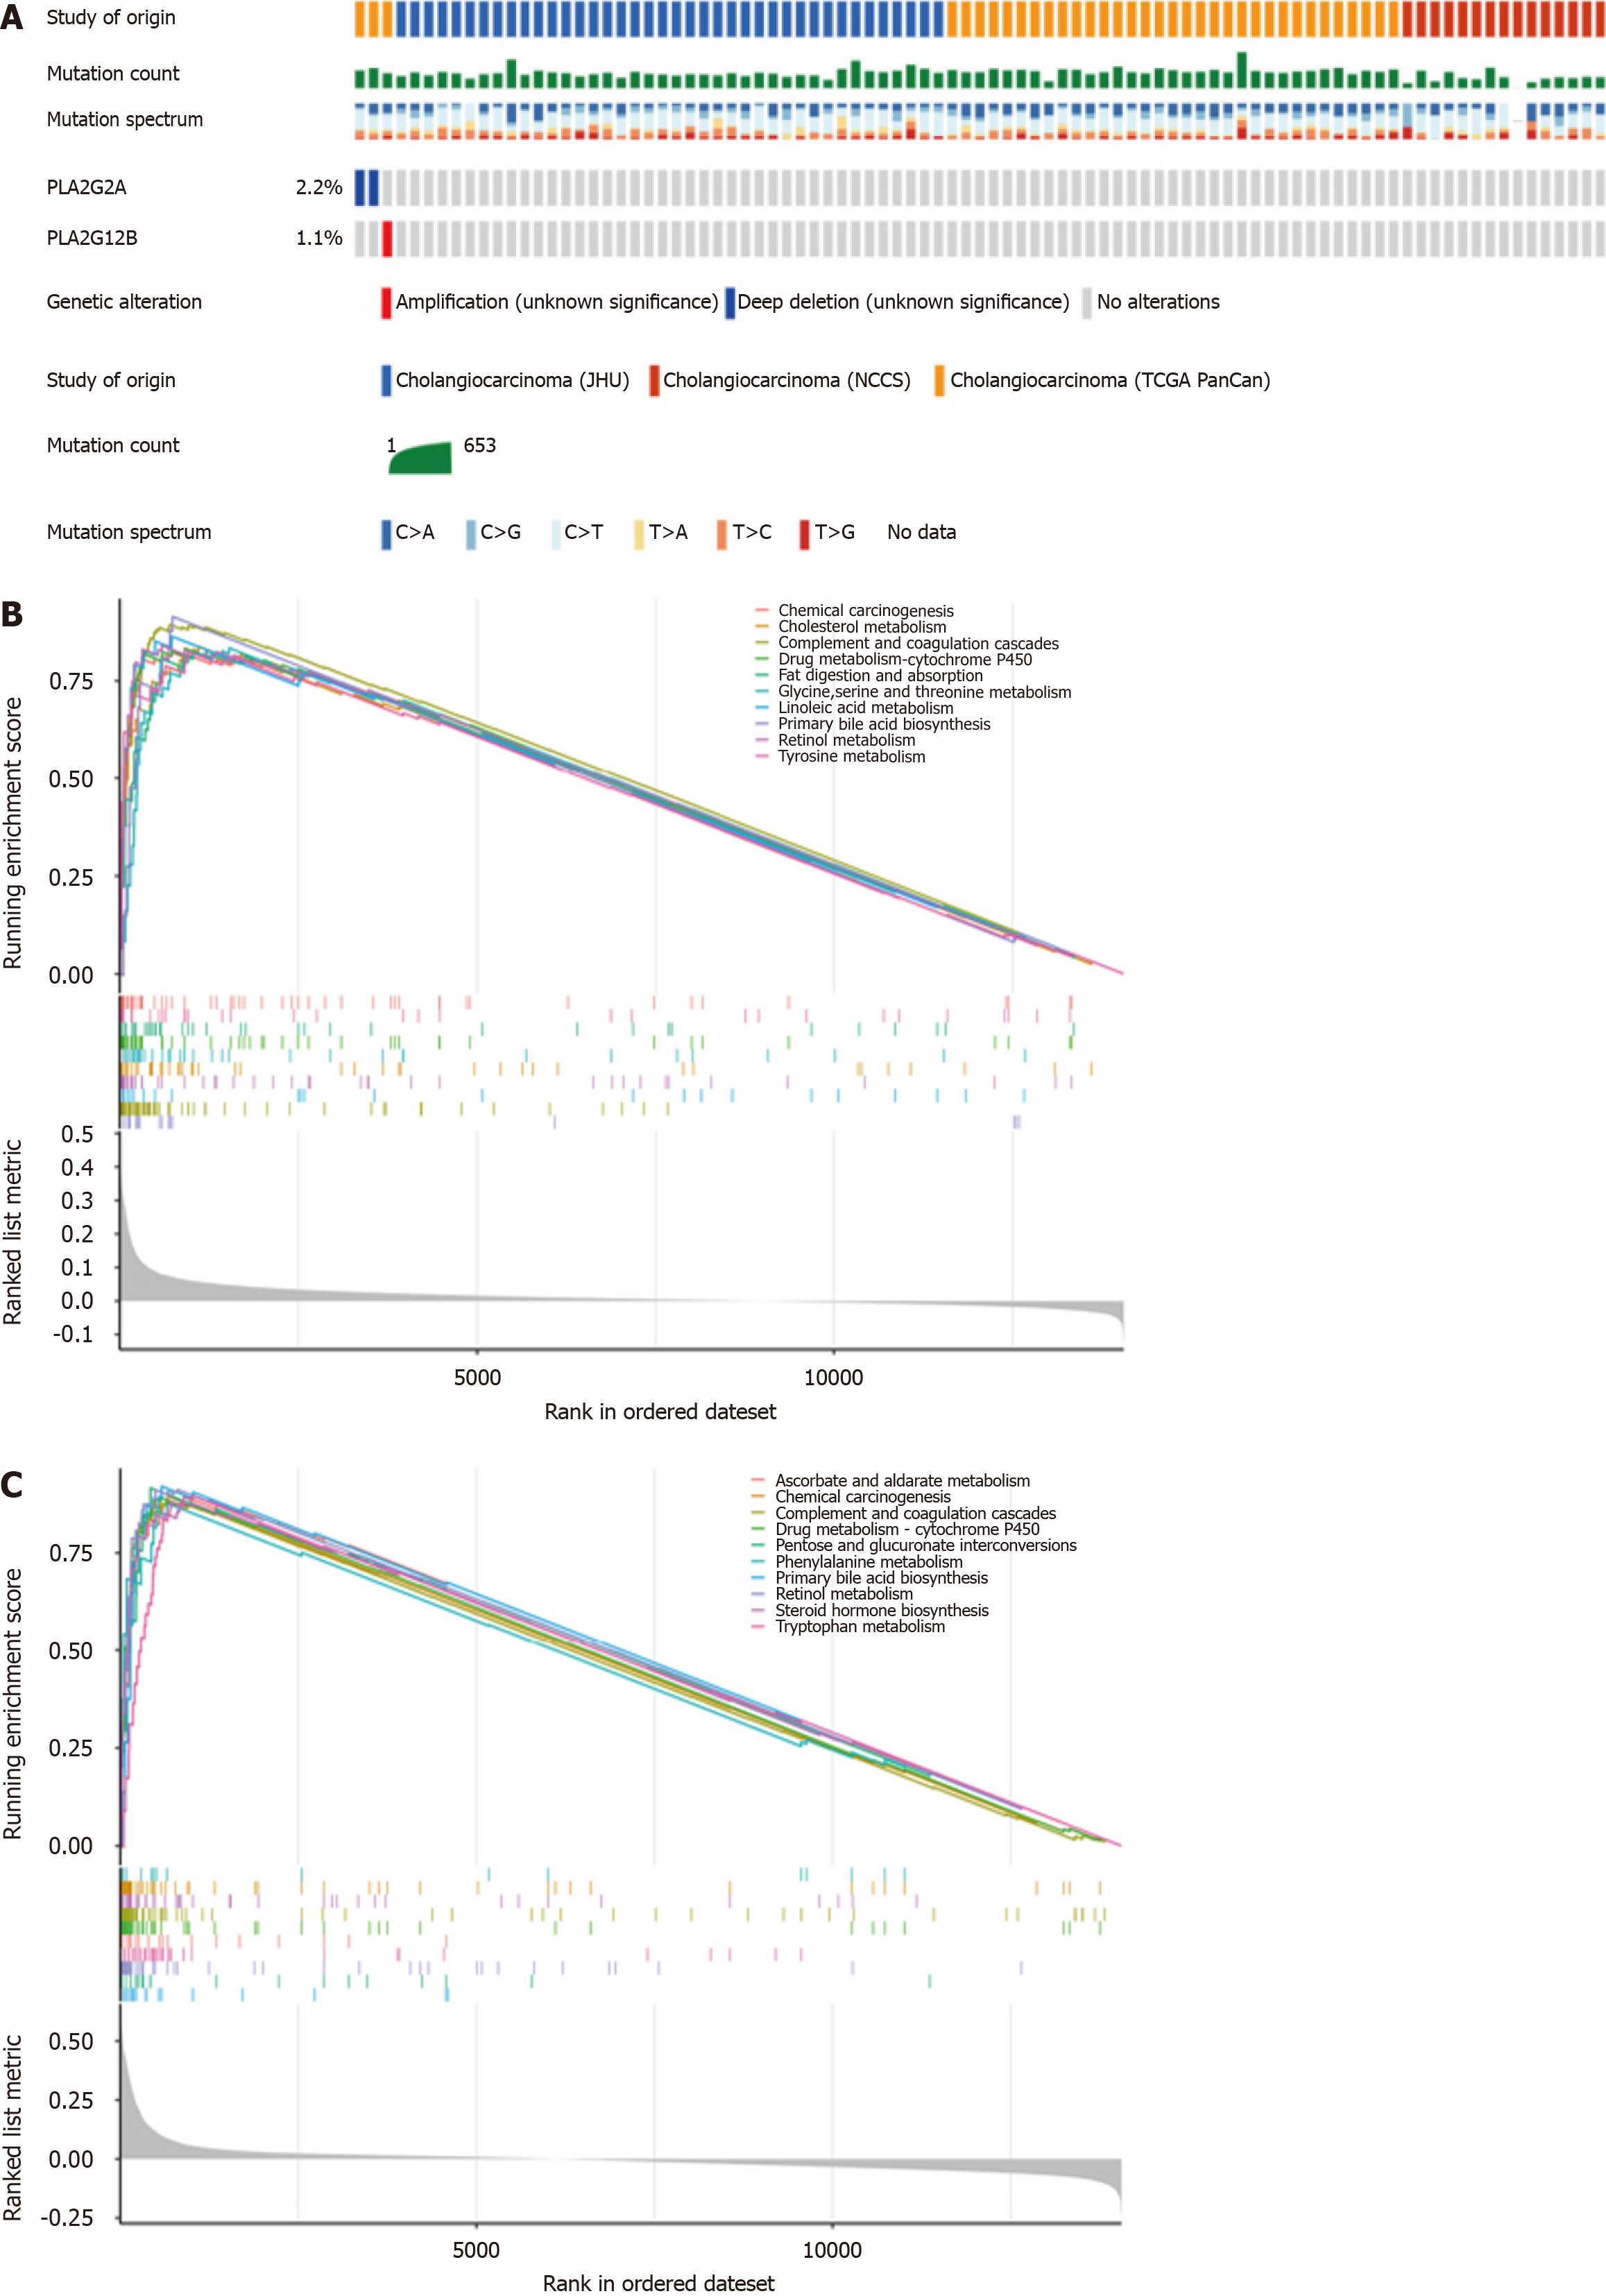
Figure 2 Expression and correlation of PLA2 gene families in cholangiocarcinoma and adjacent normal tissues.
A: Genetic alterations of PLA2G2A and PLA2G12B genes in patients from three datasets (each rectangle represents one patient; not all patients were shown (n = 91). Gray represents no mutation, and different colors represent different mutation types; B: Gene Set Enrichment Analysis (GSEA) analyses displayed key pathways associated with PLA2G2A expression; C: GSEA analyses displayed key pathways associated with PLA2G12B expression.
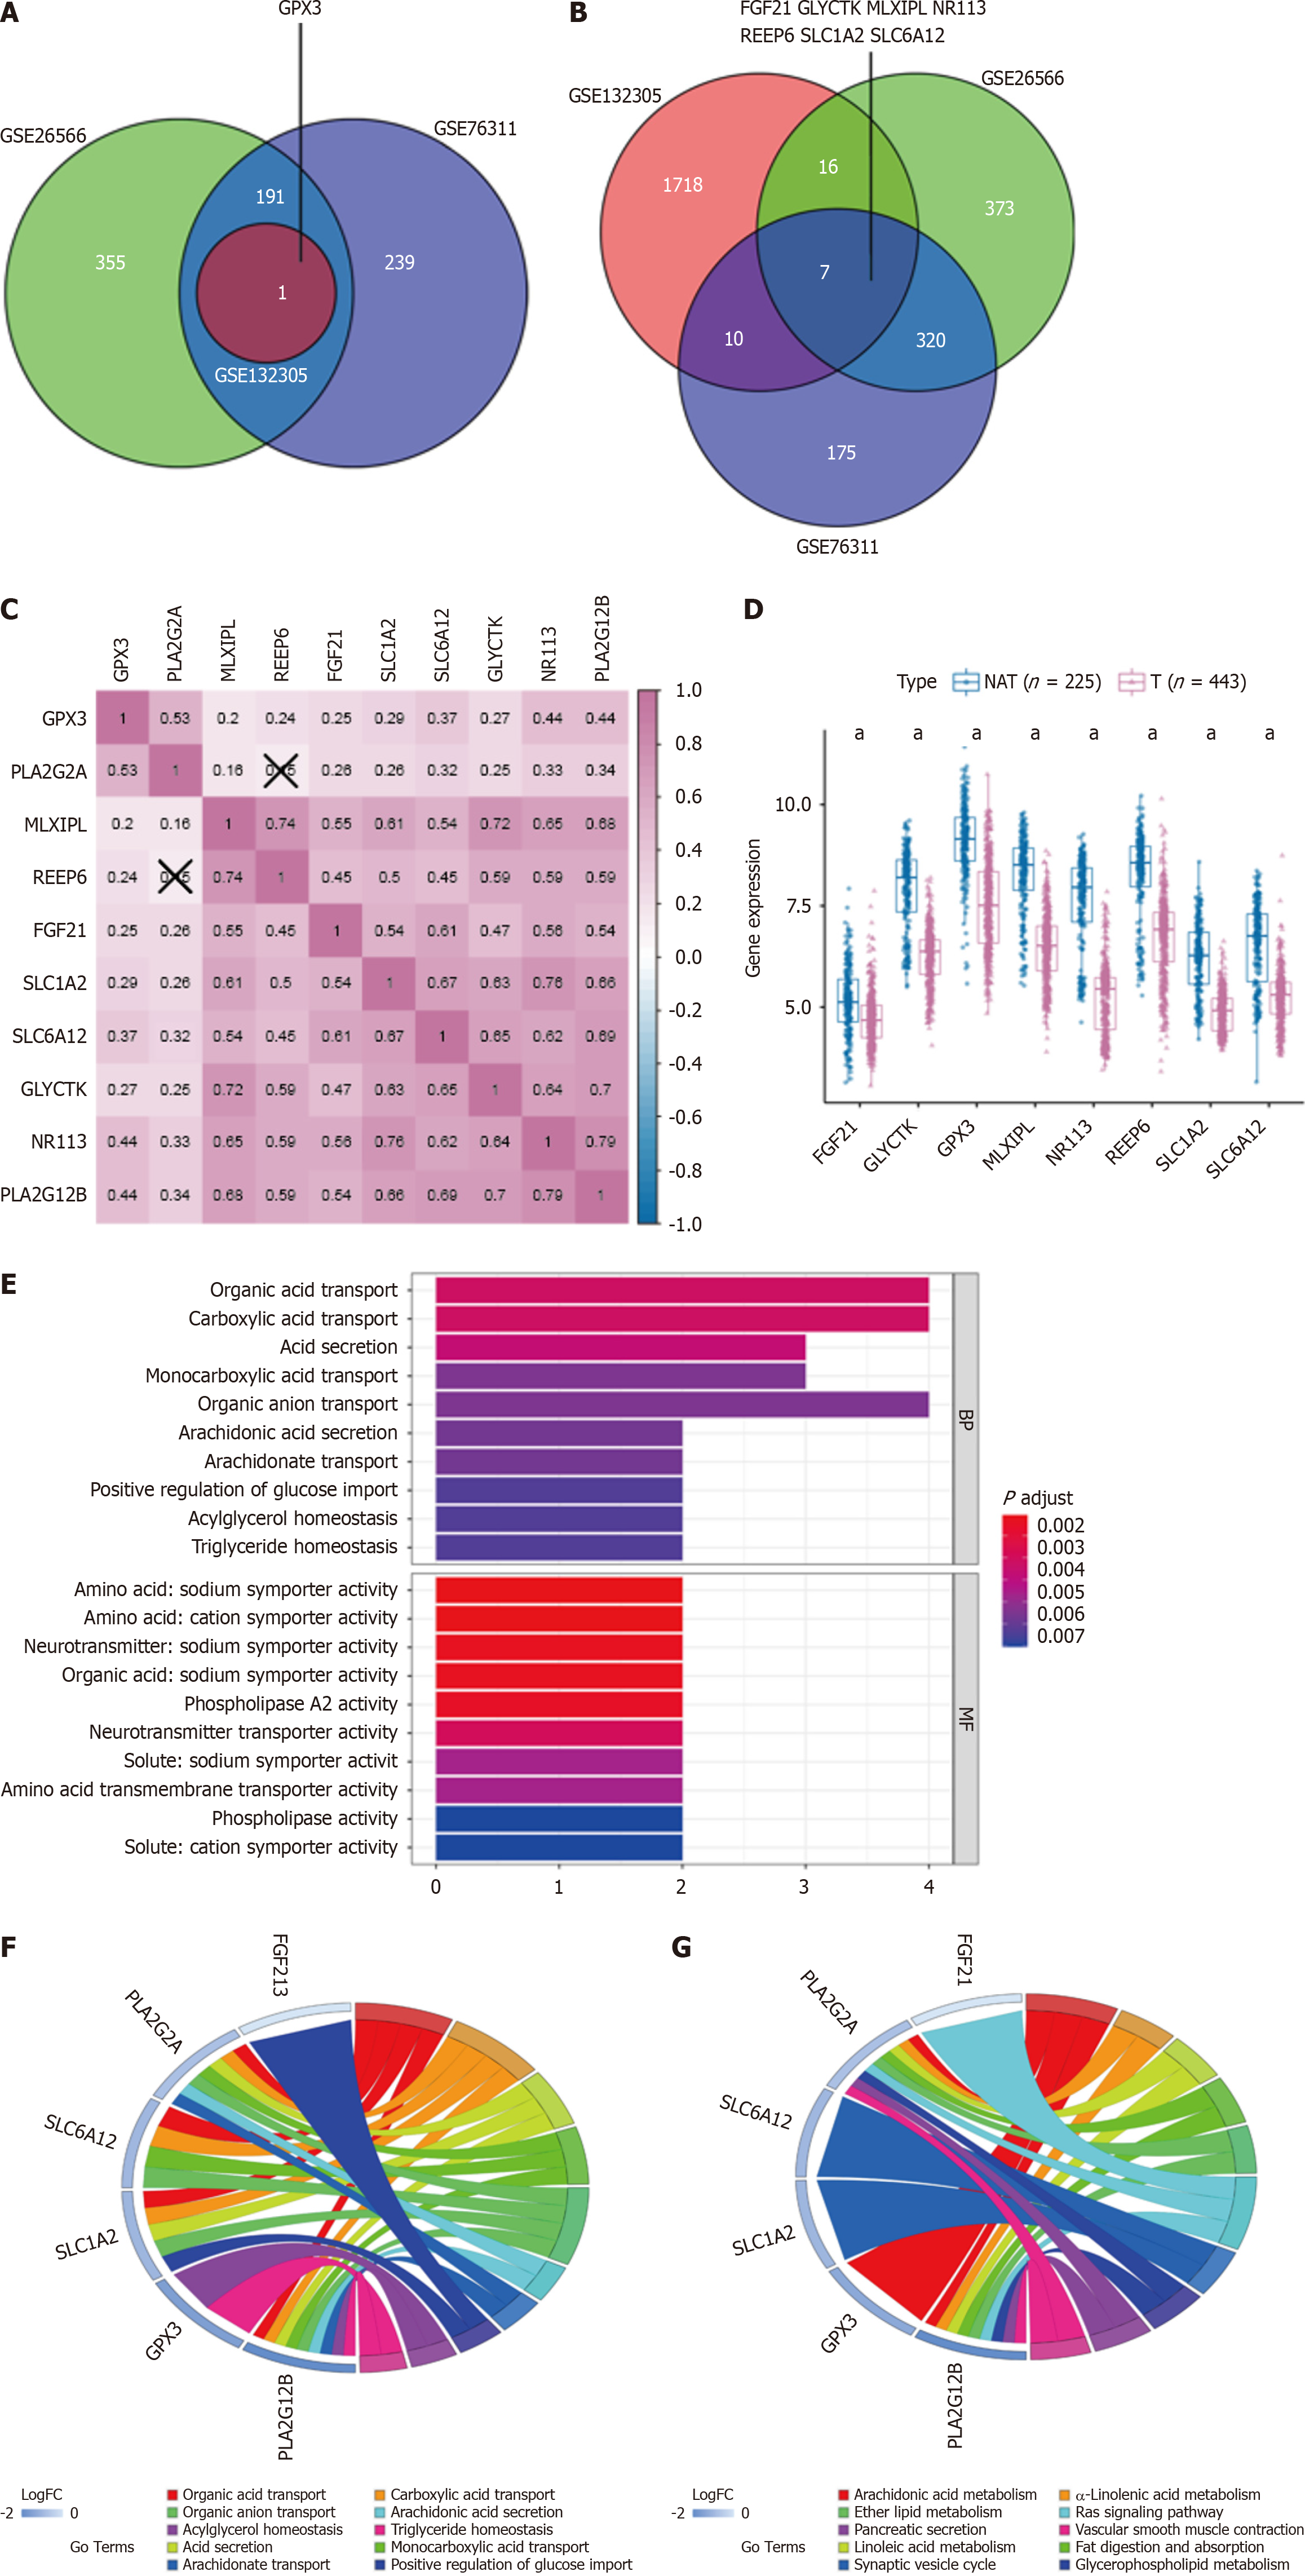
Figure 3 Hub genes linked to PLA2G2A and PLA2G12B in cholangiocarcinoma: expression, correlations, and pathway analysis.
A and B: Venn diagram showing the relevant hub genes associated with PLA2G2A, PLA2G12B expression, and differentially expressed in cholangiocarcinoma; C: Correlations between the expression of each relevant hub gene; D: The expression level of the relevant hub genes in cholangiocarcinoma (T) and normal tissues adjacent; E: Pathway enrichment and Genes Ontology (GO) function analysis of down-regulated genes correlated with biological BP and MF; F: Chord plot displaying the top 10 significant GO terms and their genes; G: Chord plot displaying the top 10 significant Kyoto Encyclopedia of Genes and Genomes terms and their genes. aP < 0.05. NAT: Adjacent normal tissues.
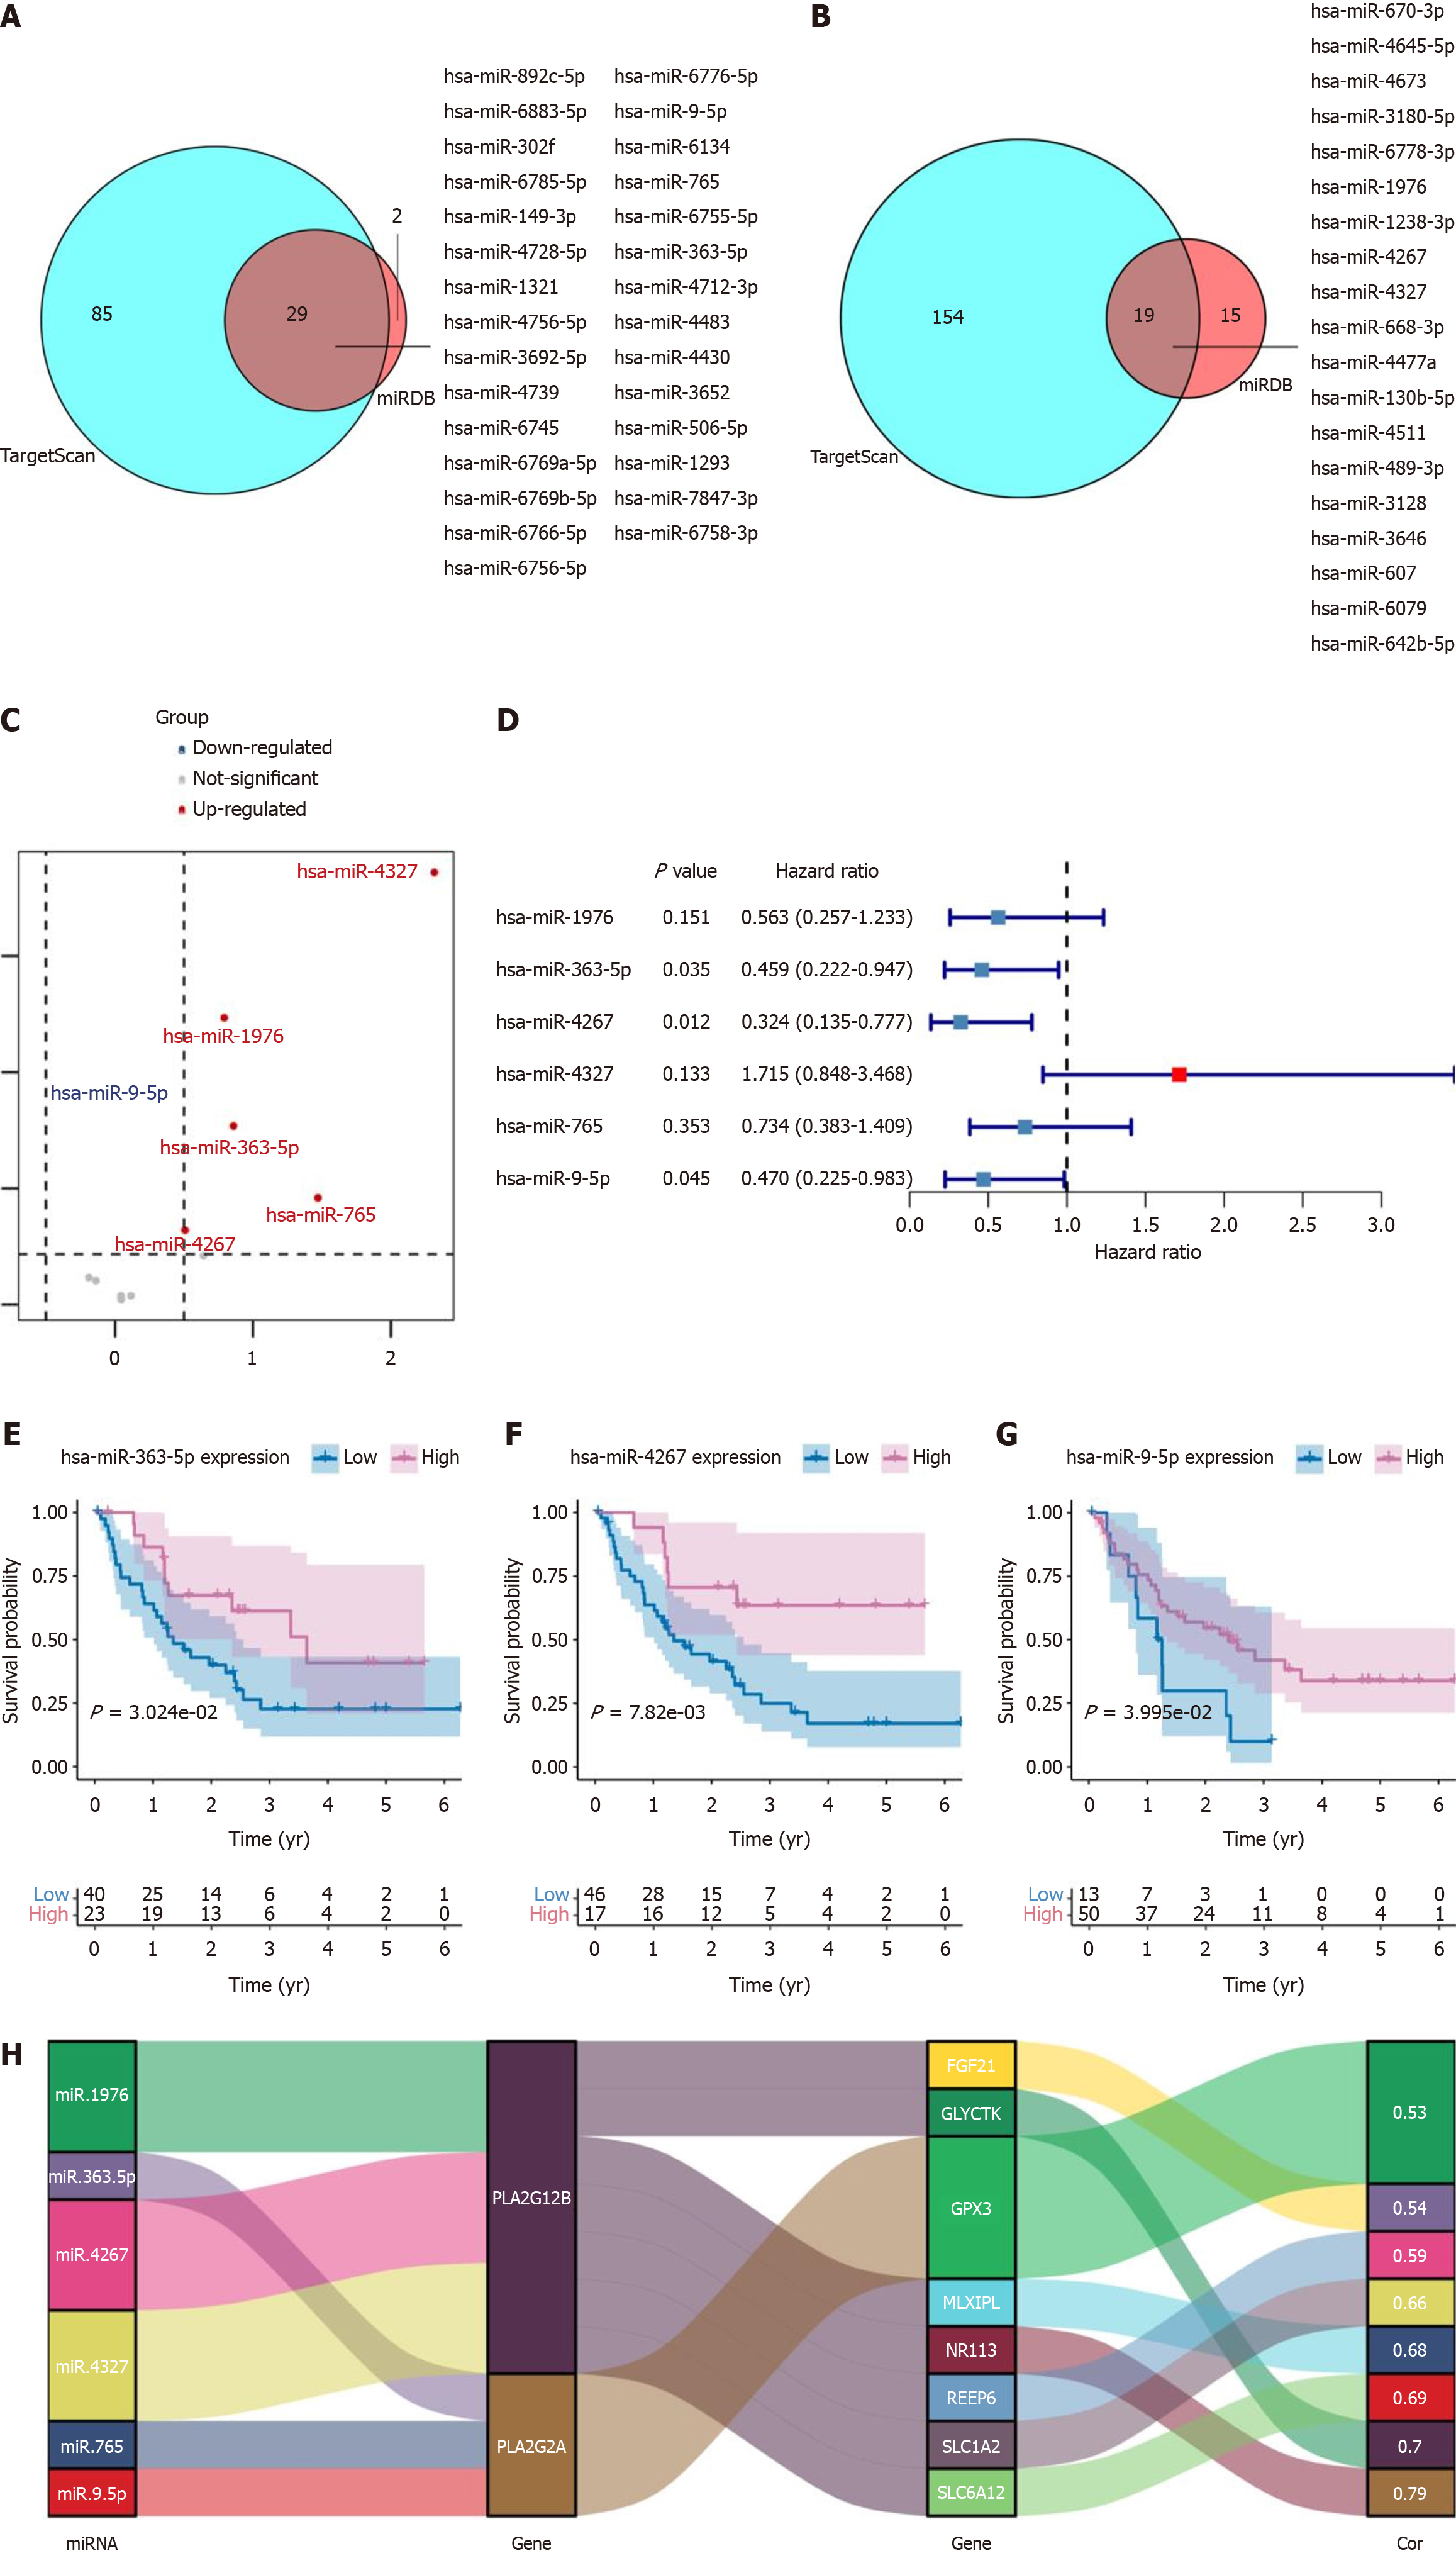
Figure 4 Analysis of microRNA targets in tumor vs normal samples and their prognostic significance in cancer.
A: Using TargetScan and miRDB databases, 29 intersecting microRNA (miRNA) targets for the PLA2G2A gene; B: Using TargetScan and miRDB databases, 19 intersecting miRNA targets for the PLA2G12B gene; C: Differentially expressed genes between miRNA targets in tumor and normal samples were shown in the volcano plot; D: Forest plot of the univariate Cox regression analysis in co-intersection miRNA targets; E-G: High expression of hsa-miR-363-5p, hsa-miR-4267, and hsa-miR-9-5p genes was associated with a worse prognosis; H: Sankey diagram visual analysis of miRNA targets, PLA2G2A, PLA2G12B, and Hub gene network data.
Figure 5 Expression and diagnostic potential of PLA2G2A, PLA2G12B, and microRNAs in cholangiocarcinoma and related conditions.
A and B: Expression of PLA2G2A, PLA2G12B in serum and urine. Intrahepatic cholangiocarcinoma (ICC), primary sclerosing cholangitis (PSC), and non-tumor (N); C: The differentially expressed microRNAs (miRNAs) related to PLA2G2A and PLA2G12B in serum were screened; D: The gene expression levels of 6 different miRNA molecules in serum. ICC, cholelithiasis (Ch) and N; E: Receiver operating characteristic (ROC) curves of PLA2G2A and PLA2G12B in serum extracellular vesicles in cholangiocarcinoma (CCA) and N groups; F: ROC curves of PLA2G2A and PLA2G12B in serum extracellular vesicles in CCA and PSC groups; G: ROC curves of PLA2G2A and PLA2G12B in urine extracellular vesicles in CCA and N groups; H: ROC curves of miRNAs were expressed differently in the ICC group and N group; I: ROC curves of miRNAs expressed differently in the ICC group and Ch group. CCA: Cholangiocarcinoma; PSC: Primary sclerosing cholangitis; EVs: Extracellular vesicles; AUC: Area under the curve; ICC: Intrahepatic cholangiocarcinoma.
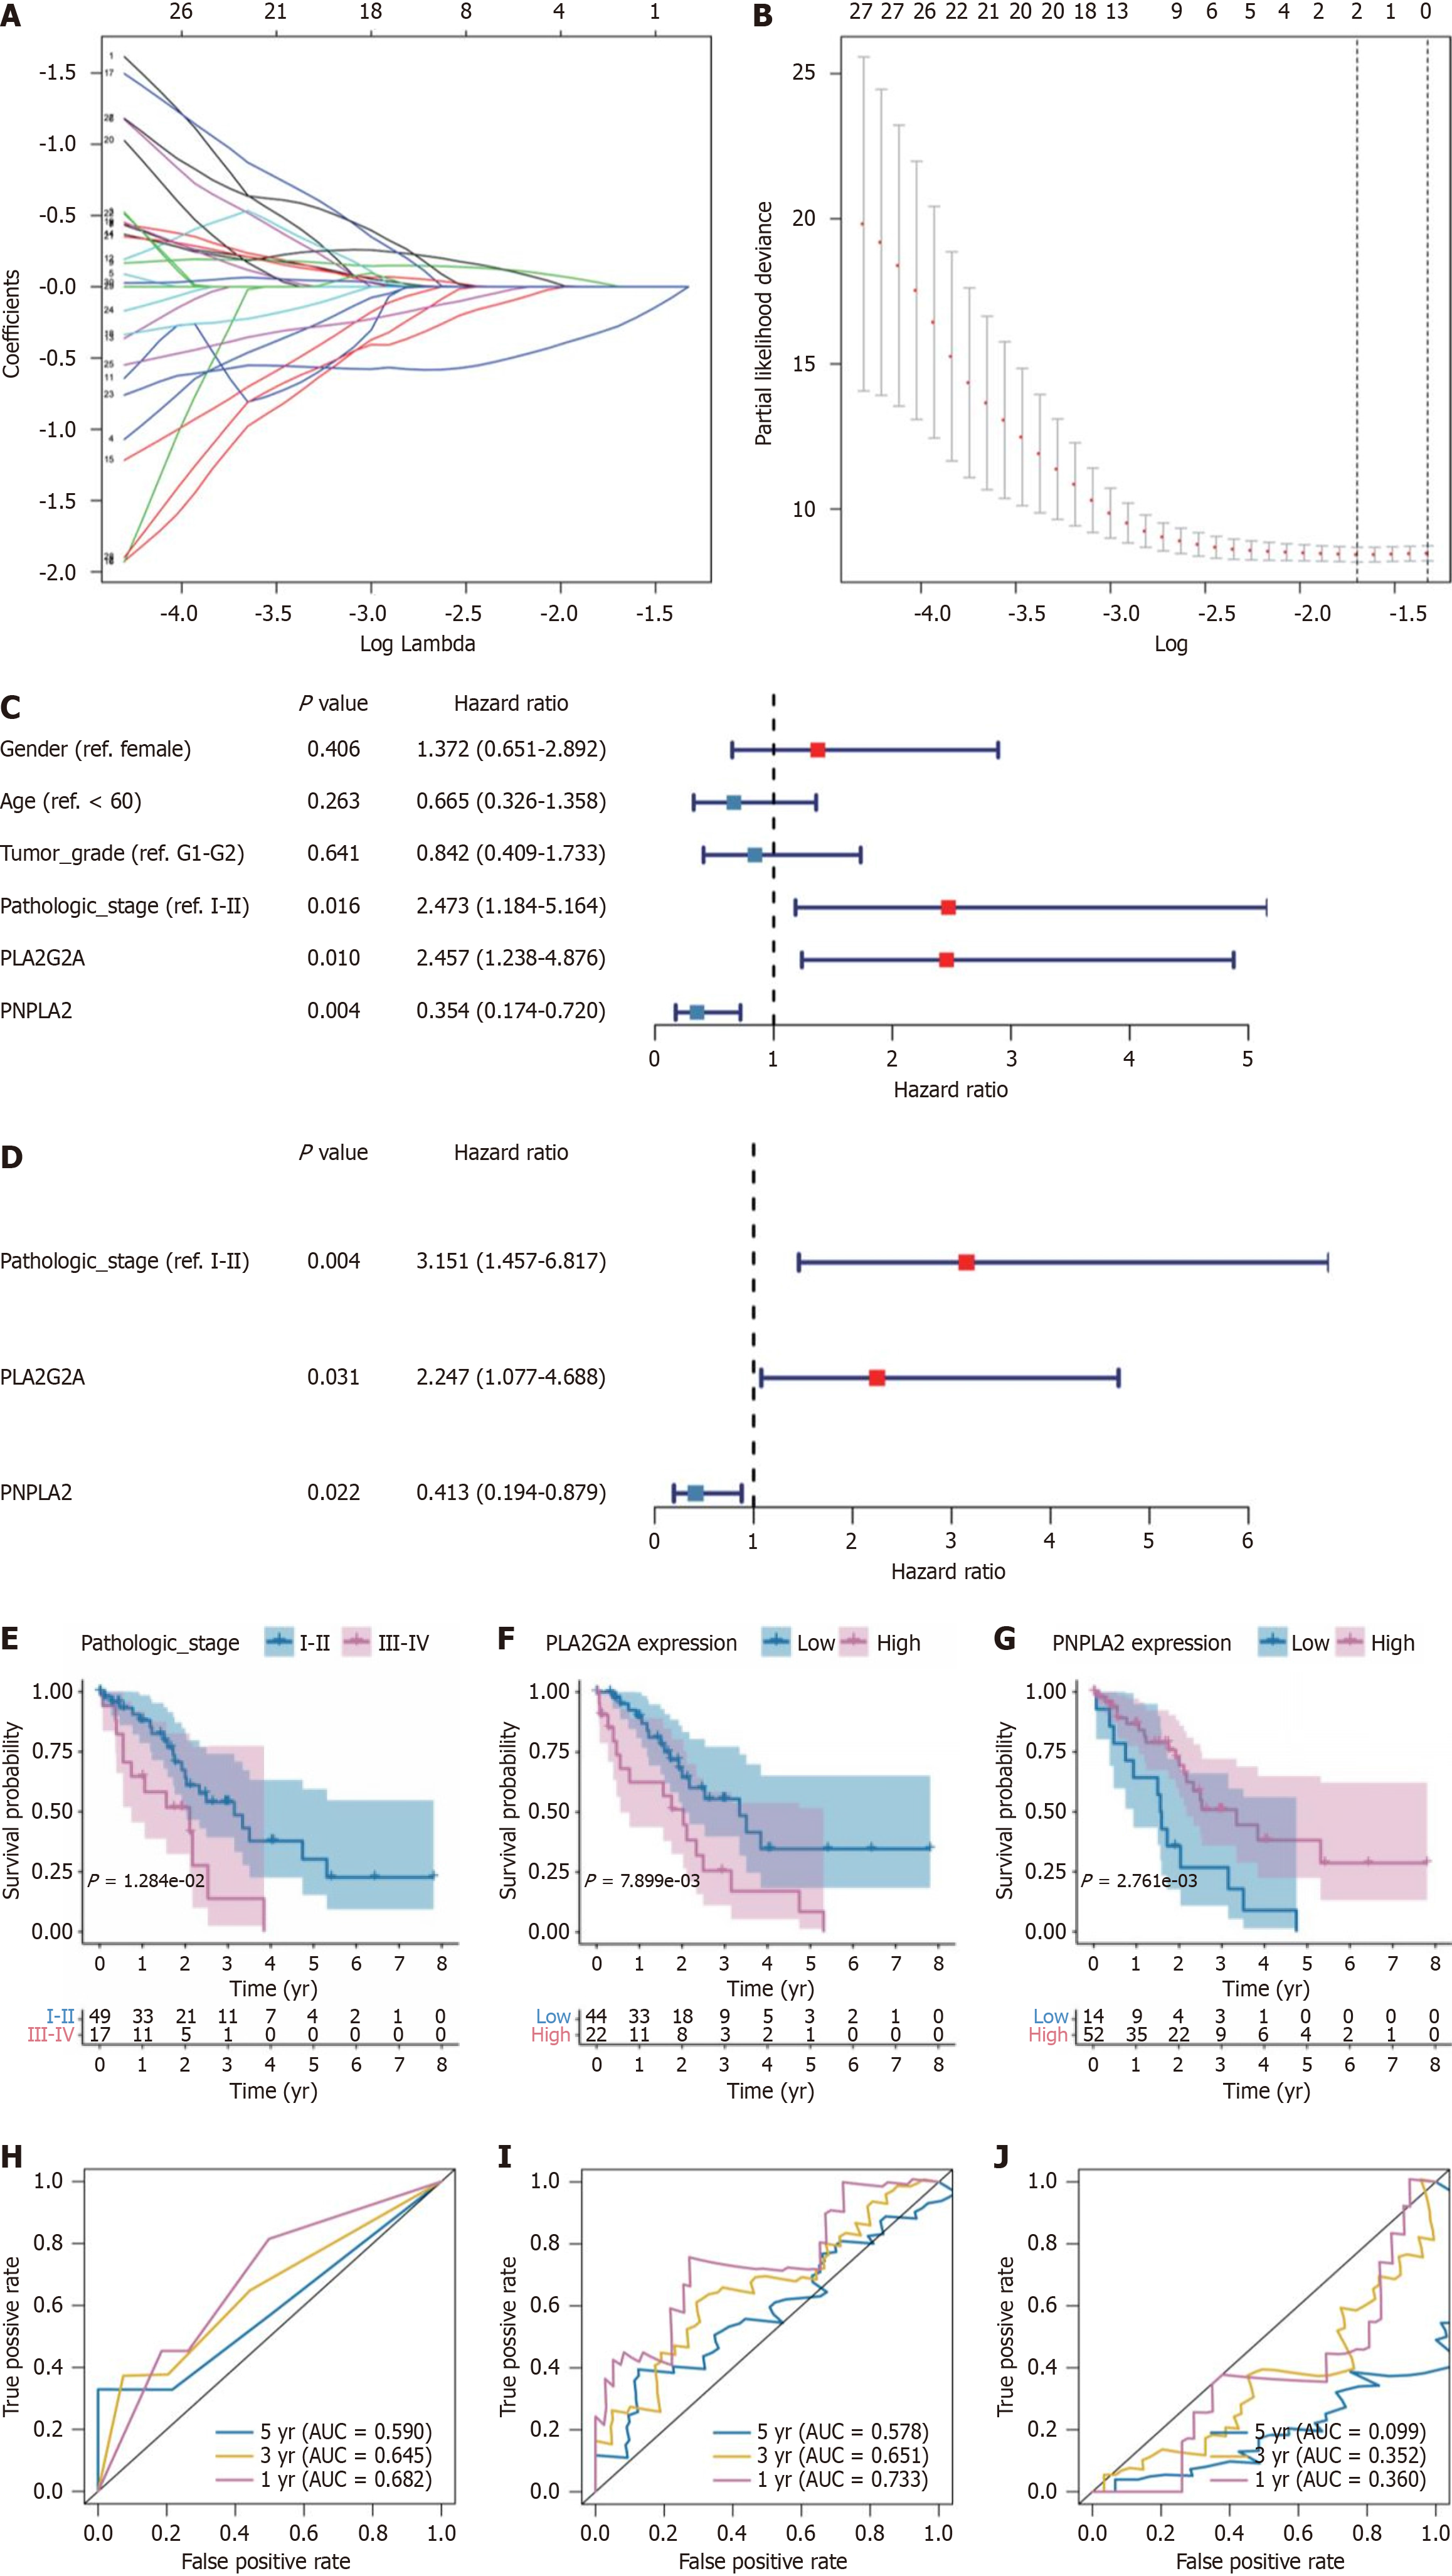
Figure 6 Least Absolute Shrinkage and Selection Operator model optimization and prognostic analysis of PLA2G2A and PNPLA2 in cholangiocarcinoma survival.
A: A coefficient profile plot was generated against the log (λ) sequence. Selection of the optimal parameter (λ) in the Least Absolute Shrinkage and Selection Operator (LASSO) model; B: Partial likelihood deviance for LASSO coefficient profiles. The red dots represent the partial likelihood values, the gray lines represent the standard error. Validation of independent prognostic factors; C: Univariate Cox regression analysis was performed to determine the independence of clinical characteristics as prognostic factors; D: Multivariable Cox regression analysis to identify clinical characteristics as prognostic factors; E-G: The survival curve for patients with, pathologic-stage, PLA2G2A, PNPLA2. The receiver operating characteristic (ROC) curve for 1, 3 and 5 overall survival of cholangiocarcinoma patients; H-J: 1-, 3-, and 5-years ROC curve corresponding to PLA2G2A, PNPLA2, and pathologic-stage. AUC: Area under the curve.
- Citation: Qiu C, Xiang YK, Da XB, Zhang HL, Kong XY, Hou NZ, Zhang C, Tian FZ, Yang YL. Phospholipase A2 enzymes PLA2G2A and PLA2G12B as potential diagnostic and prognostic biomarkers in cholangiocarcinoma. World J Gastrointest Surg 2024; 16(2): 289-306
- URL: https://www.wjgnet.com/1948-9366/full/v16/i2/289.htm
- DOI: https://dx.doi.org/10.4240/wjgs.v16.i2.289


