©The Author(s) 2024.
World J Gastrointest Surg. Dec 27, 2024; 16(12): 3754-3763
Published online Dec 27, 2024. doi: 10.4240/wjgs.v16.i12.3754
Published online Dec 27, 2024. doi: 10.4240/wjgs.v16.i12.3754
Figure 1 Comparison of liver function indicators before and after surgery between the observation and control groups.
A: Comparison of total bilirubin before and after surgery between the two groups; B: Comparison of alanine aminotransferase before and after surgery between the two groups; C: Comparison of aspartate aminotransferase before and after surgery between the two groups. aP < 0.05 for comparison before and after surgery within the group; bP < 0.05 for comparison between groups. ALT: Alanine Aminotransferase; TBil: Total Bilirubin; AST: Aspartate aminotransferase.
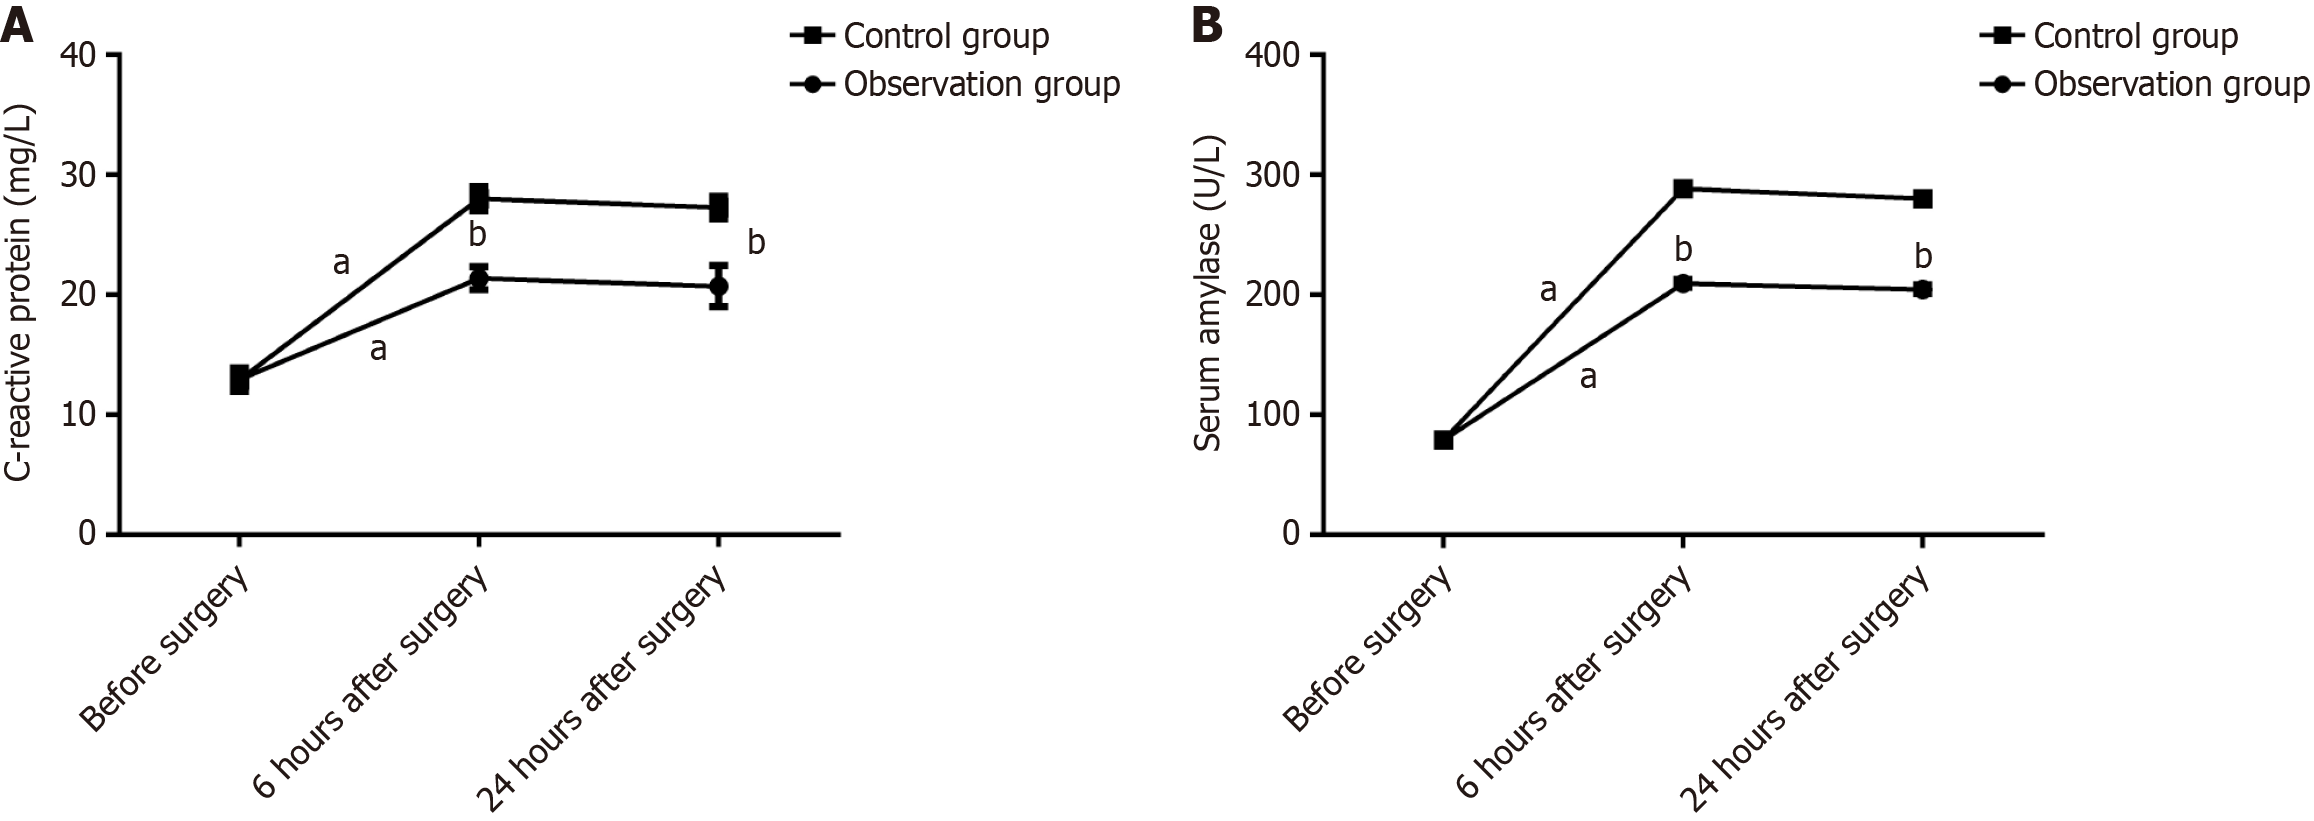
Figure 2 Comparison of changes in C-reactive protein and serum amylase in the pediatric observational and control groups following surgery.
A: Comparison of C-reactive protein in the two groups of children before and after surgery; B: Comparison of serum amylase in the two groups of children before and after surgery. aP < 0.05 for comparison before and after surgery within the group; bP < 0.05 for comparison between groups.
- Citation: Wang XQ, Kong CH, Ye M, Diao M. Analysis of the efficacy and safety of endoscopic retrograde cholangiopancreatography for the treatment of pediatric pancreatobiliary diseases. World J Gastrointest Surg 2024; 16(12): 3754-3763
- URL: https://www.wjgnet.com/1948-9366/full/v16/i12/3754.htm
- DOI: https://dx.doi.org/10.4240/wjgs.v16.i12.3754


