Copyright
©The Author(s) 2024.
World J Gastrointest Surg. Nov 27, 2024; 16(11): 3598-3605
Published online Nov 27, 2024. doi: 10.4240/wjgs.v16.i11.3598
Published online Nov 27, 2024. doi: 10.4240/wjgs.v16.i11.3598
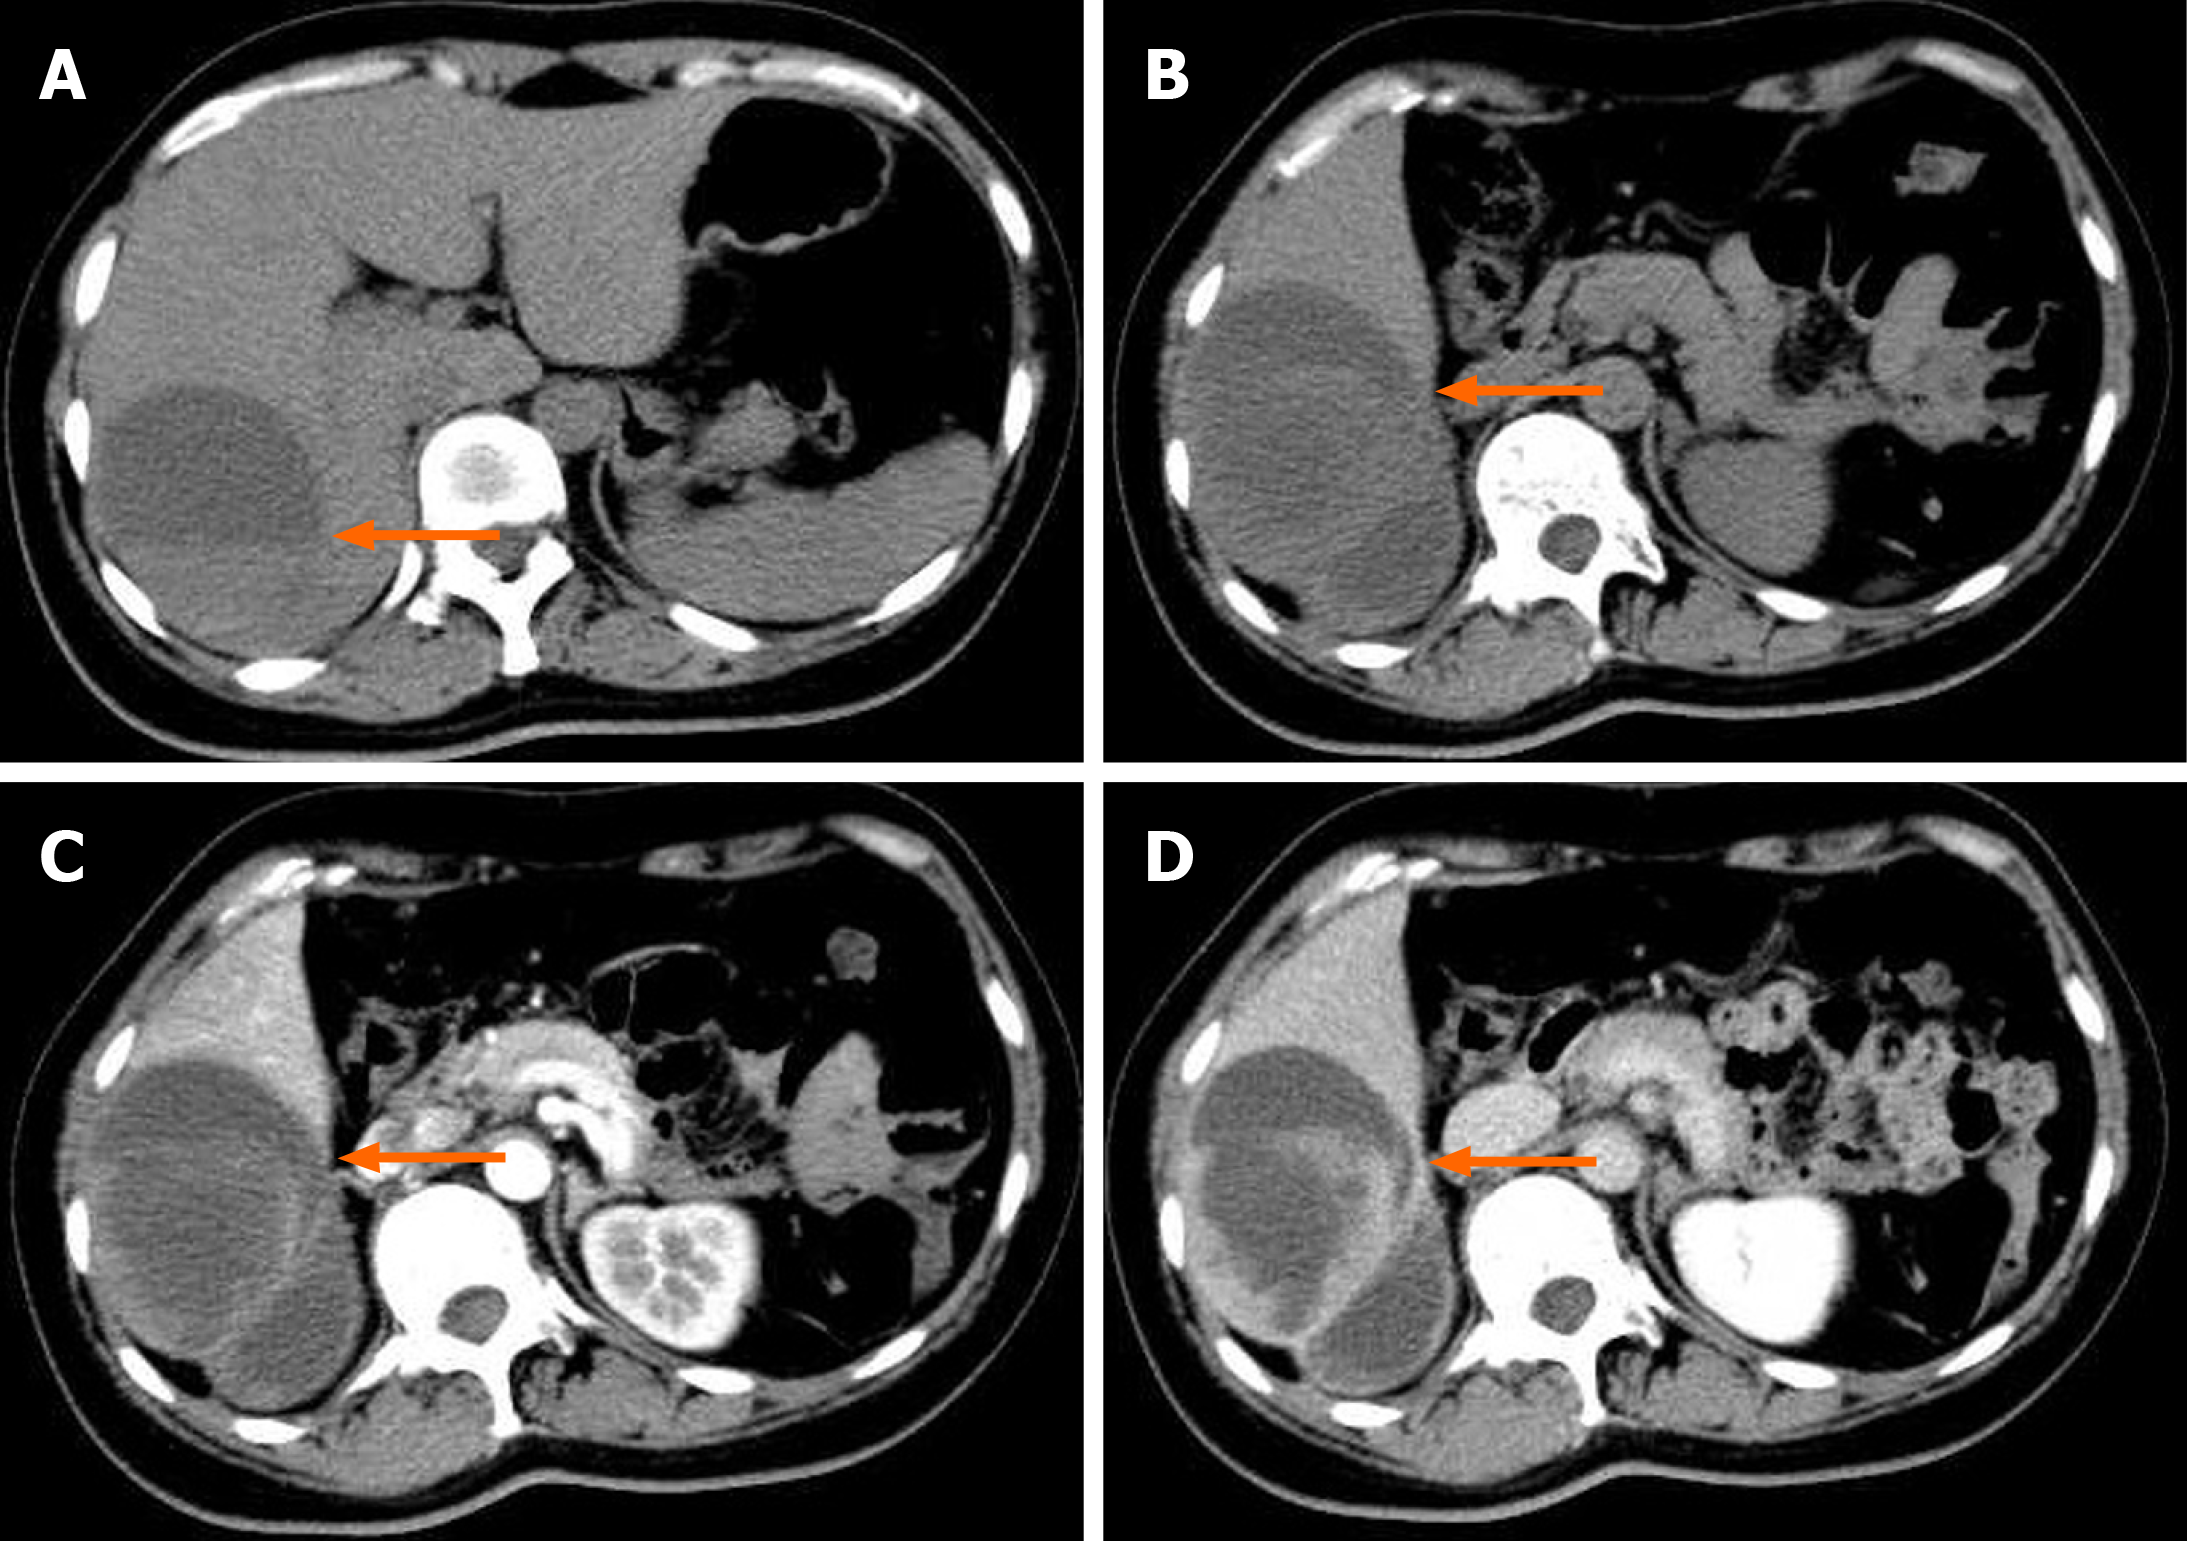
Figure 1 Computed tomography of the upper abdomen before surgery.
A mixed low-density lesion (6.5 cm × 9.7 cm × 9.6 cm) can be seen in the right lobe of the liver, within which septations and fluid levels are visible. The enhanced scan showed significant enhancement of the lesion margin and septation (the arrow shows the lesion). A: Plain computed tomography scan; B: Plain computed tomography scan; C: The arterial phase of the enhanced scan; D: Delayed phase.
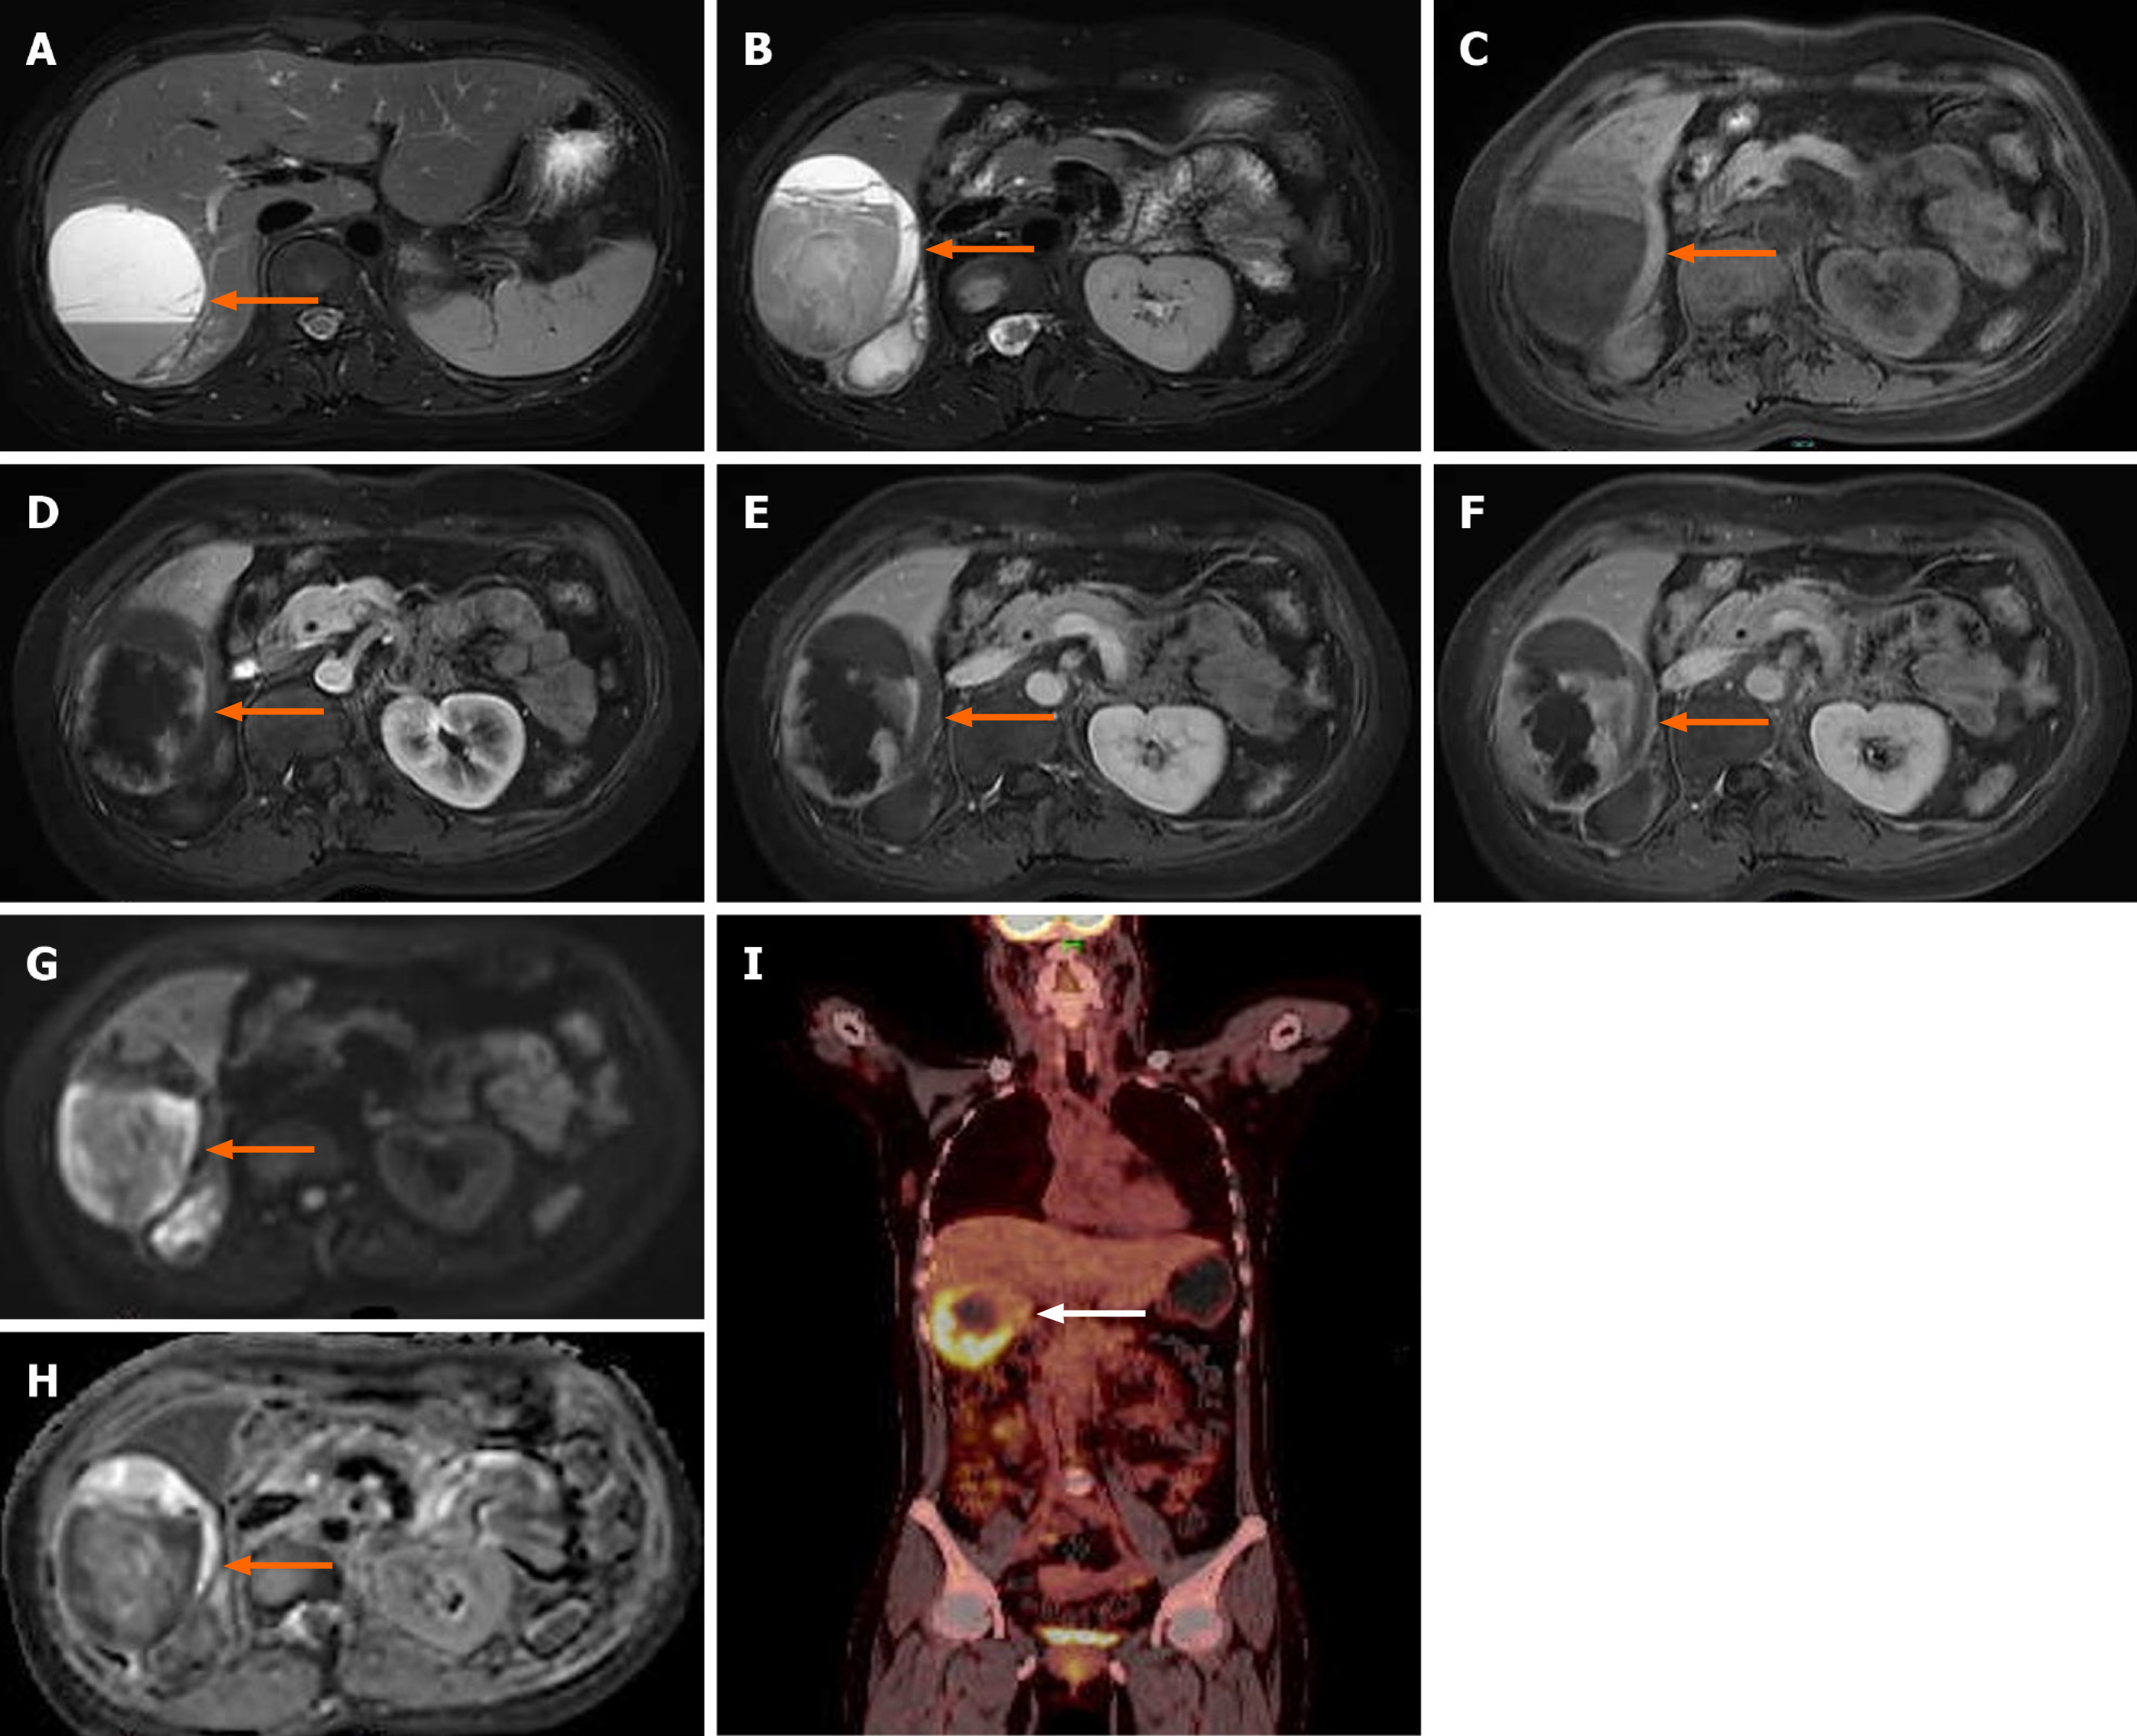
Figure 2 Magnetic resonance imaging of the upper abdomen and positron emission tomography-computed tomography.
Magnetic resonance imaging showed a massive abnormal signal lesion in the right lobe of the liver, with septations and fluid levels. The lesion showed heterogeneous hypointensity on T1-weighted imaging and heterogeneous hyperintensity on T2-weighted imaging. The edges and septations of the lesion were significantly enhanced during the arterial phase, and the enhancement partially fused and filled toward the center of the lesion during the portal phase and delayed phase. Diffusion-weighted imaging showed a hyperintense signal and the corresponding apparent diffusion coefficient map showed a decreased signal intensity in parts of the wall of the lesion (the arrow shows the lesion). The positron emission tomography-computed tomography scan showed an irregular low-density lesion in the right lobe of the liver with increased uptake (the arrow shows the lesion). A and B: T2-weighted imaging; C: T1-weighted imaging; D: Diffusion-weighted imaging; E: Apparent diffusion coefficient; F: The arterial phase of the enhanced scan; G: The portal vein phase; H: Delayed phase; I: Positron emission tomography-computed tomography.
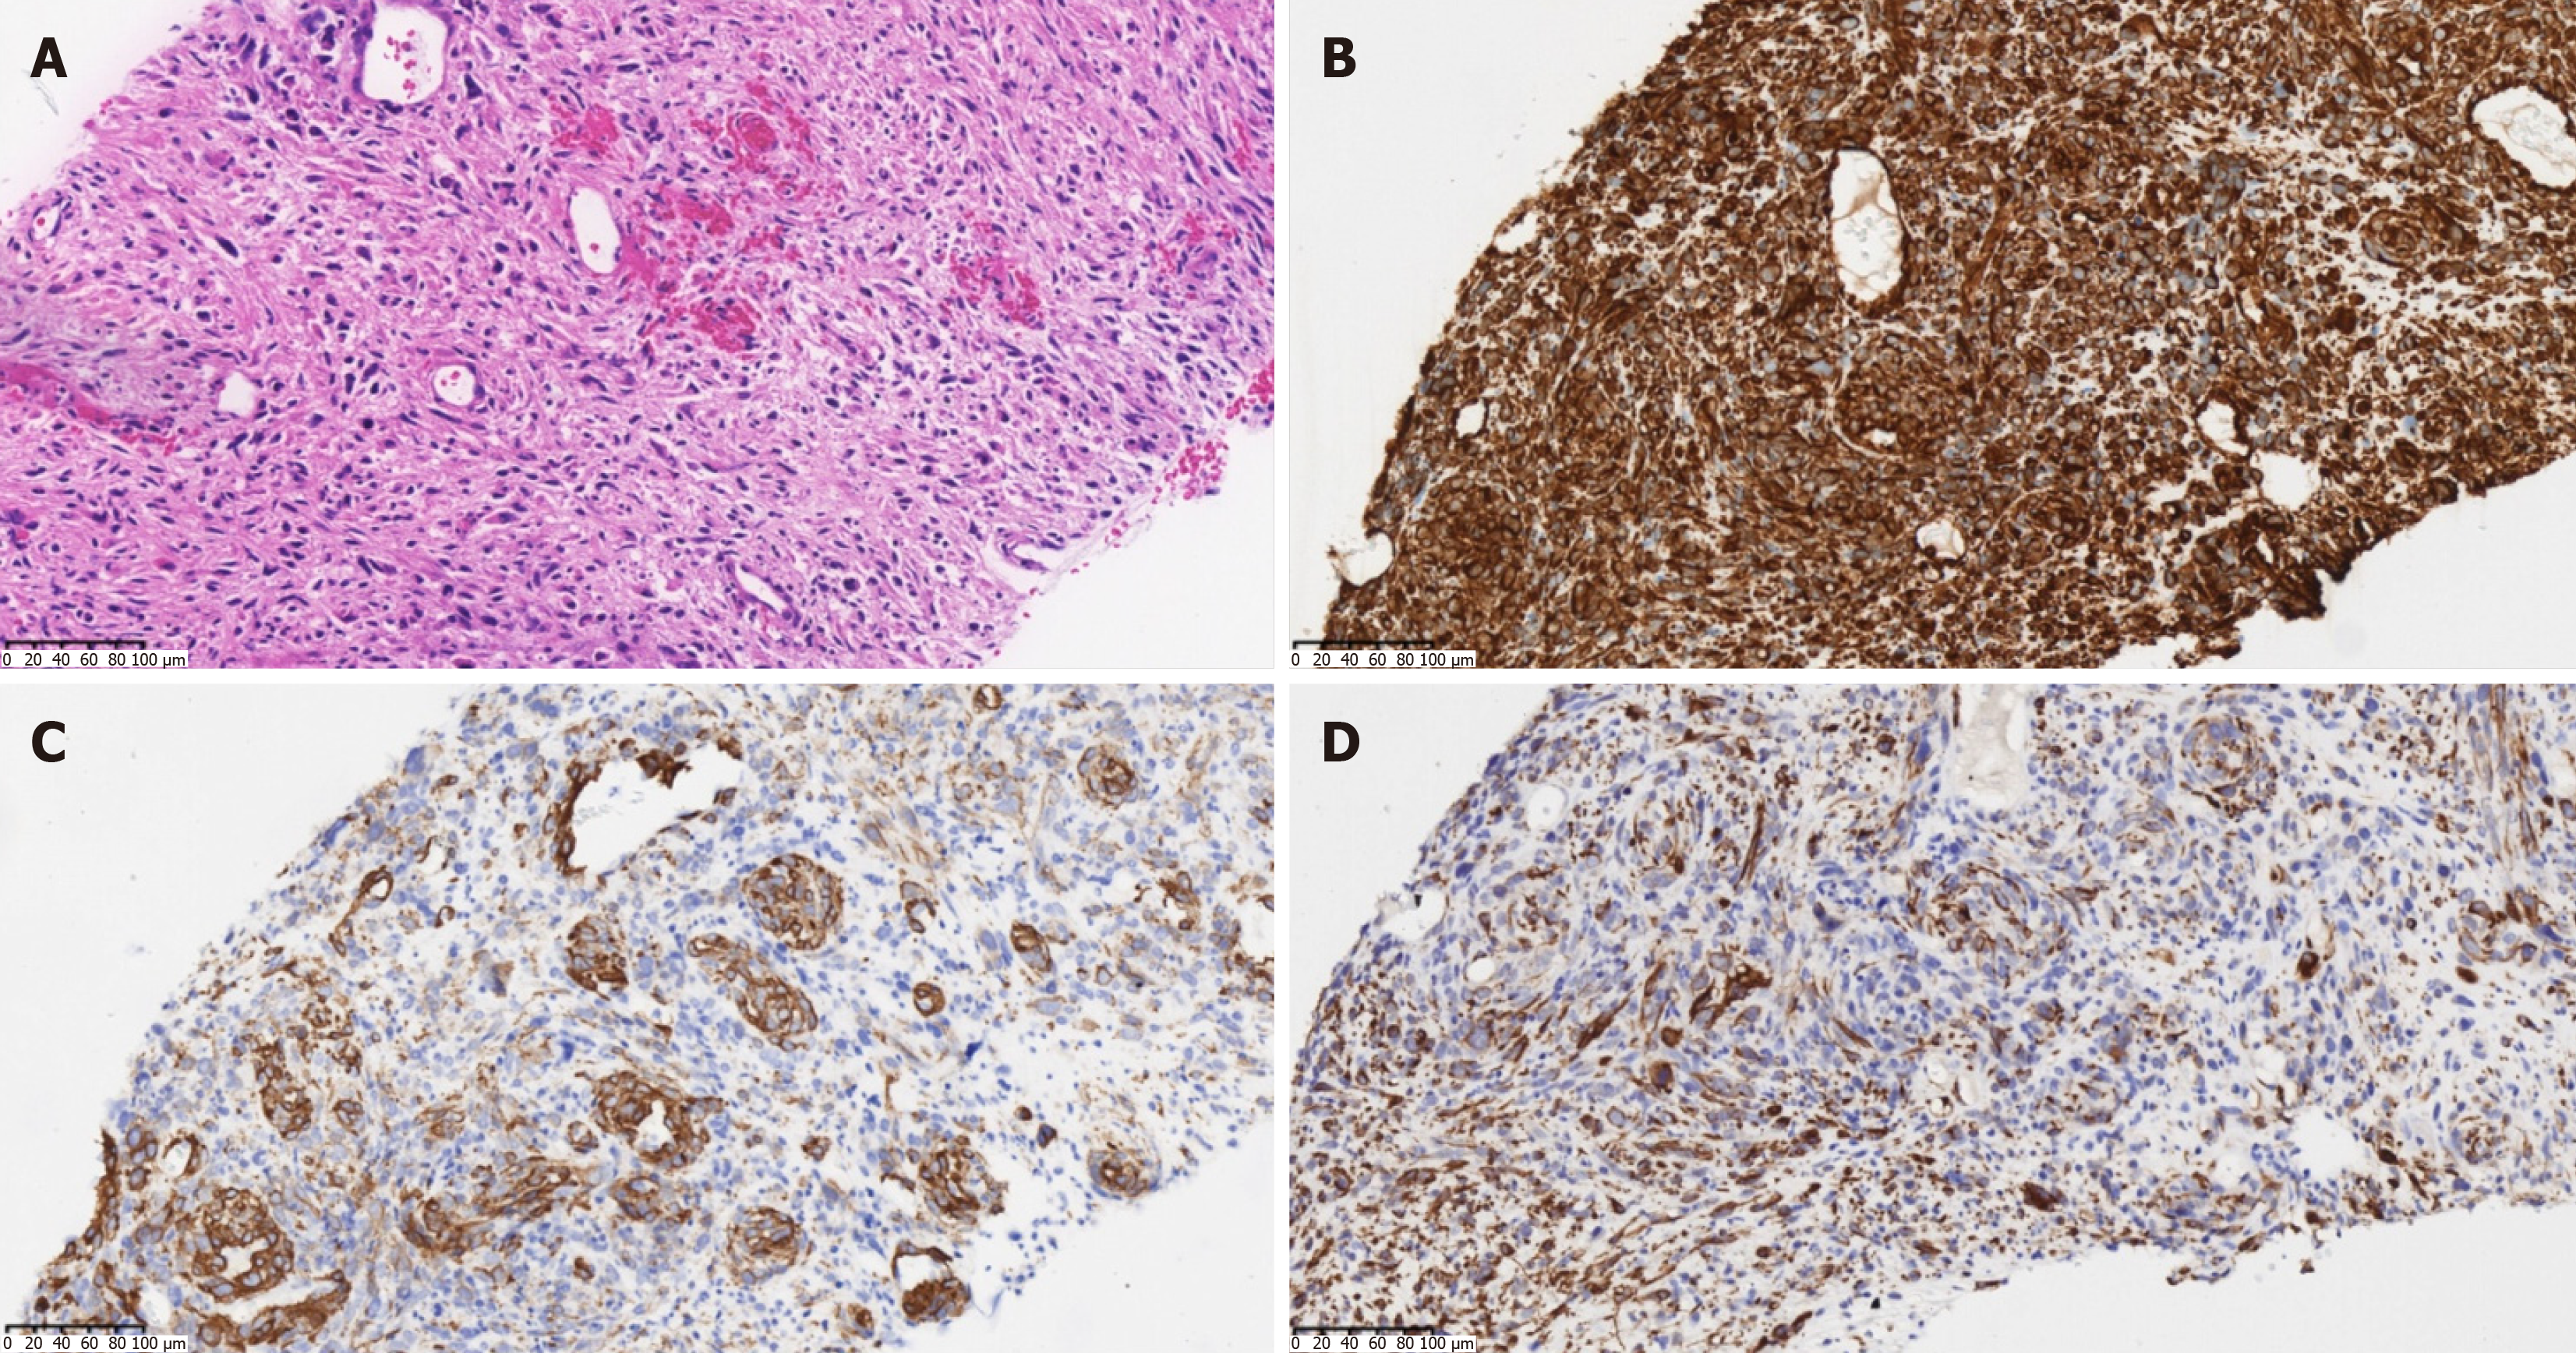
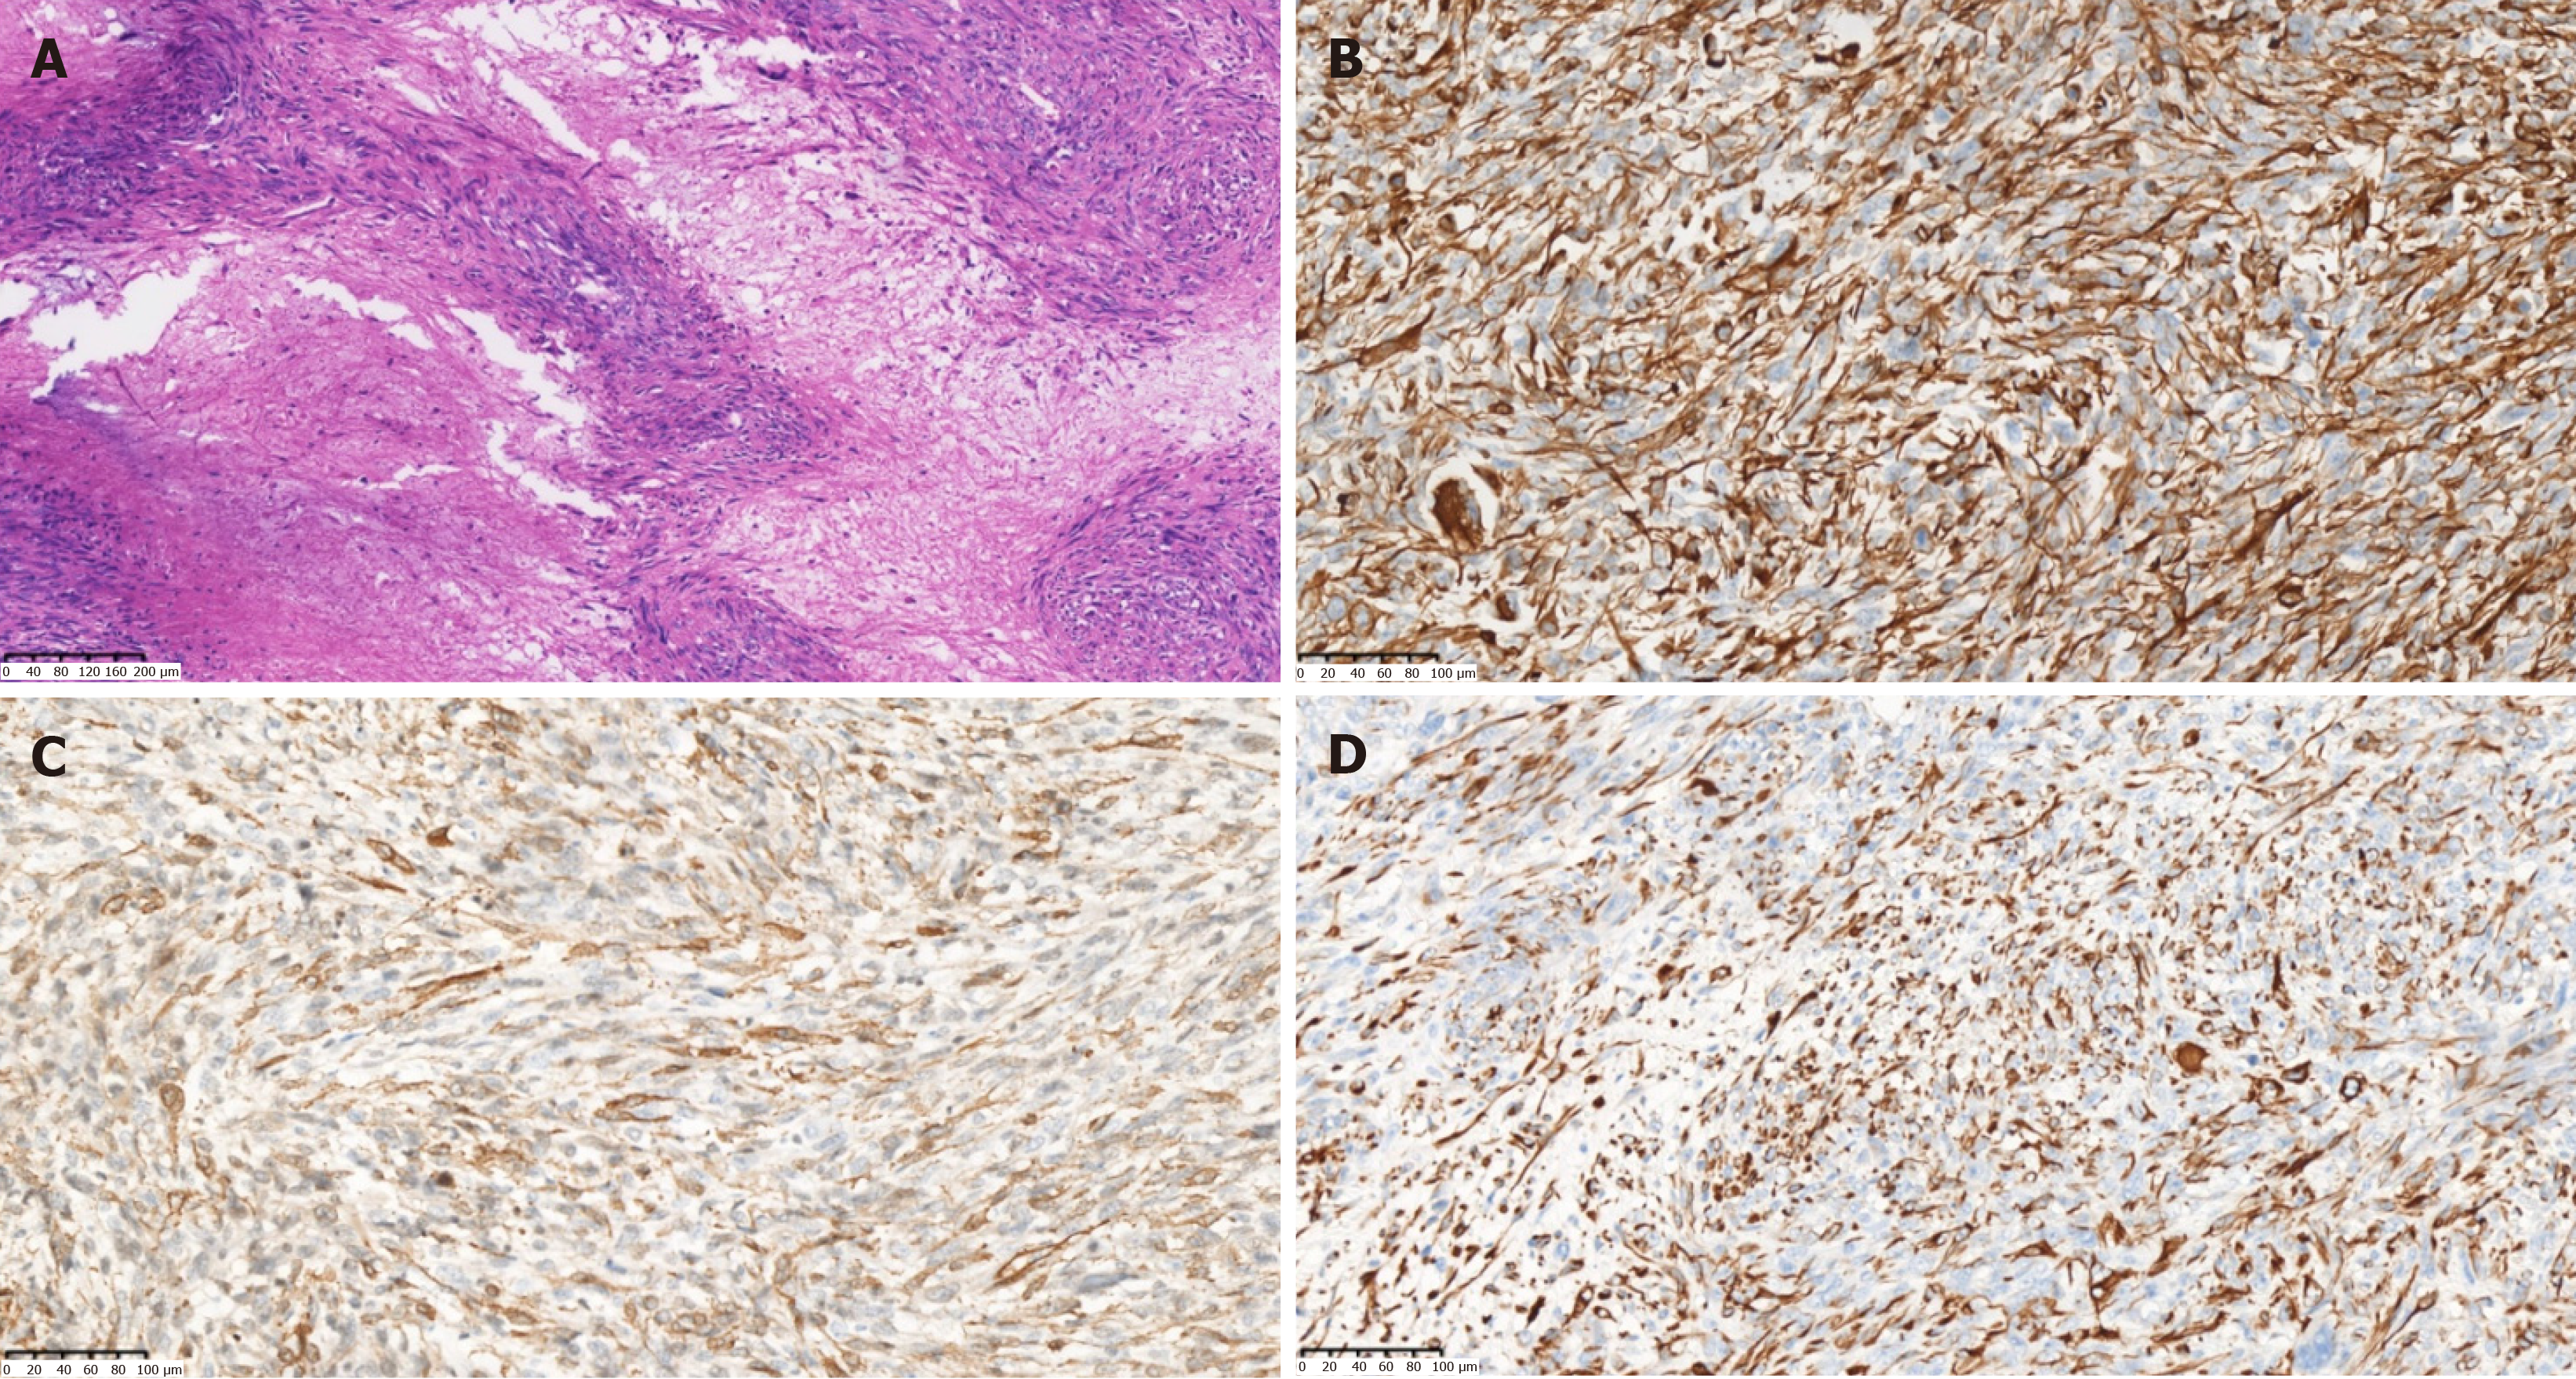
Figure 3 Pathology of the biopsy.
A: The tumor was composed of spindle-shaped cells, arranged in a woven pattern, and irregular cell nuclei and frequent mitotic images were observed (hematoxylin and eosin staining, × 200); B: Vimentin (+) (hematoxylin and eosin staining, × 200); C: Anti-smooth muscle actin (+) (immunohistochemical staining, × 200); D: Desmin (+) (immunohistochemical staining, × 200).
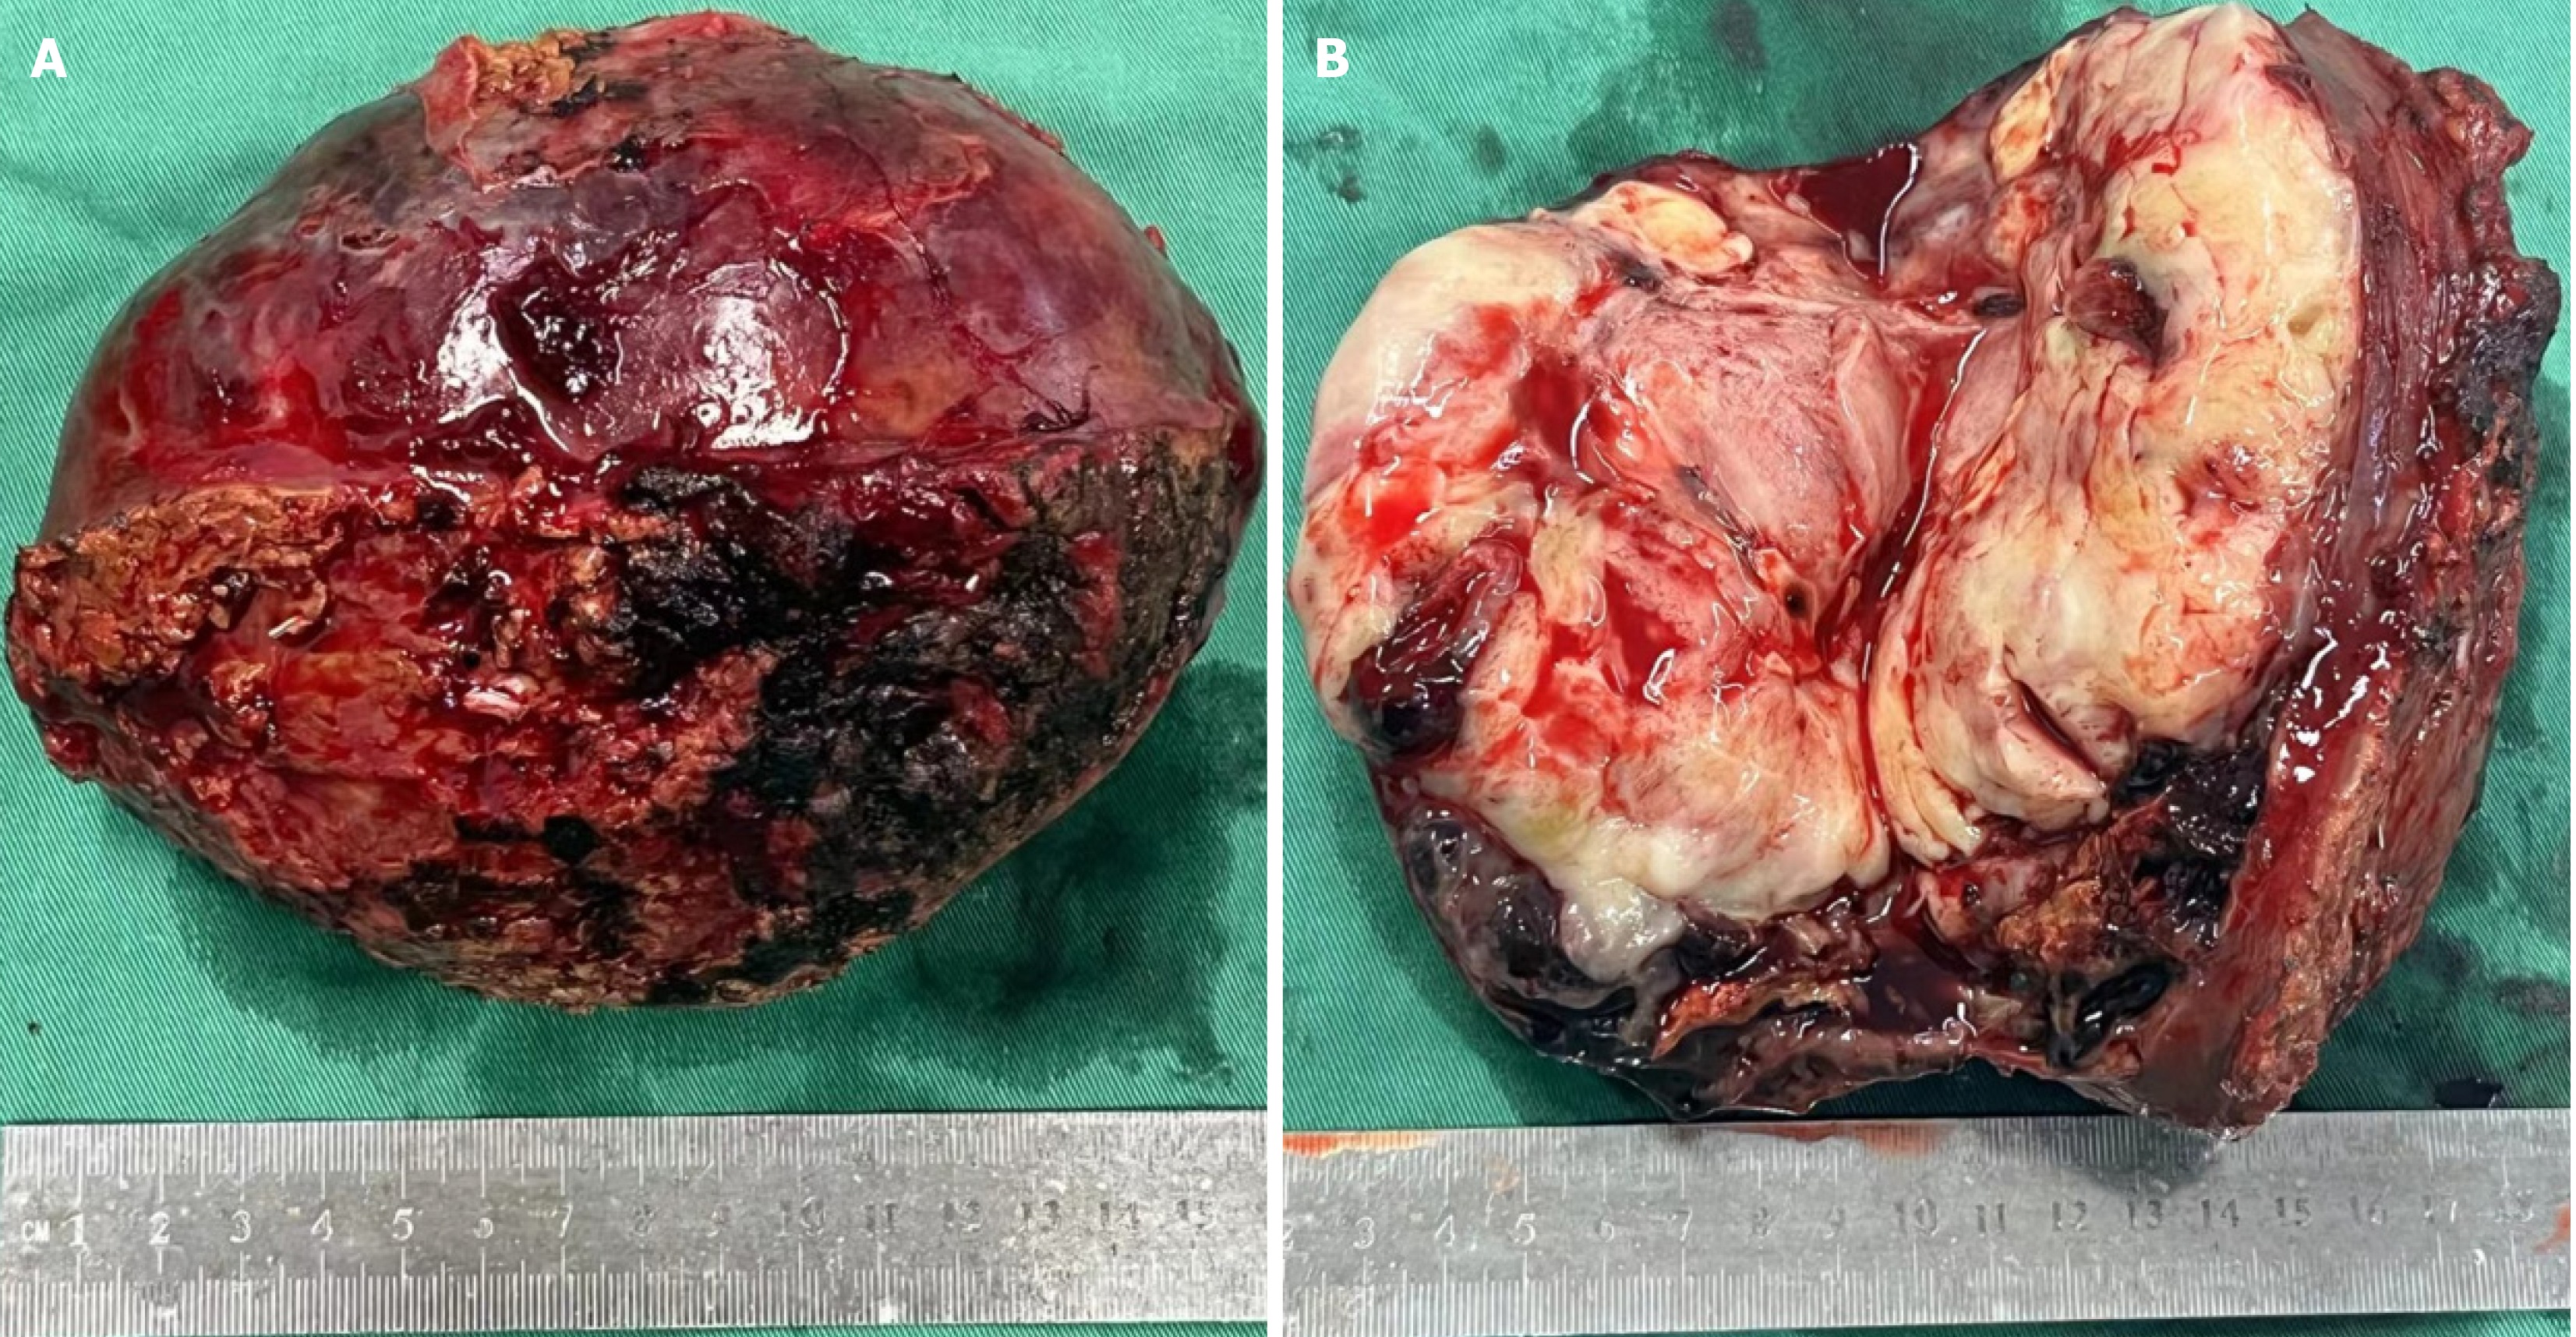
Figure 4 Gross specimen after surgery.
The tumor appeared to have a capsule, with a white-yellow appearance on the cut surface. The cystic part of the tumor was characterized by reddish fluid and old blood clots. A: Gross appearance of the tumor; B: Transverse view of the tumor.
Figure 5 Postoperative pathology.
A: Large areas of map-like necrosis were found in the tumor. The tumor cells were spindle-shaped and in a bunch-like arrangement, with obvious cell atypia, varying sizes, and frequent mitotic images (hematoxylin and eosin staining, × 100); B: Vimentin (+) (hematoxylin and eosin staining, × 200); C: Anti-smooth muscle actin (+) (immunohistochemical staining, × 200); D: Desmin (+) (immunohistochemical staining, × 200).
- Citation: Wu FN, Zhang M, Zhang K, Lv XL, Guo JQ, Tu CY, Zhou QY. Primary hepatic leiomyosarcoma masquerading as liver abscess: A case report. World J Gastrointest Surg 2024; 16(11): 3598-3605
- URL: https://www.wjgnet.com/1948-9366/full/v16/i11/3598.htm
- DOI: https://dx.doi.org/10.4240/wjgs.v16.i11.3598


