Copyright
©The Author(s) 2024.
World J Gastrointest Surg. Nov 27, 2024; 16(11): 3559-3567
Published online Nov 27, 2024. doi: 10.4240/wjgs.v16.i11.3559
Published online Nov 27, 2024. doi: 10.4240/wjgs.v16.i11.3559
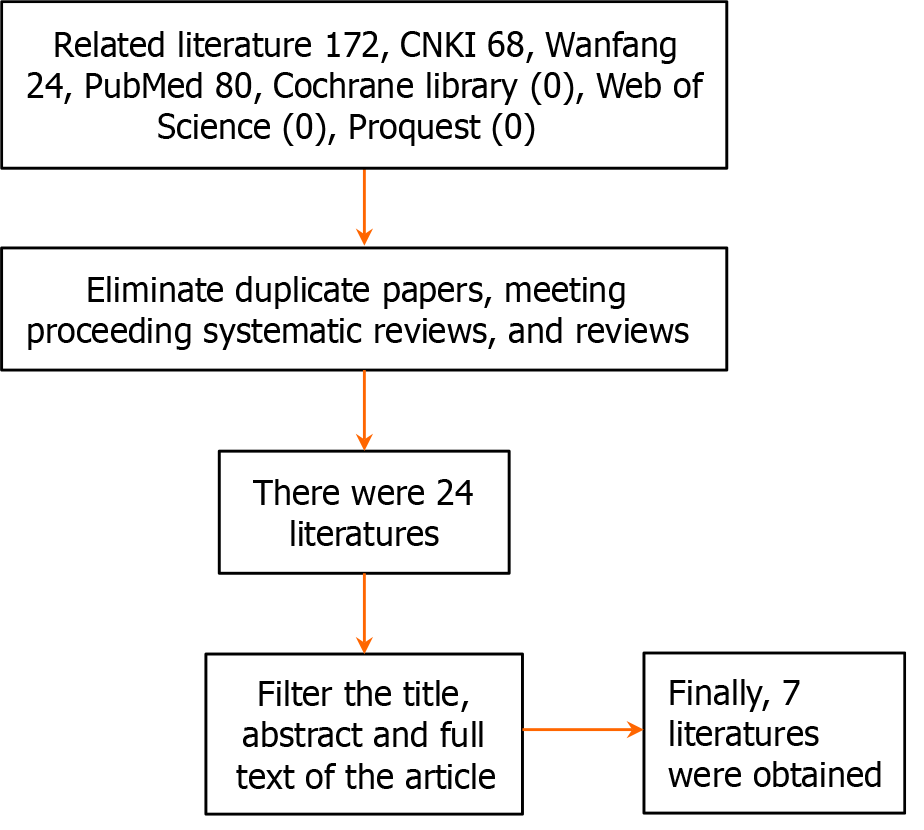
Figure 1
Flow chart of document retrieval.
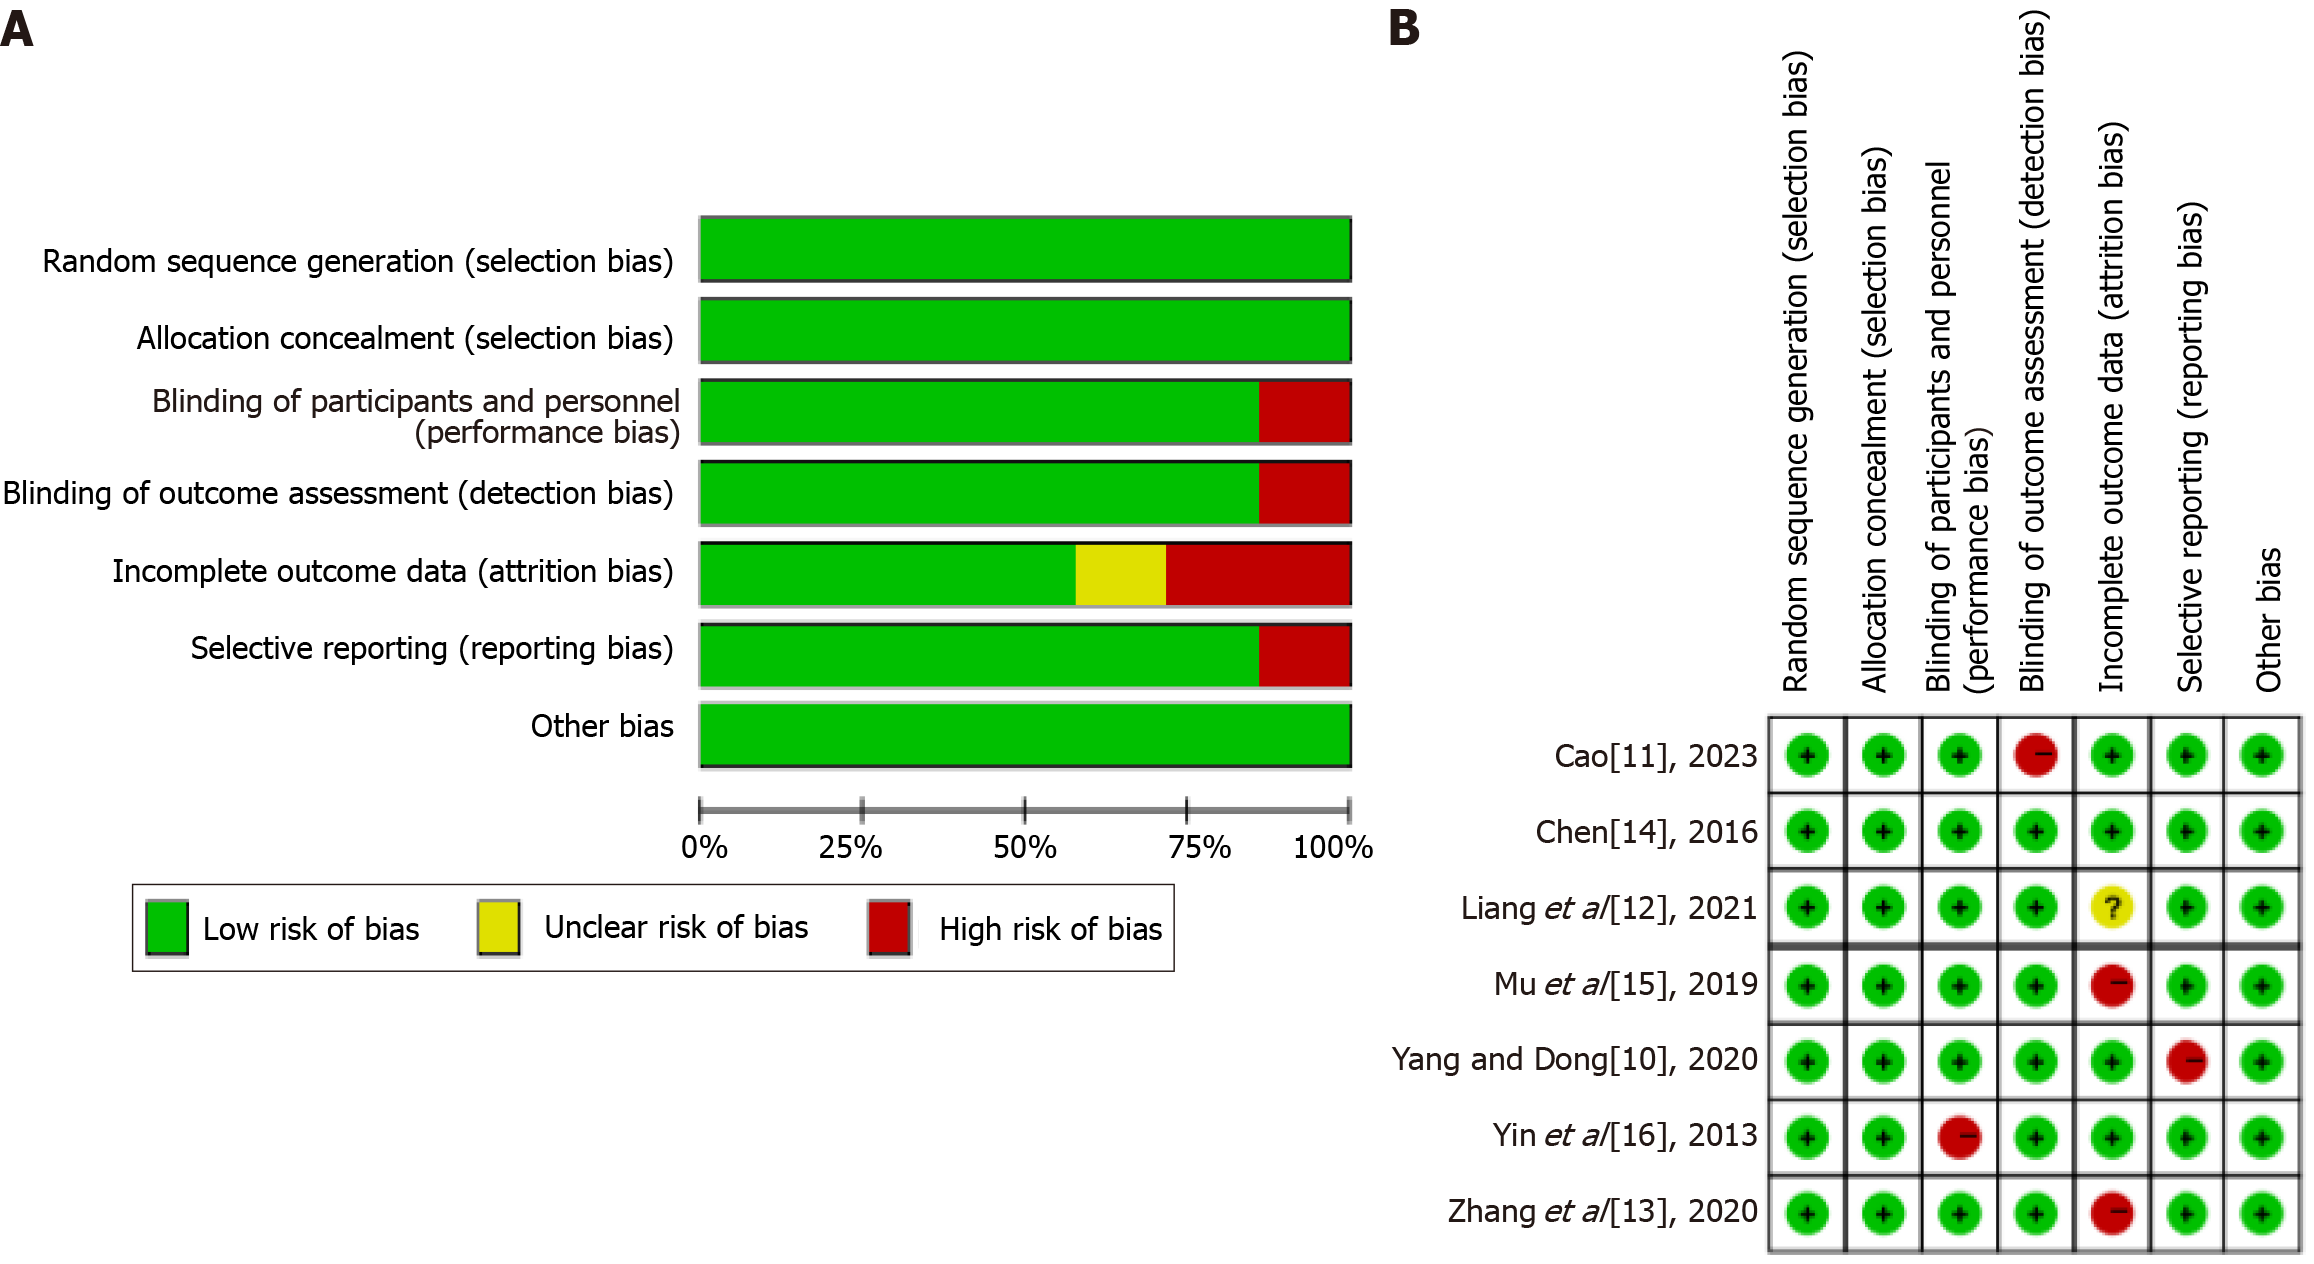
Figure 2 Shows the offset risk scale.
A: Bar chart for literature quality evaluation; B: Risk offset entries and applicability summary chart.
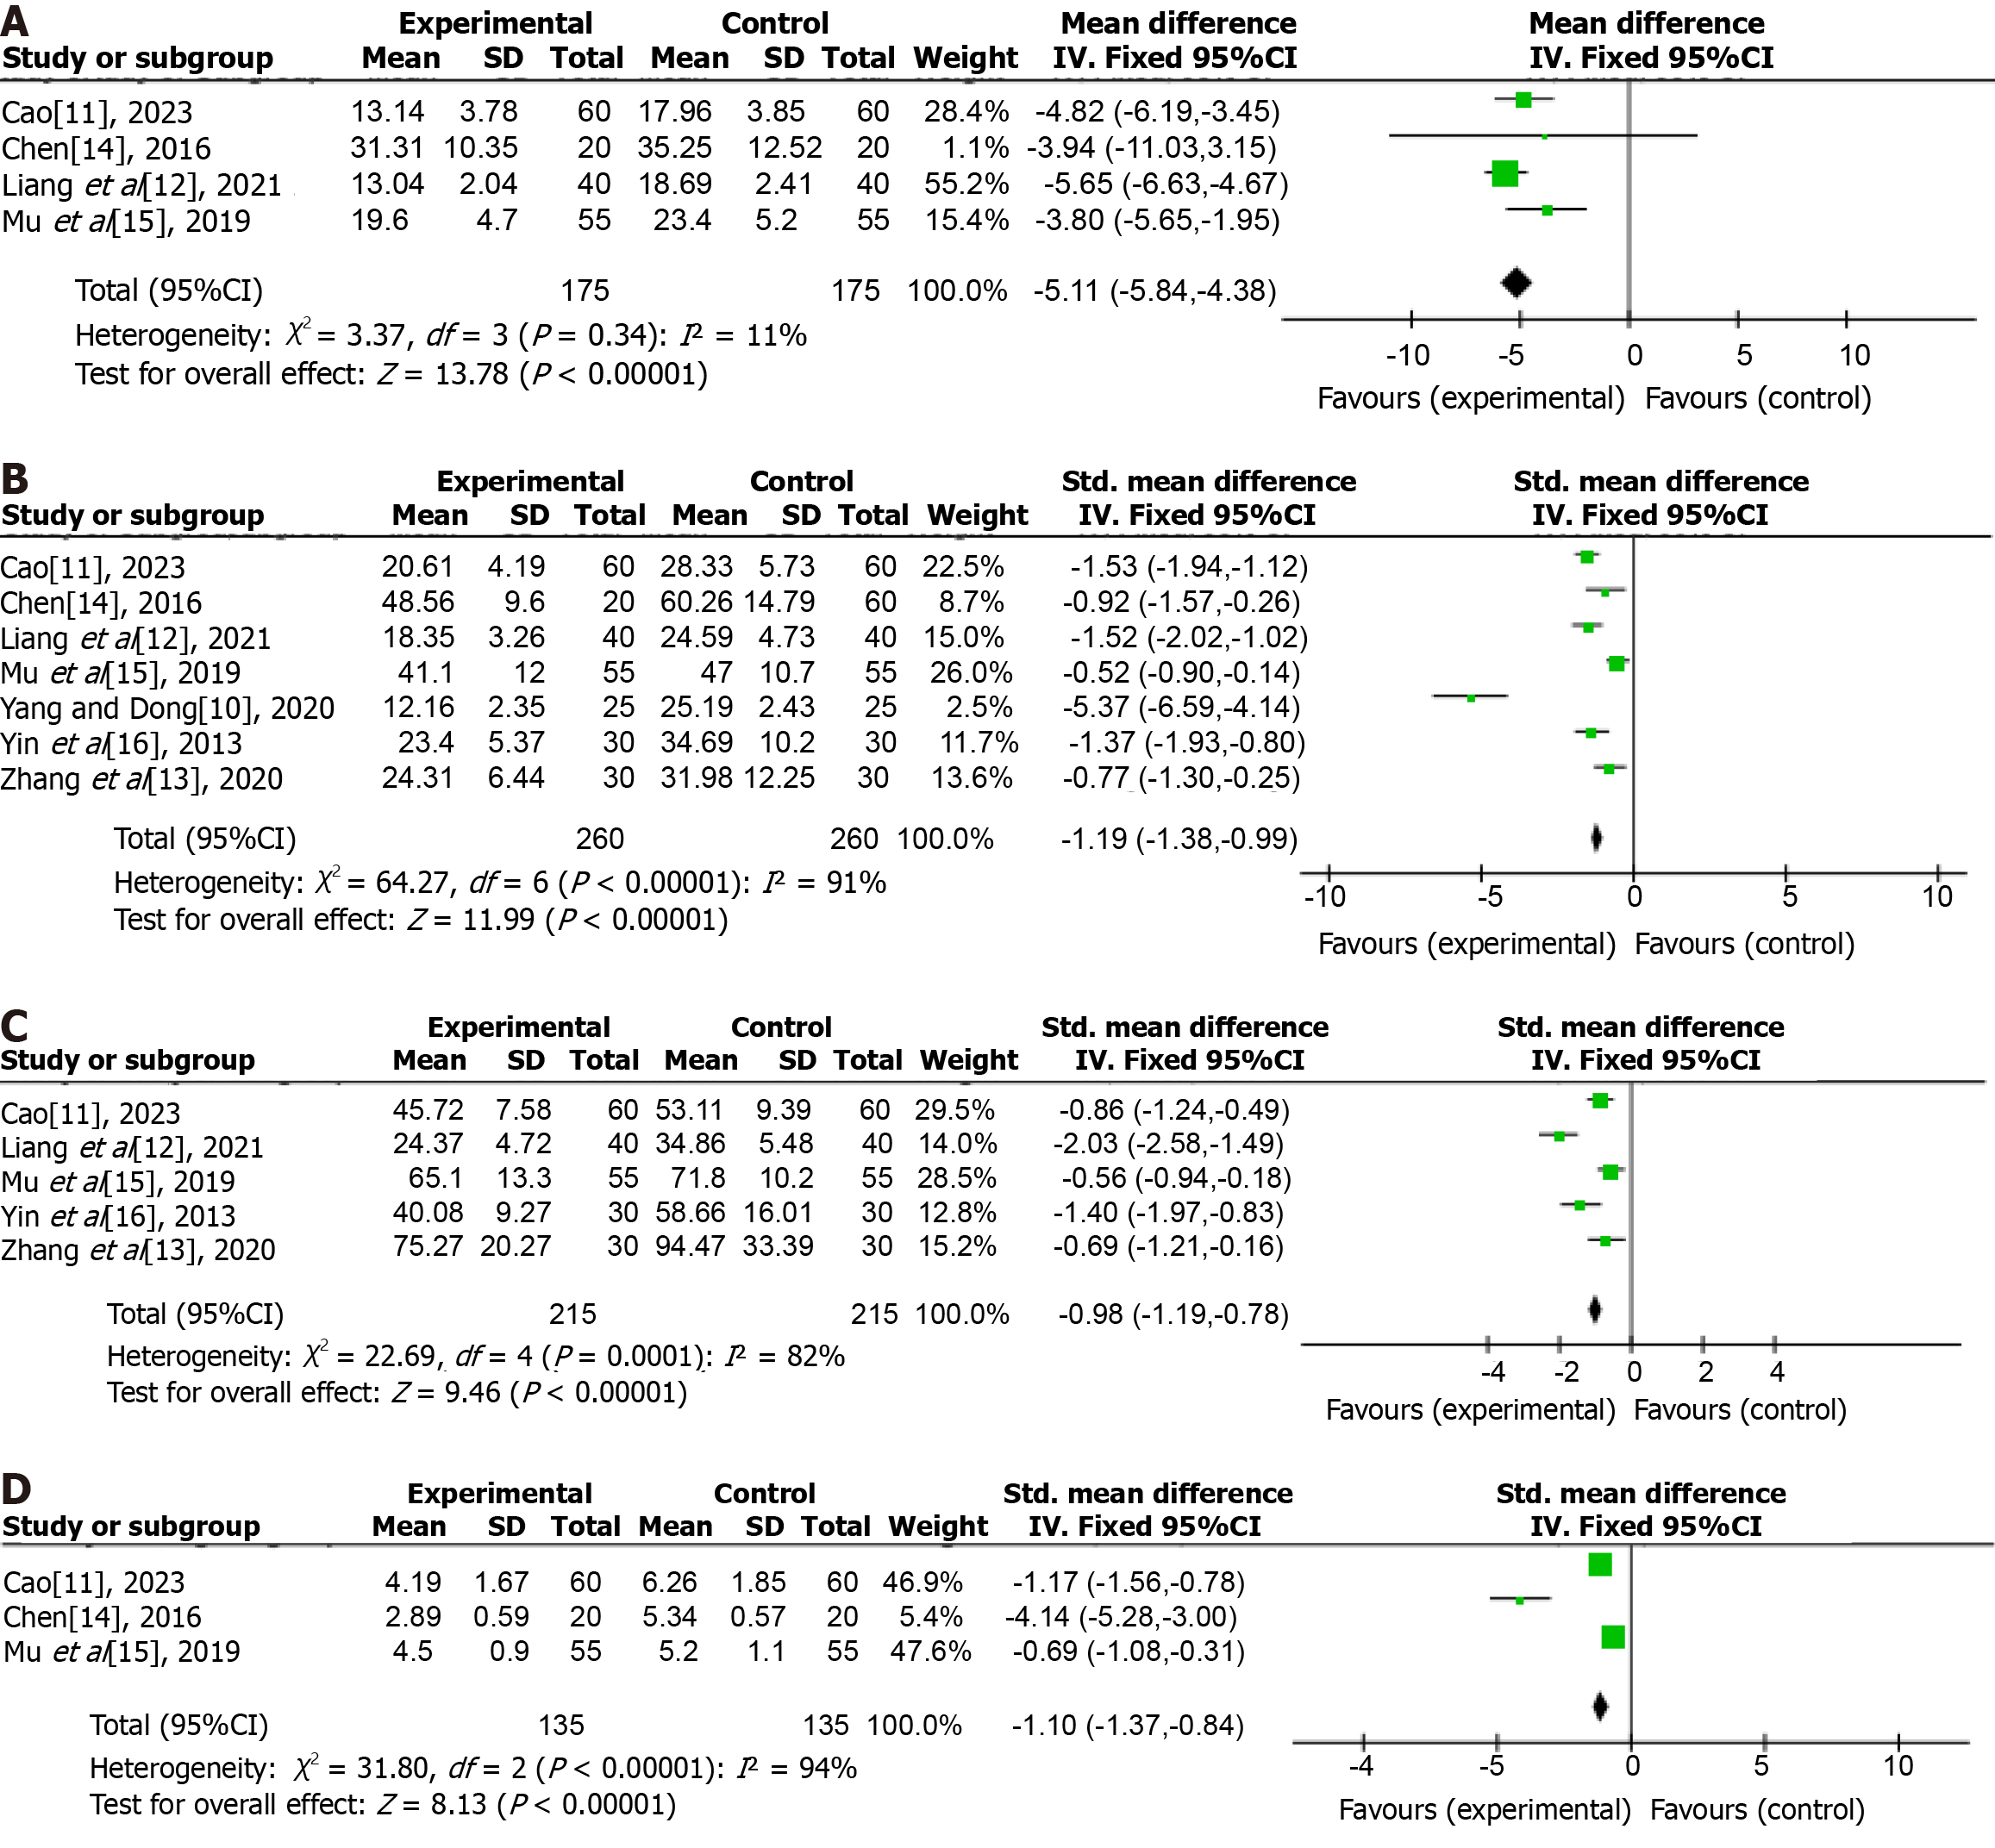
Figure 3 Time after electrical stimulation.
A: The recovery time of intestinal sound after electrical stimulation; B: The first anal exhaust time after electrical stimulation; C: The first anal defecation time after electrical stimulation; D: Hospital stay after electrical stimulation.
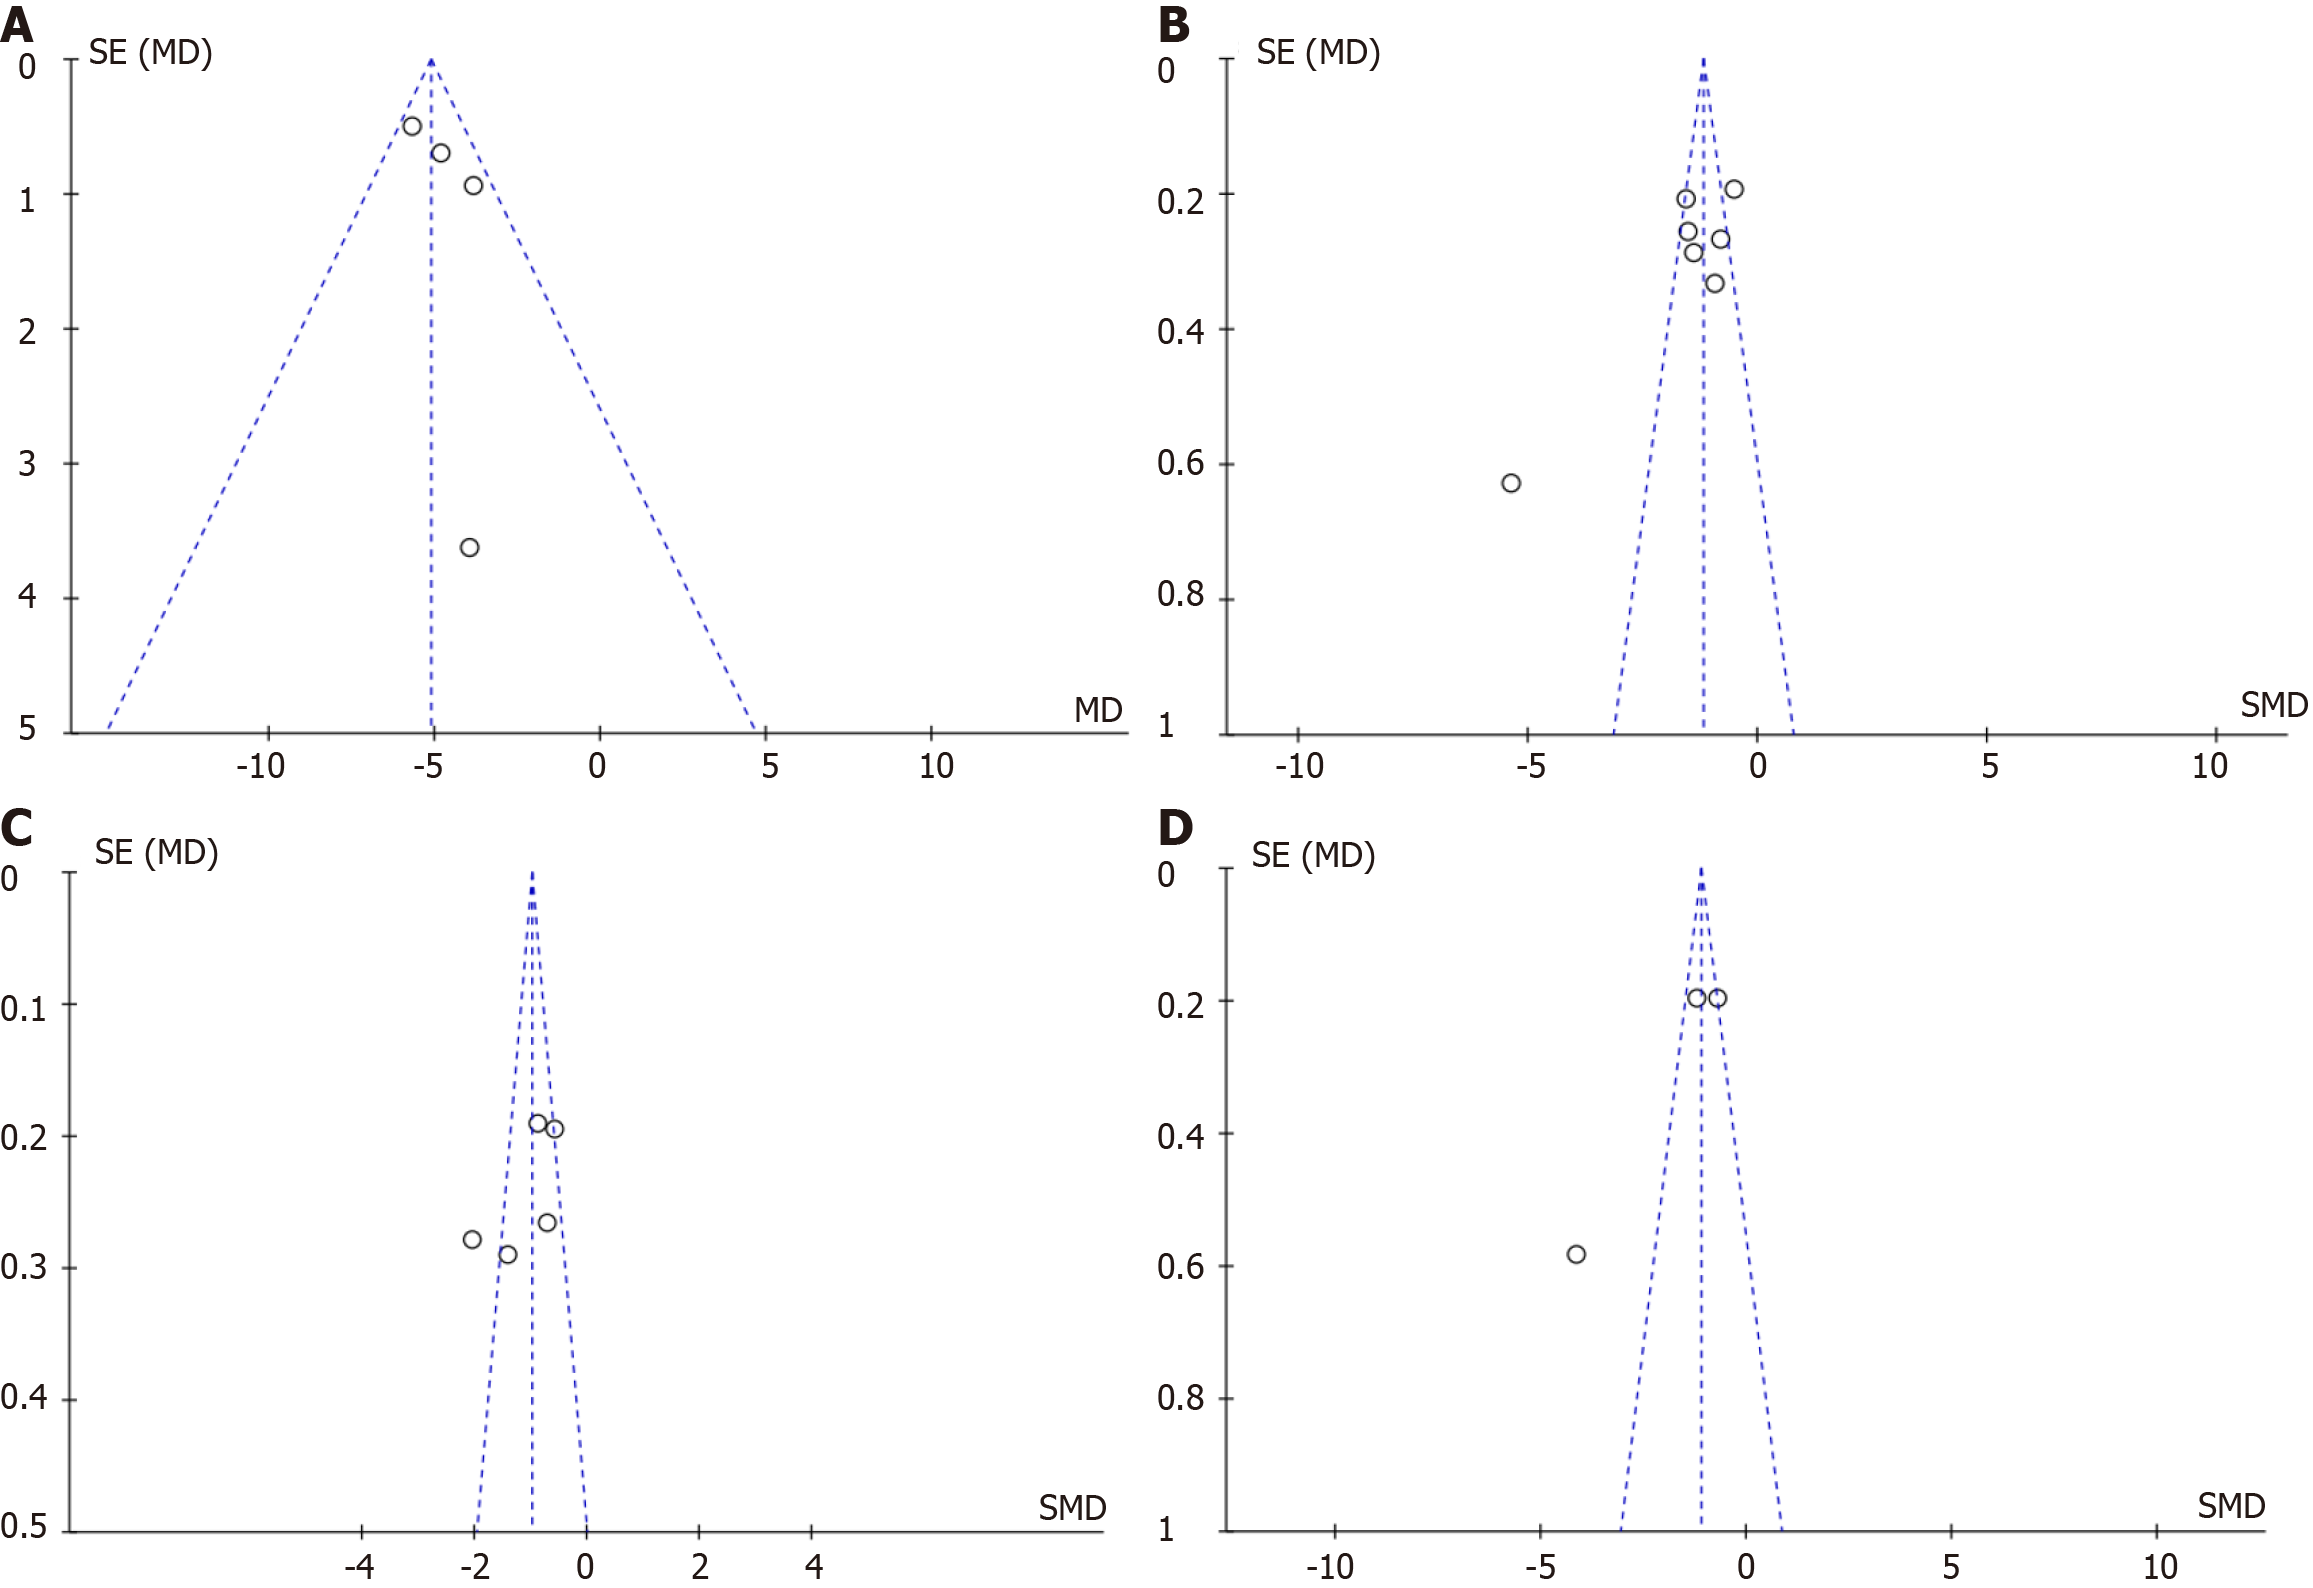
Figure 4 Shows the funnel diagram of each study.
A: Funnel diagram of bowel sound recovery time; B: Funnel diagram of first anal exhaust time; C: Funnel diagram of first anal defecation time; D: Funnel diagram of hospital stay.
- Citation: Huang XX, Gu HF, Shen PH, Chu BL, Chen Y. Meta-analysis of electrical stimulation promoting recovery of gastrointestinal function after gynecological abdominal surgery. World J Gastrointest Surg 2024; 16(11): 3559-3567
- URL: https://www.wjgnet.com/1948-9366/full/v16/i11/3559.htm
- DOI: https://dx.doi.org/10.4240/wjgs.v16.i11.3559


