Copyright
©The Author(s) 2024.
World J Gastrointest Surg. Nov 27, 2024; 16(11): 3463-3470
Published online Nov 27, 2024. doi: 10.4240/wjgs.v16.i11.3463
Published online Nov 27, 2024. doi: 10.4240/wjgs.v16.i11.3463
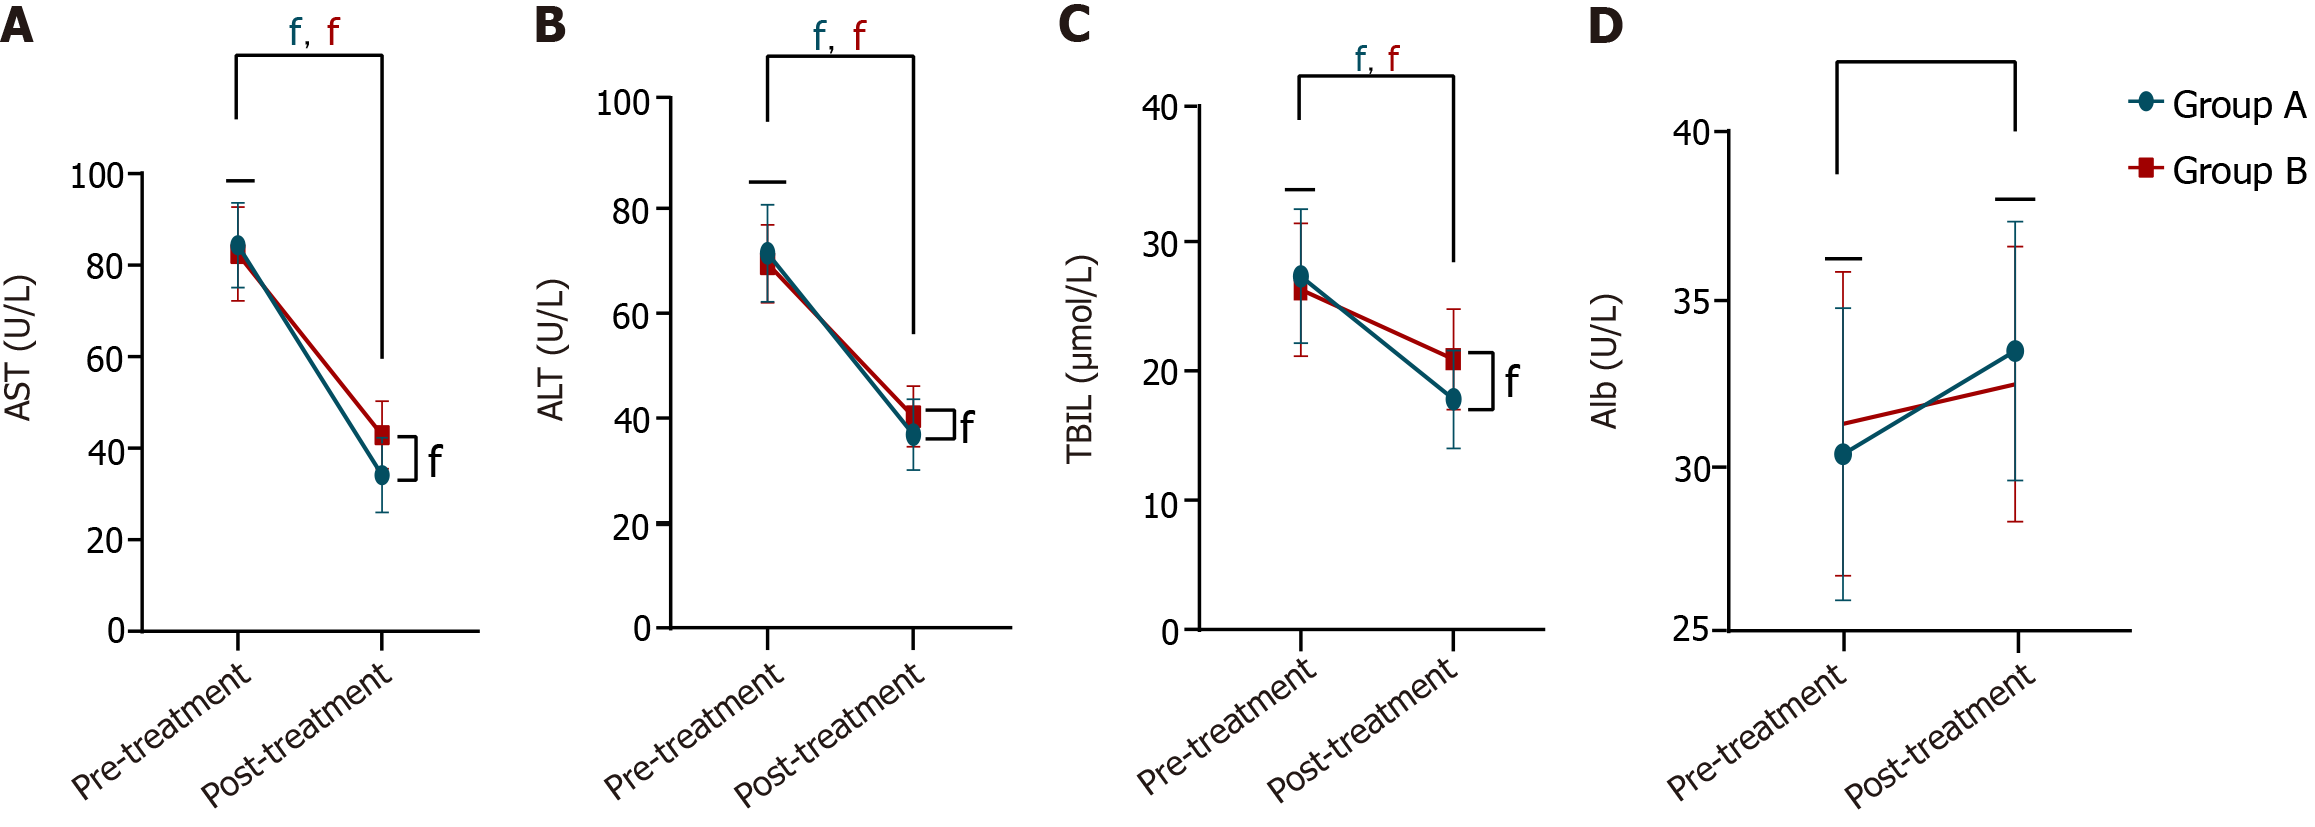
Figure 1 Comparison of liver function indices between the two groups.
A: Comparison of aspartate aminotransferase levels between the two groups; B: Comparison of alanine aminotransferase levels between the two groups; C: Comparison of total bilirubin levels between the two groups; D: Comparison of albumin levels between the two groups. AST: Aspartate aminotransferase; ALT: Alanine aminotransferase; TBIL: Total bilirubin; Alb: Albumin. fP < 0.000001.
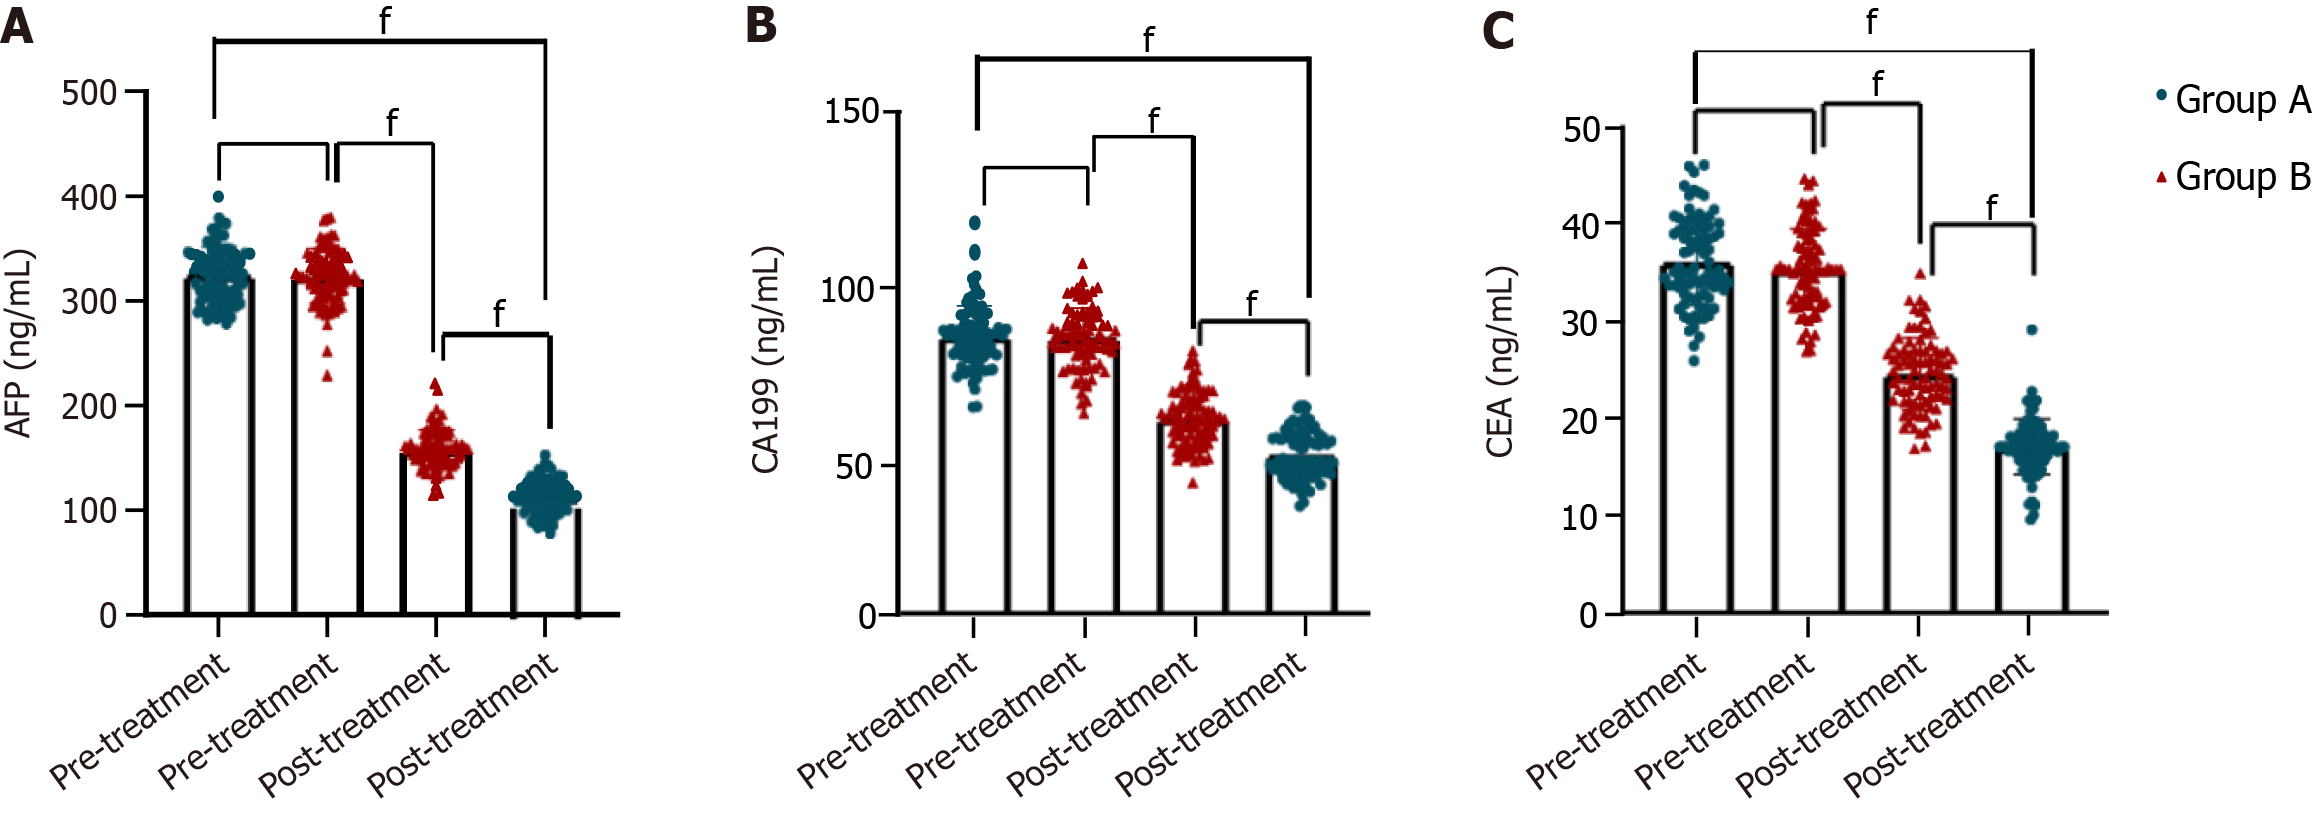
Figure 2 Comparison of the levels of serum tumor markers between the two groups.
A: Comparison of alpha-fetoprotein levels between the two groups; B: Comparison of carbohydrate antigen-199 levels between the two groups; C: Comparison of carcinoembryonic antigen levels between the two groups. AFP: Alpha-fetoprotein; CA199: Carbohydrate antigen-199; CEA: Carcinoembryonic antigen. fP < 0.000001.
- Citation: Cheng XB, Yang L, Lu MQ, Peng YB, Wang L, Zhu SM, Hu ZW, Wang ZL, Yang Q. Clinical study of different interventional treatments for primary hepatocellular carcinoma based on propensity-score matching. World J Gastrointest Surg 2024; 16(11): 3463-3470
- URL: https://www.wjgnet.com/1948-9366/full/v16/i11/3463.htm
- DOI: https://dx.doi.org/10.4240/wjgs.v16.i11.3463


