Copyright
©The Author(s) 2024.
World J Gastrointest Surg. Jan 27, 2024; 16(1): 205-214
Published online Jan 27, 2024. doi: 10.4240/wjgs.v16.i1.205
Published online Jan 27, 2024. doi: 10.4240/wjgs.v16.i1.205
Figure 1 Forest plot diagram of heterogeneity analysis.
A and B: Forest plot in direct comparisons for evaluation of overall survival (A) and disease-free survival (B). 1: Stereotactic body radiation therapy; 2: Intensity-modulated radiation therapy 3D; 3: 3-dimensional conformal radiation therapy; 4: Surgery.
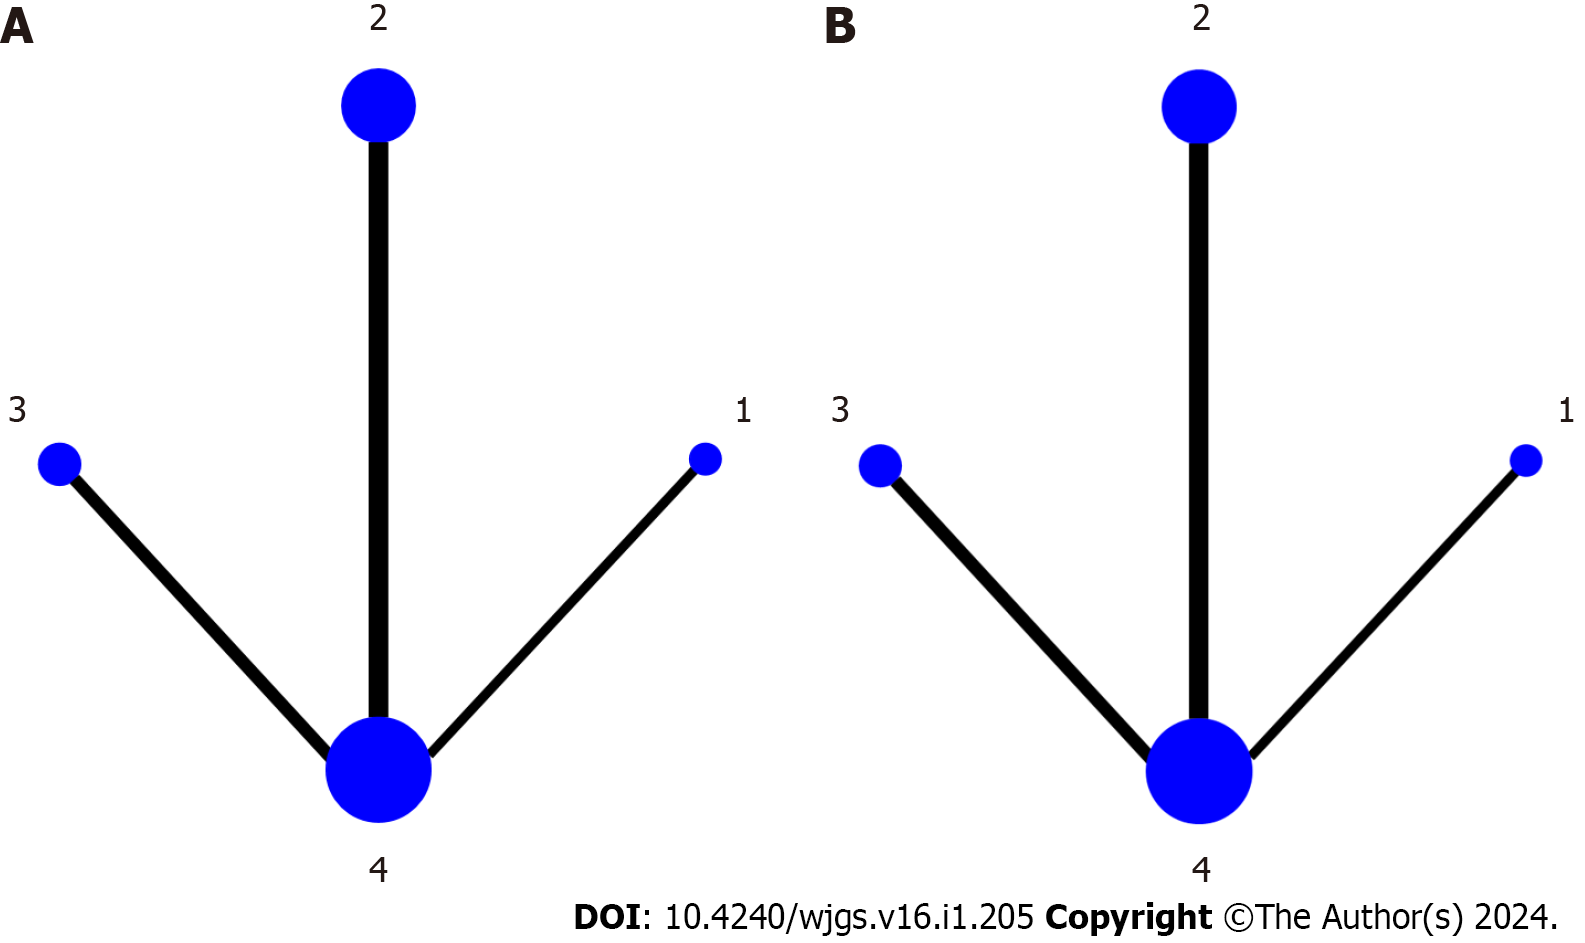
Figure 2 Network diagram of the four kinds of therapies in the treatment of hepatocellular carcinoma.
A and B: Network geometry of all the included radiotherapy methods for overall survival (A) and disease-free survival (B). 1: Stereotactic body radiation therapy; 2: Intensity-modulated radiation therapy 3D; 3: 3-dimensional conformal radiation therapy; 4: Surgery.
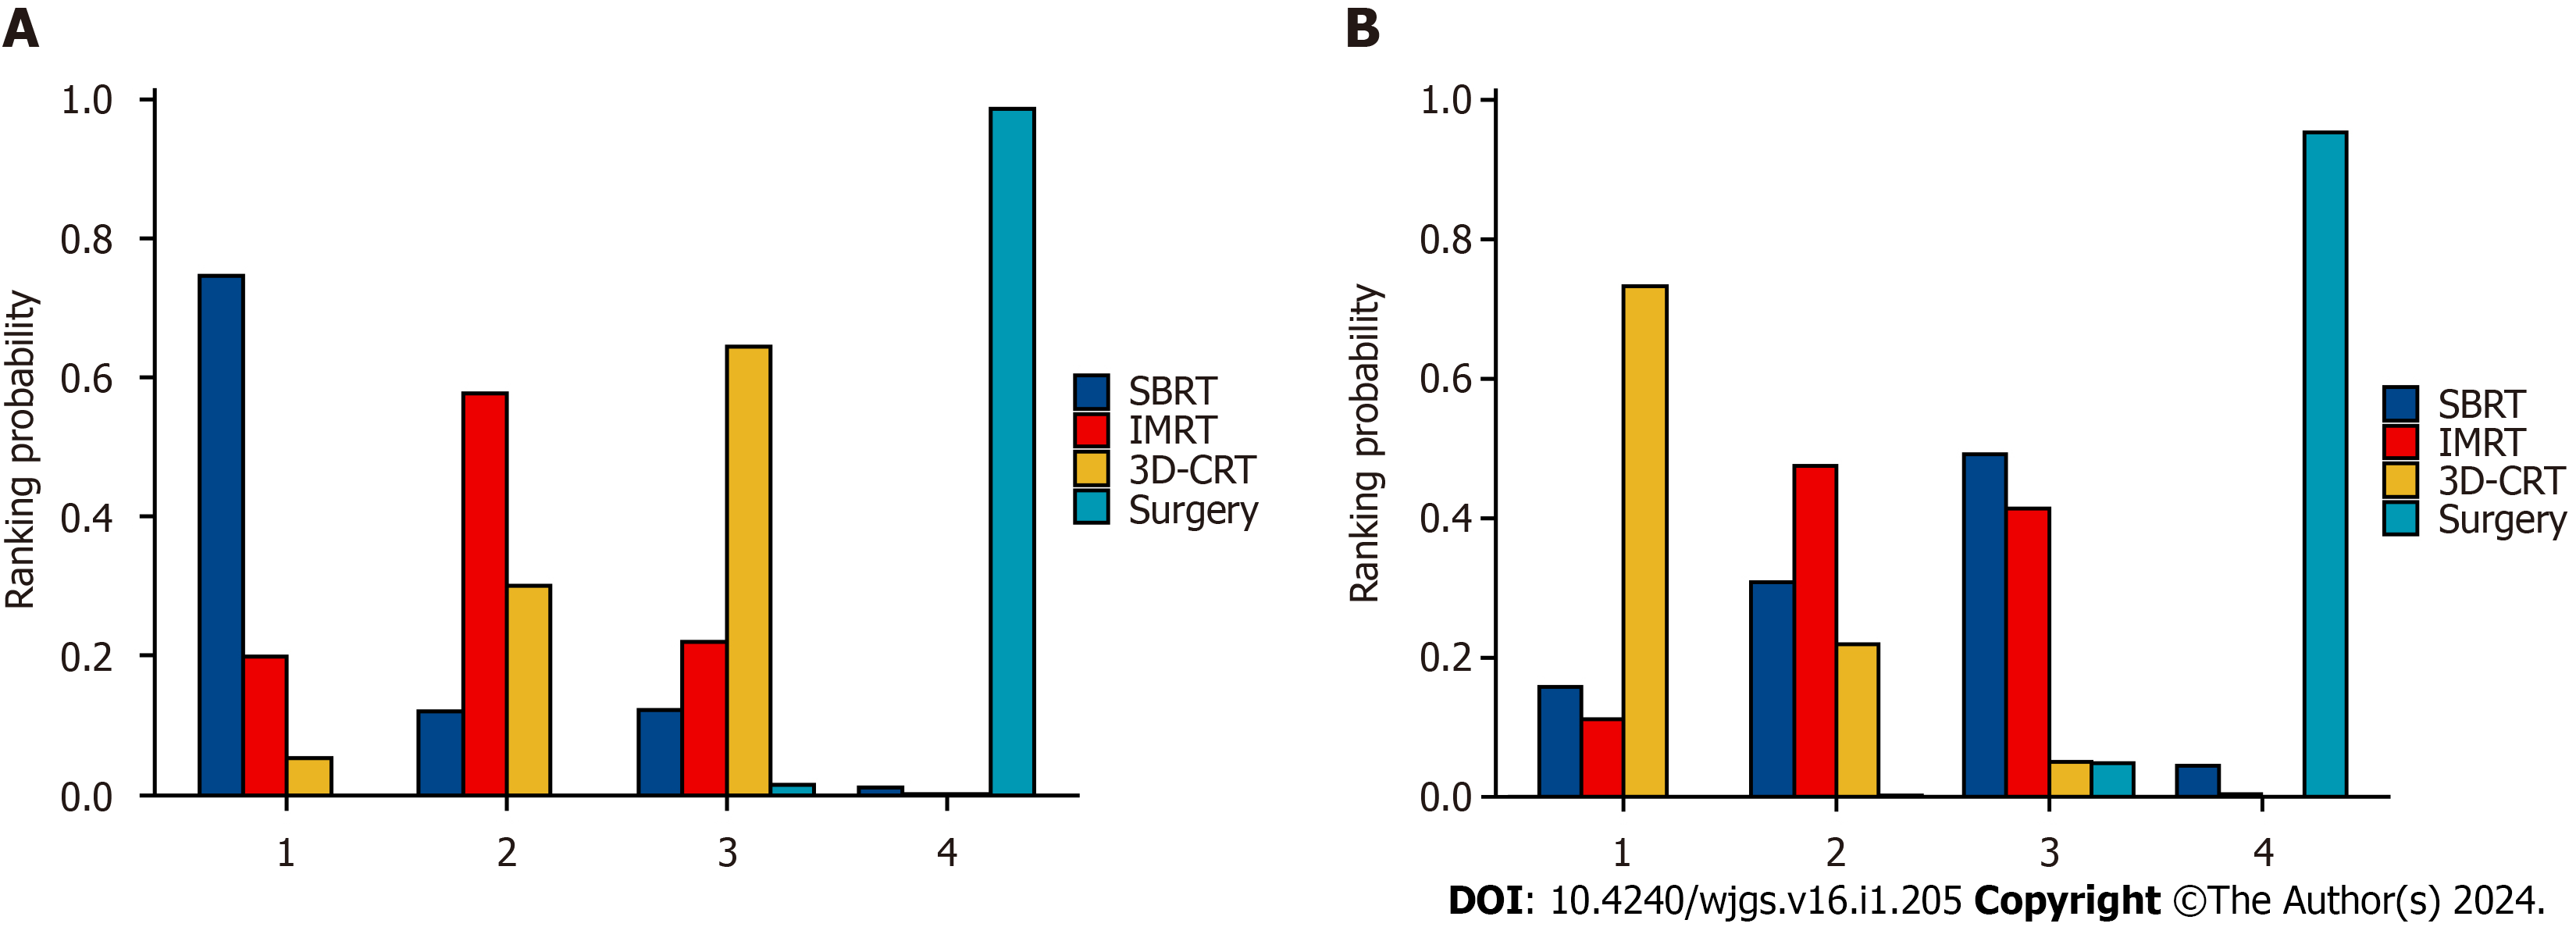
Figure 3 Probability ranking diagram of each outcome indicator.
A and B: Ranking probability histogram of different interventions for overall survival (A) and disease-free survival (B). SBRT: Stereotactic body radiation therapy; IMRT: Intensity-modulated radiation therapy; 3D-CRT: 3-dimensional conformal radiation therapy.
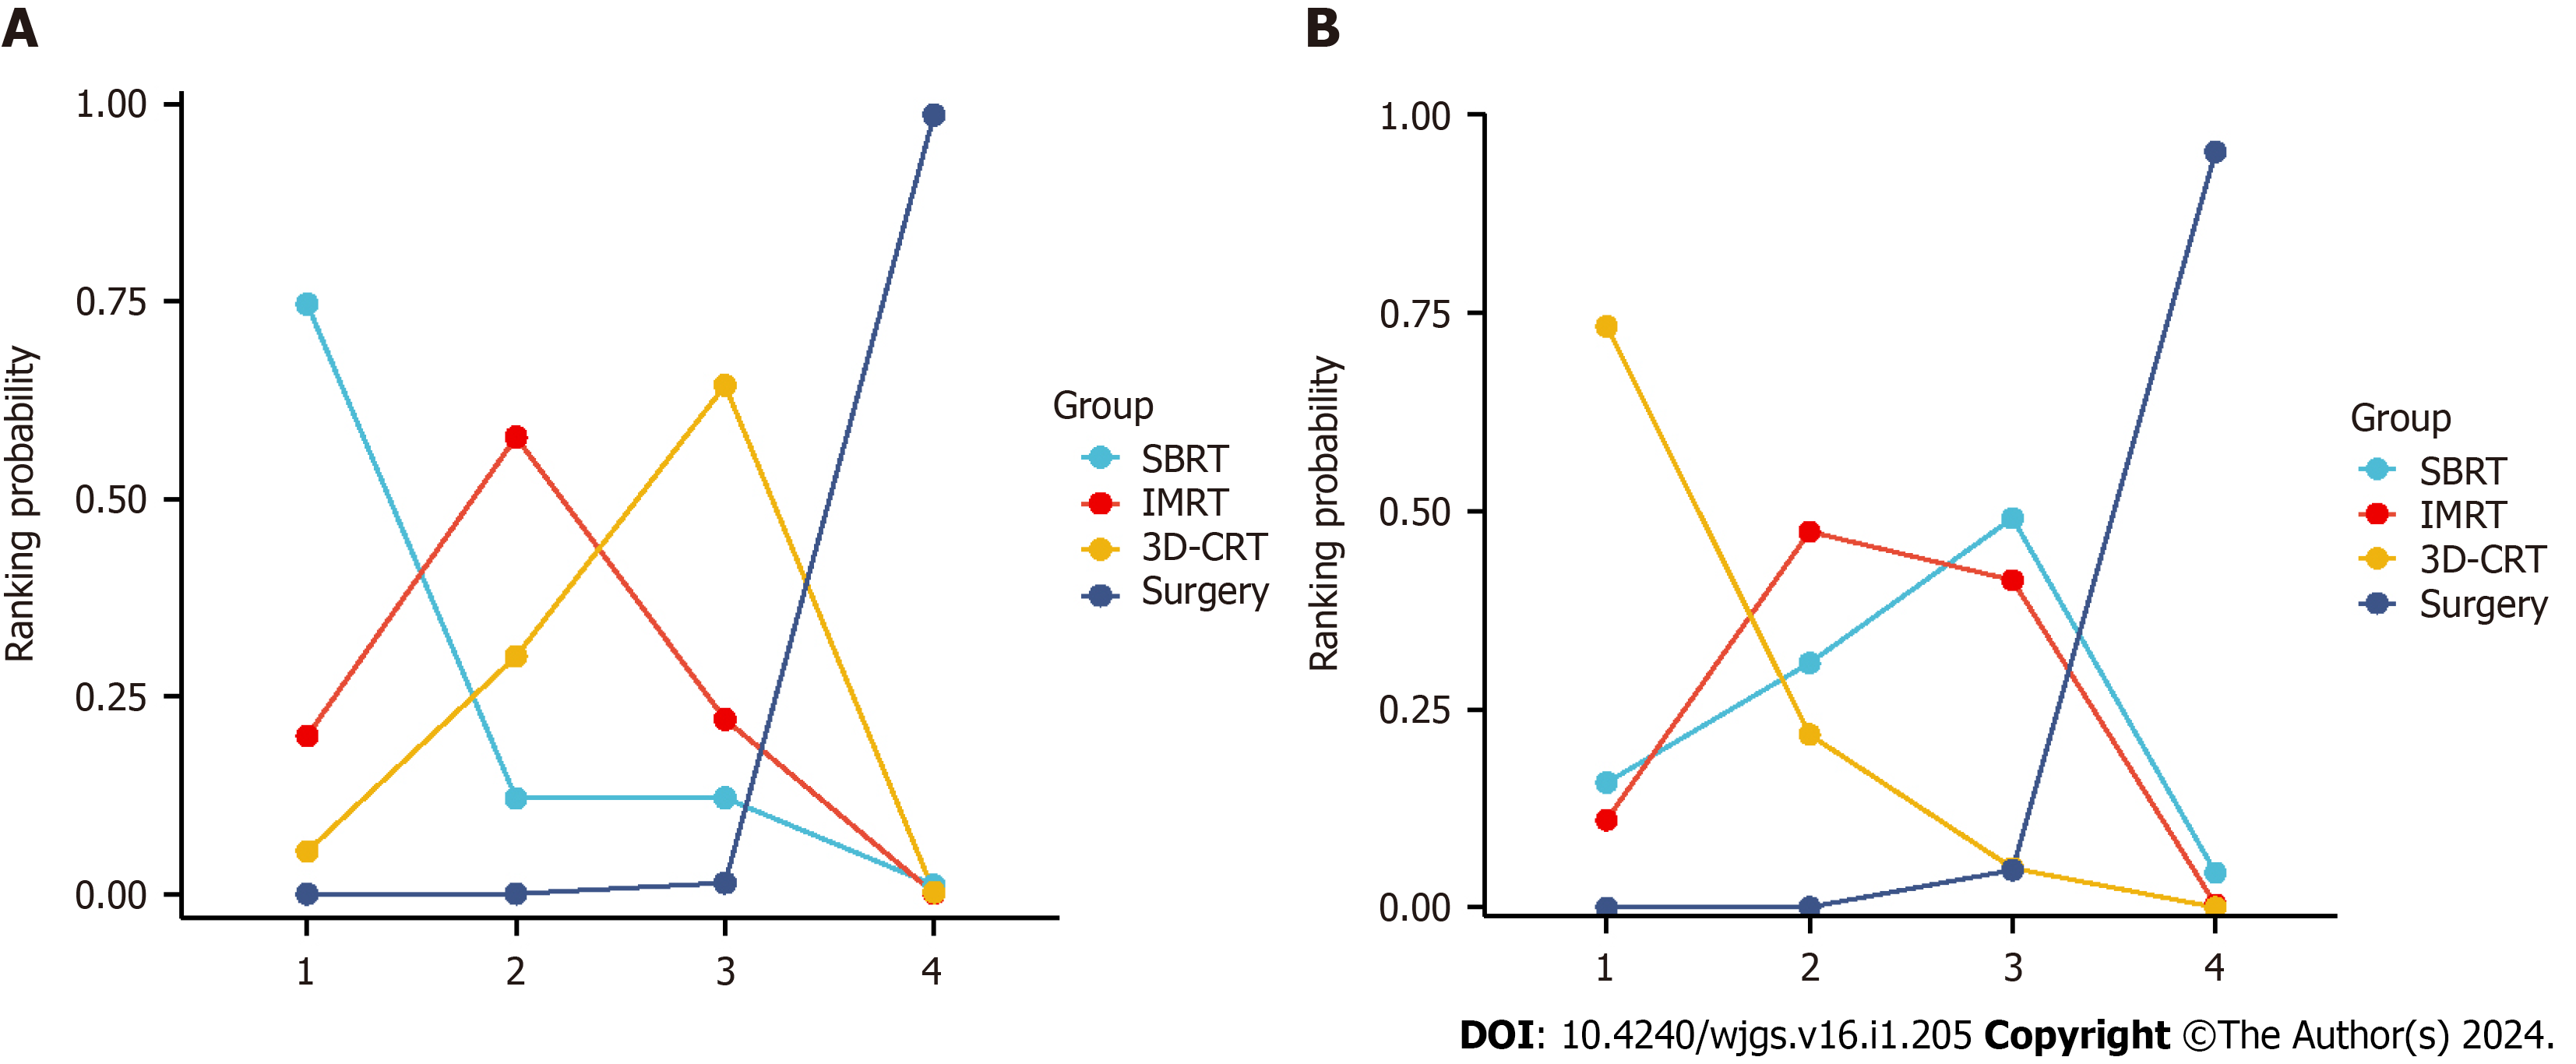
Figure 4 Area under the cumulative ranking curve.
A and B: Cumulative ranking curve of different interventions for overall survival (A) and disease-free survival (B). SBRT: Stereotactic body radiation therapy; IMRT: Intensity-modulated radiation therapy; 3D-CRT: 3-dimensional conformal radiation therapy.
- Citation: Yang GY, He ZW, Tang YC, Yuan F, Cao MB, Ren YP, Li YX, Su XR, Yao ZC, Deng MH. Unraveling the efficacy network: A network meta-analysis of adjuvant external beam radiation therapy methods after hepatectomy. World J Gastrointest Surg 2024; 16(1): 205-214
- URL: https://www.wjgnet.com/1948-9366/full/v16/i1/205.htm
- DOI: https://dx.doi.org/10.4240/wjgs.v16.i1.205


