Copyright
©The Author(s) 2023.
World J Gastrointest Surg. Sep 27, 2023; 15(9): 2042-2051
Published online Sep 27, 2023. doi: 10.4240/wjgs.v15.i9.2042
Published online Sep 27, 2023. doi: 10.4240/wjgs.v15.i9.2042
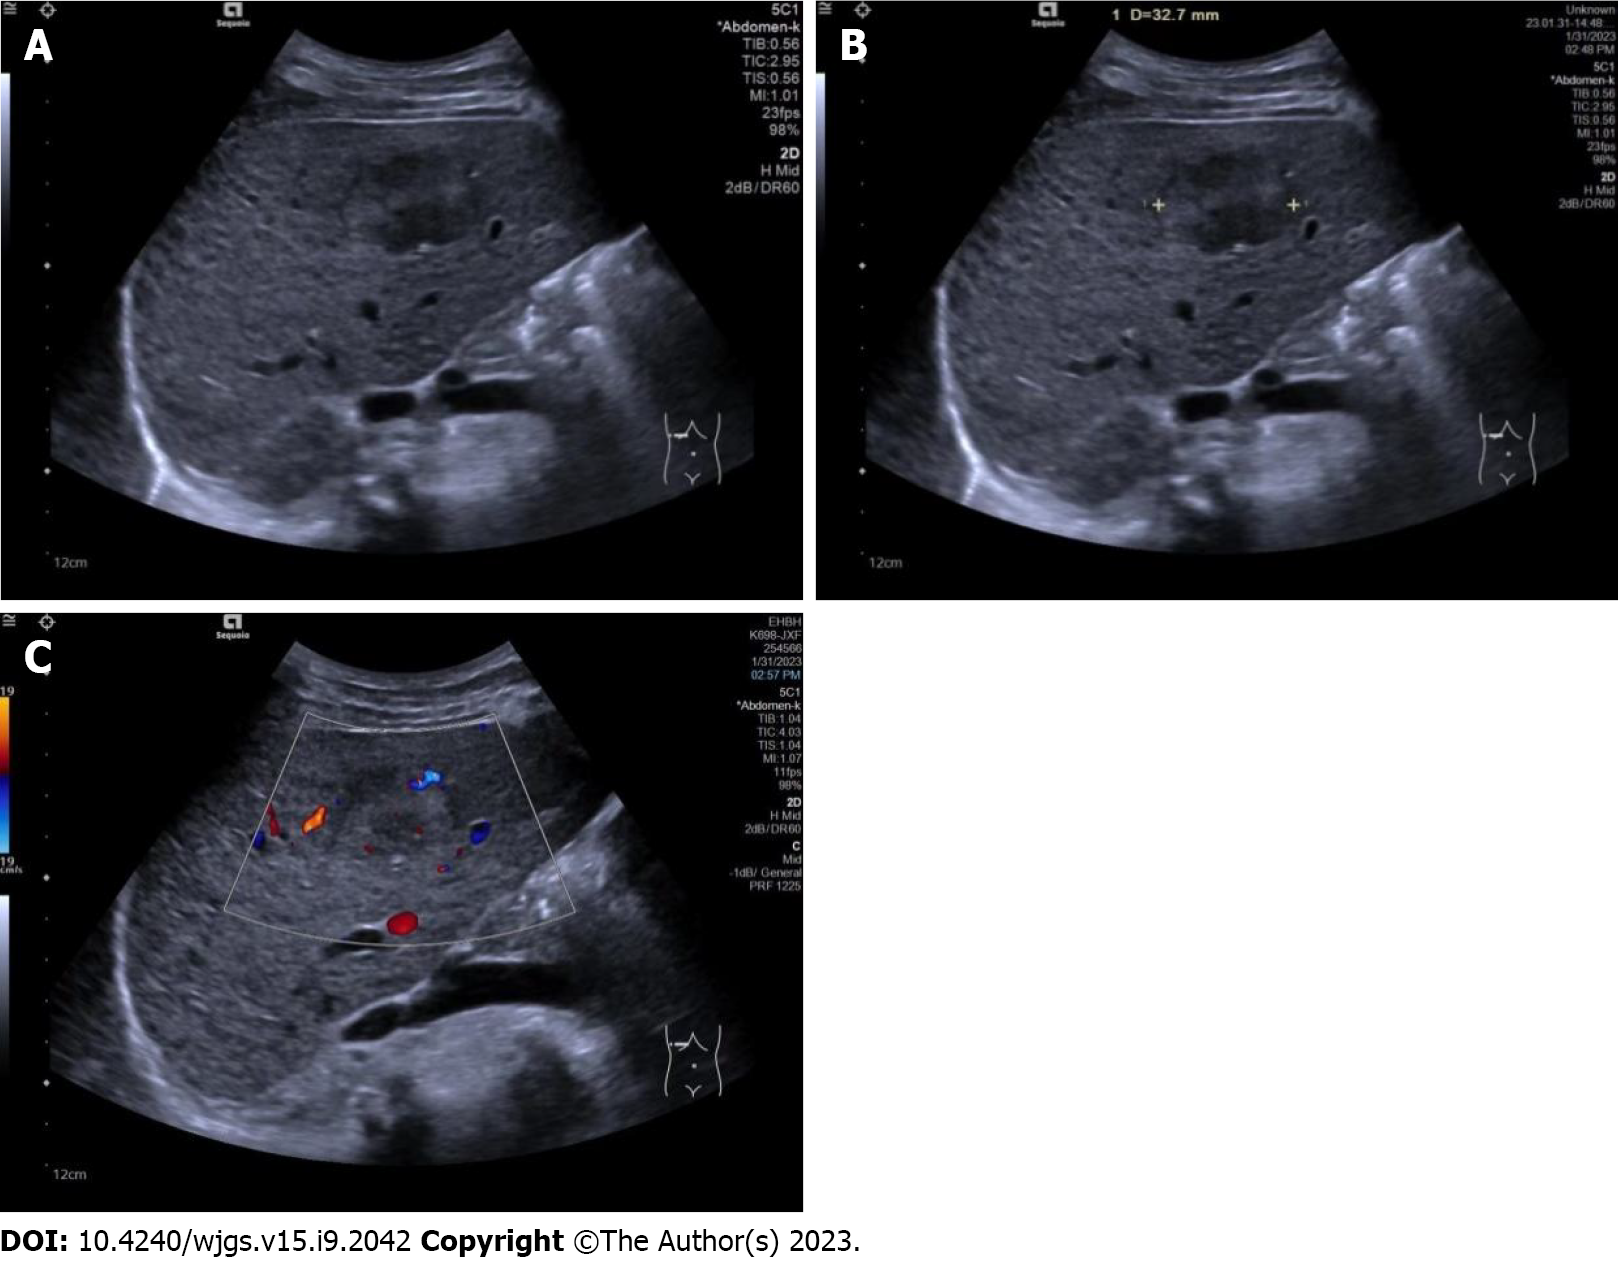
Figure 1 Conventional ultrasound images in patients with a hepatic tumor pathologically diagnosed as hepatocellular carcinoma.
A: Conventional ultrasound showed the tumor to be hypoechoic with an unclear boundary and cirrhosis in the surrounding liver tissue; B: Conventional ultrasound measured the maximal diameter of the tumor to be 32.7 mm; C: Color Doppler flow imaging showed one vessel in the tumor, and microvascular invasion was recorded as mild.
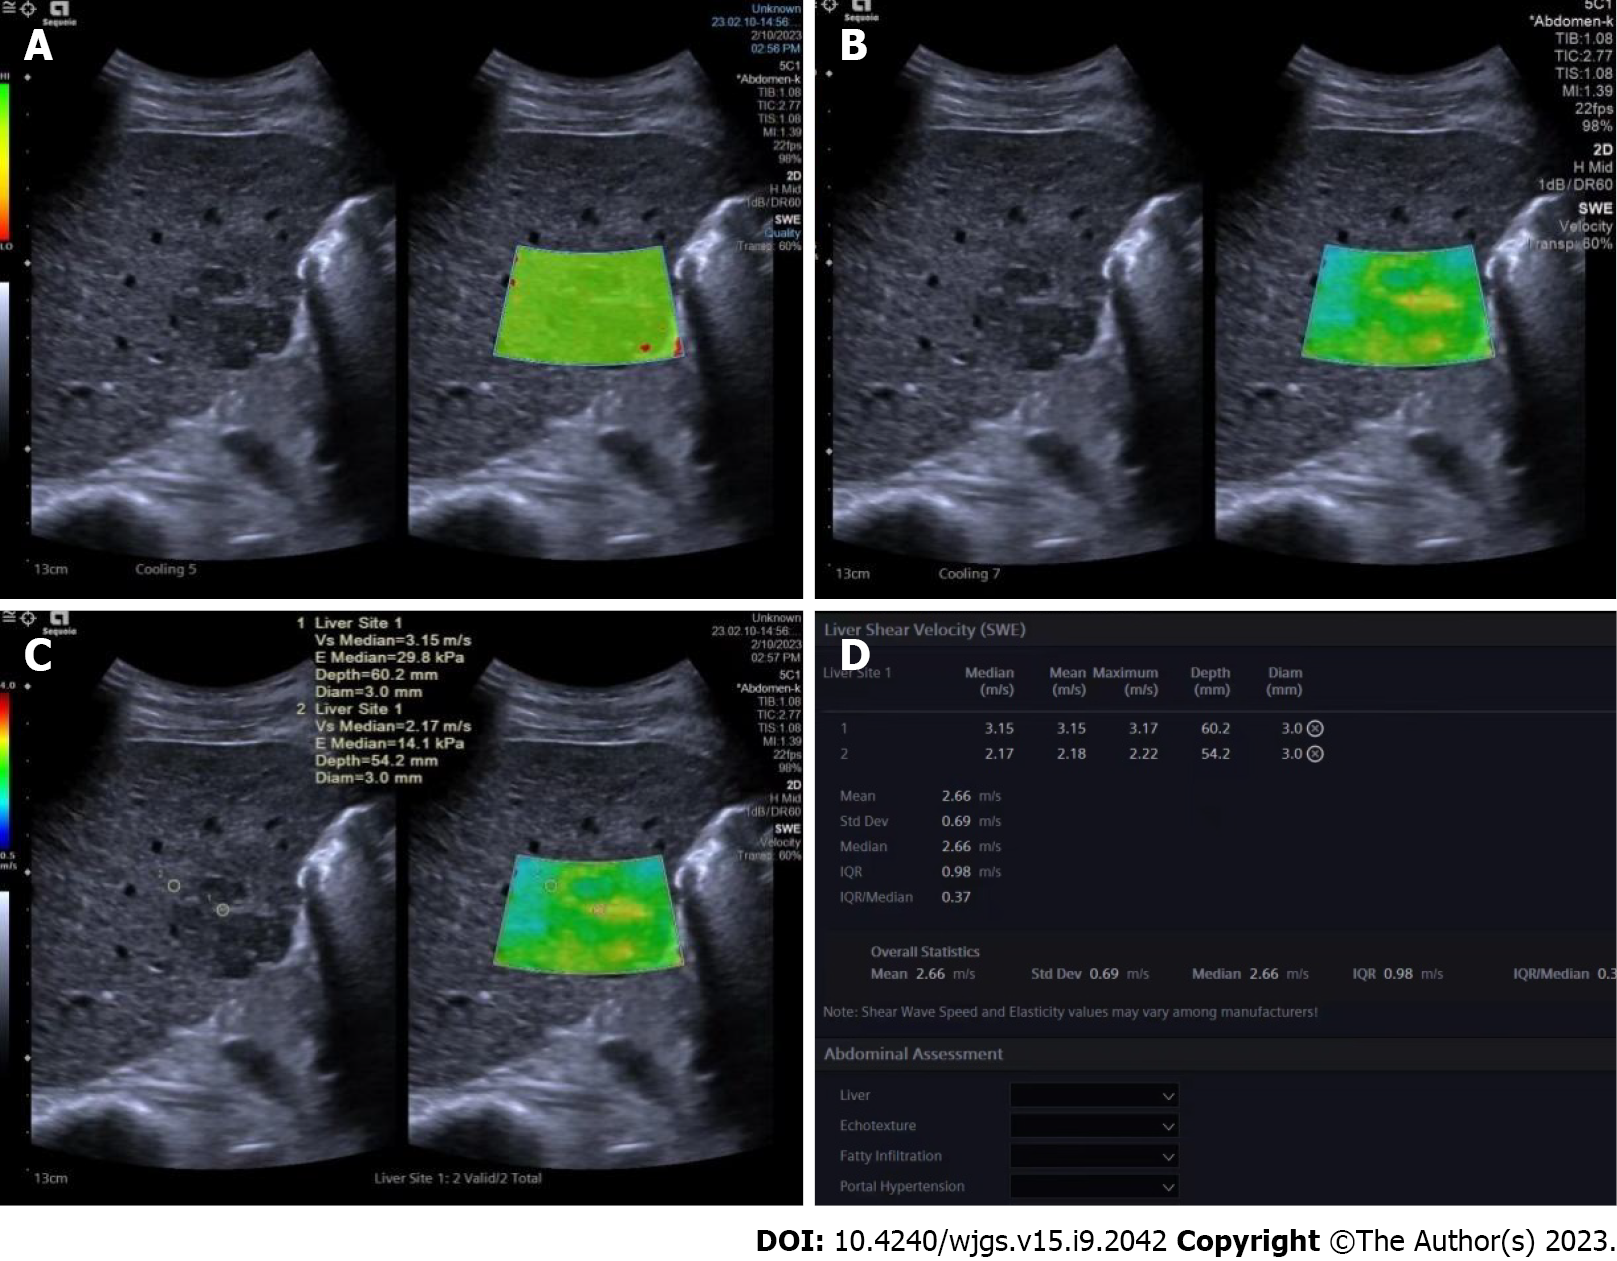
Figure 2 Shear wave elastography images in a pathologically confirmed hepatocellular carcinoma.
A: Quality mode showed hepatocellular carcinoma (HCC) as green, indicating that the 2D-shear wave elastography image was of good quality; B: Velocity mode showed that the HCC was stiffer than the surrounding liver tissue. The speed barb was set as 0.5-4.0 m/s; C: Two circular regions of interest (with a diameter of 3 mm) were placed at the stiffest part of the HCC and at the periphery of the HCC; D: Maximal values of the two regions of interest were recorded as maximal elasticity.
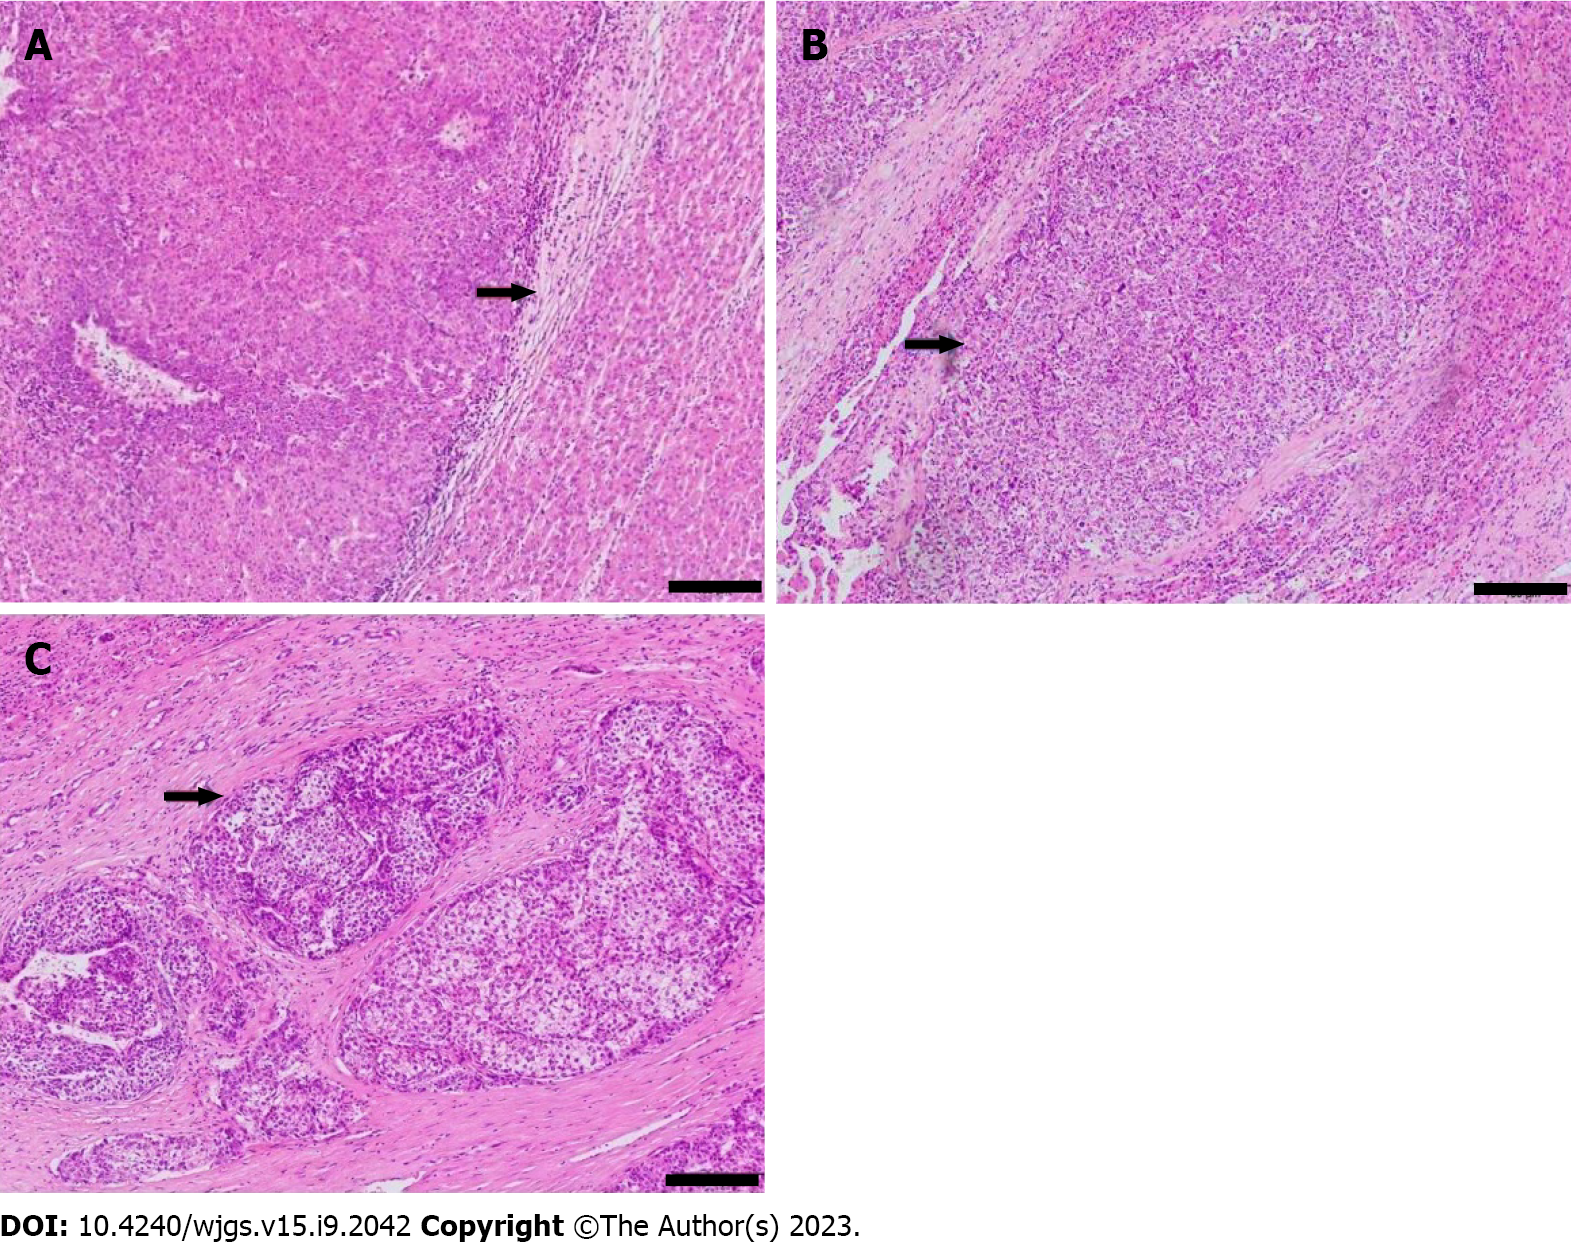
Figure 3 Pathological images showed microvascular invasion in hepatocellular carcinoma.
Hematoxylin and eosin stain, magnification: × 100. A: No microvascular invasion (MVI) detected, recorded as MVI-negative; B: One MVI detected, recorded as mild MVI; C: More than 5 MVIs detected, recorded as severe MVI. Scale bar: 100 μm.
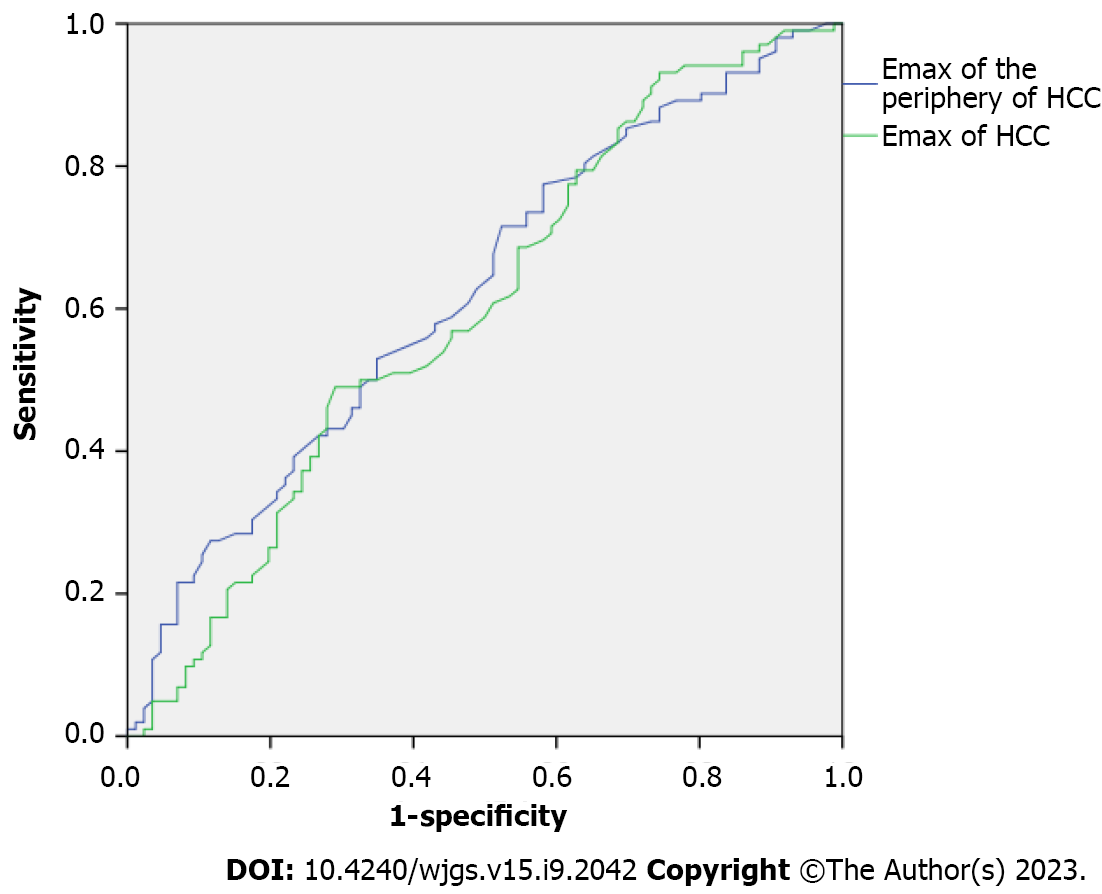
Figure 4 Receiver operating characteristic curve for maximal elasticity of the periphery of the hepatocellular carcinoma and maximal elasticity of the hepatocellular carcinoma.
Emax: Maximal elasticity; HCC: Hepatocellular carcinoma.
- Citation: Jiang D, Qian Y, Tan BB, Zhu XL, Dong H, Qian R. Preoperative prediction of microvascular invasion in hepatocellular carcinoma using ultrasound features including elasticity. World J Gastrointest Surg 2023; 15(9): 2042-2051
- URL: https://www.wjgnet.com/1948-9366/full/v15/i9/2042.htm
- DOI: https://dx.doi.org/10.4240/wjgs.v15.i9.2042


