©The Author(s) 2021.
World J Gastrointest Surg. May 27, 2021; 13(5): 507-515
Published online May 27, 2021. doi: 10.4240/wjgs.v13.i5.507
Published online May 27, 2021. doi: 10.4240/wjgs.v13.i5.507
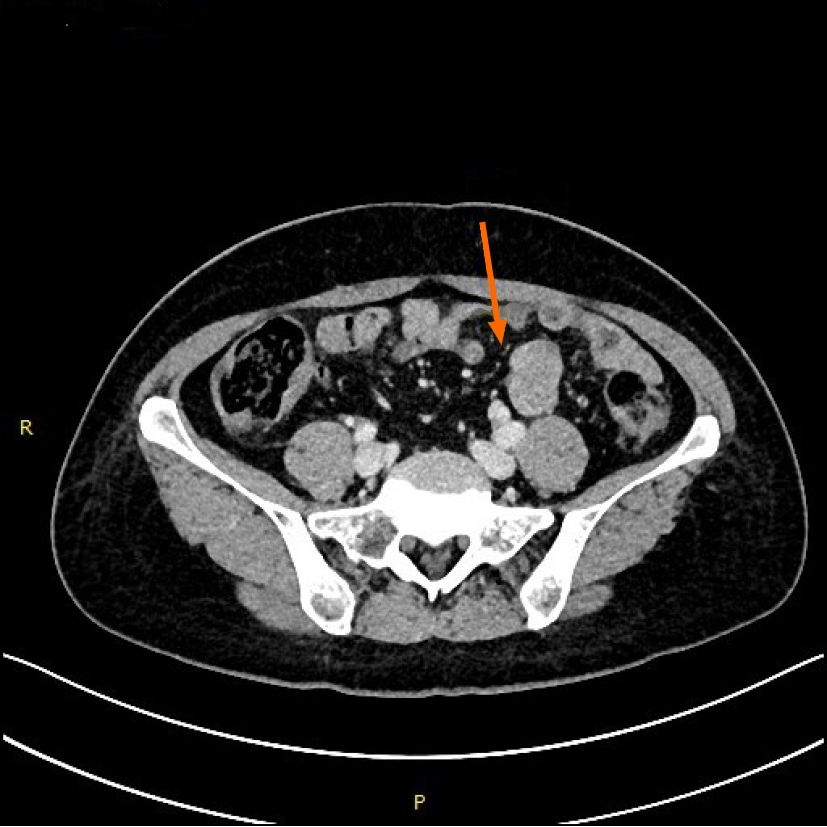
Figure 1 Transverse spiral computed tomography scan of the abdomen, with intravenous contrast enhancement showing dilation of jejunal wall of the left lower quadrant.
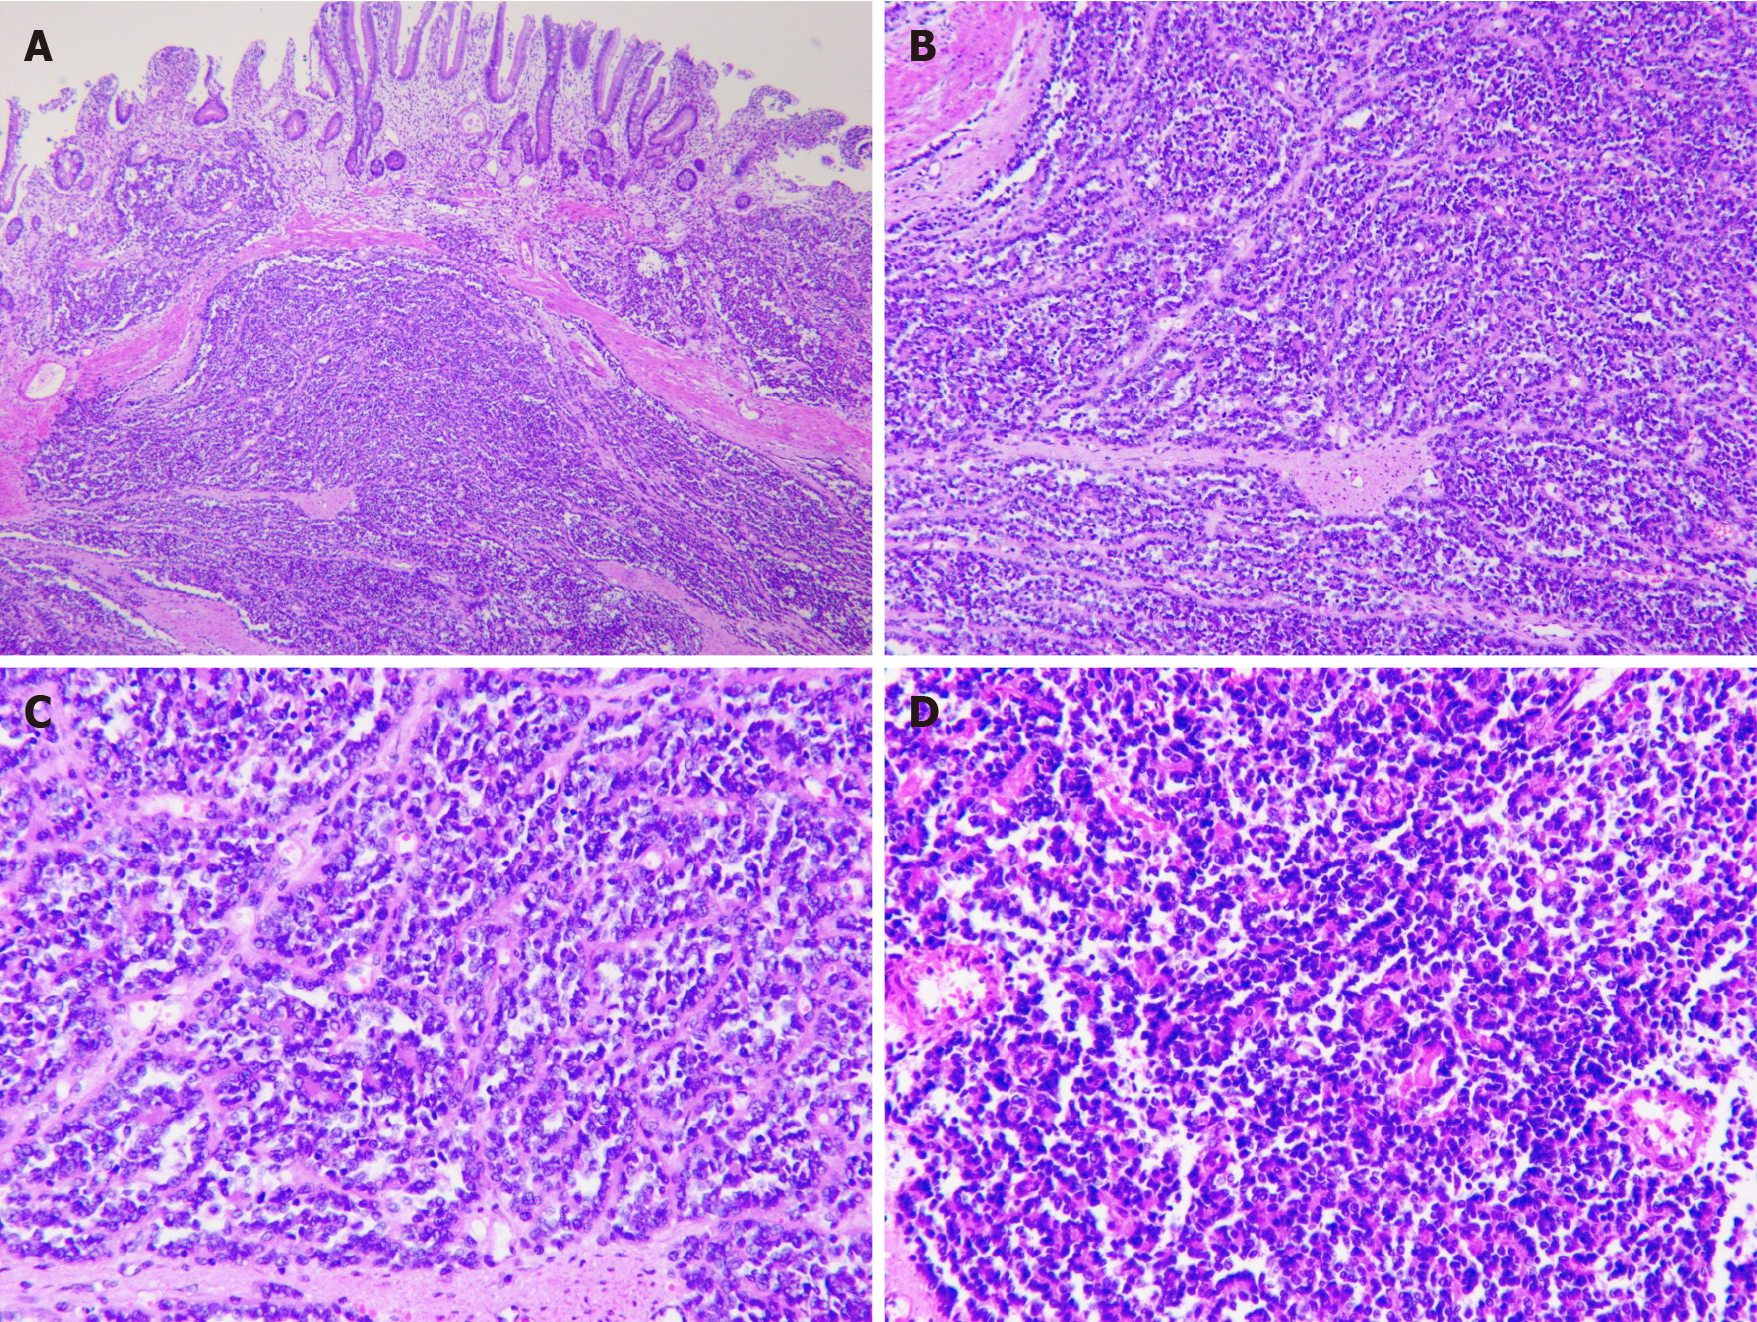
Figure 2 Immunohistochemical analysis.
A: Low magnification of the resected sample using formalin-fixed (magnification: × 40); B: Paraffin-embedded sections of tumor stained with hematoxylin and eosin demonstrating sheets of small (magnification: × 100); C: Round-to-spindle, uniform tumor cells with clear cytoplasm (magnification: × 200); D: Higher magnification of C (magnification: × 200).
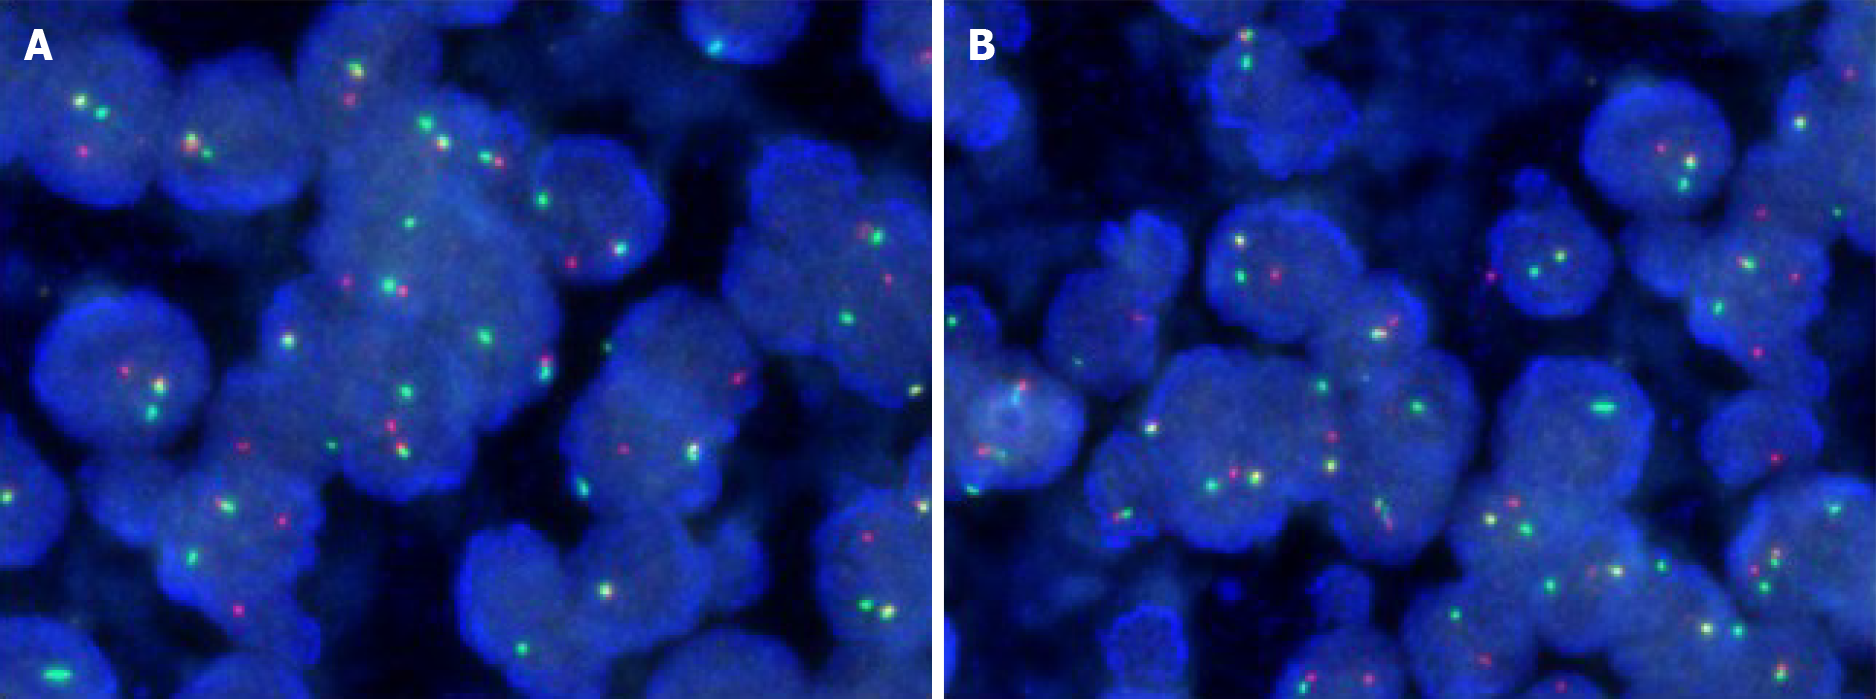
Figure 3 Fluorescence in situ hybridization.
A: Fluorescence in situ hybridization of the resected tumor showing more than 10% of the cells showed a red-green-yellow signal, proving the breakpoint rearrangement of the Ewing Sarcoma breakpoint region 1 gene; B: More than 10% of the cells from resected sample showing a red-green-yellow signal (magnification: × 200).
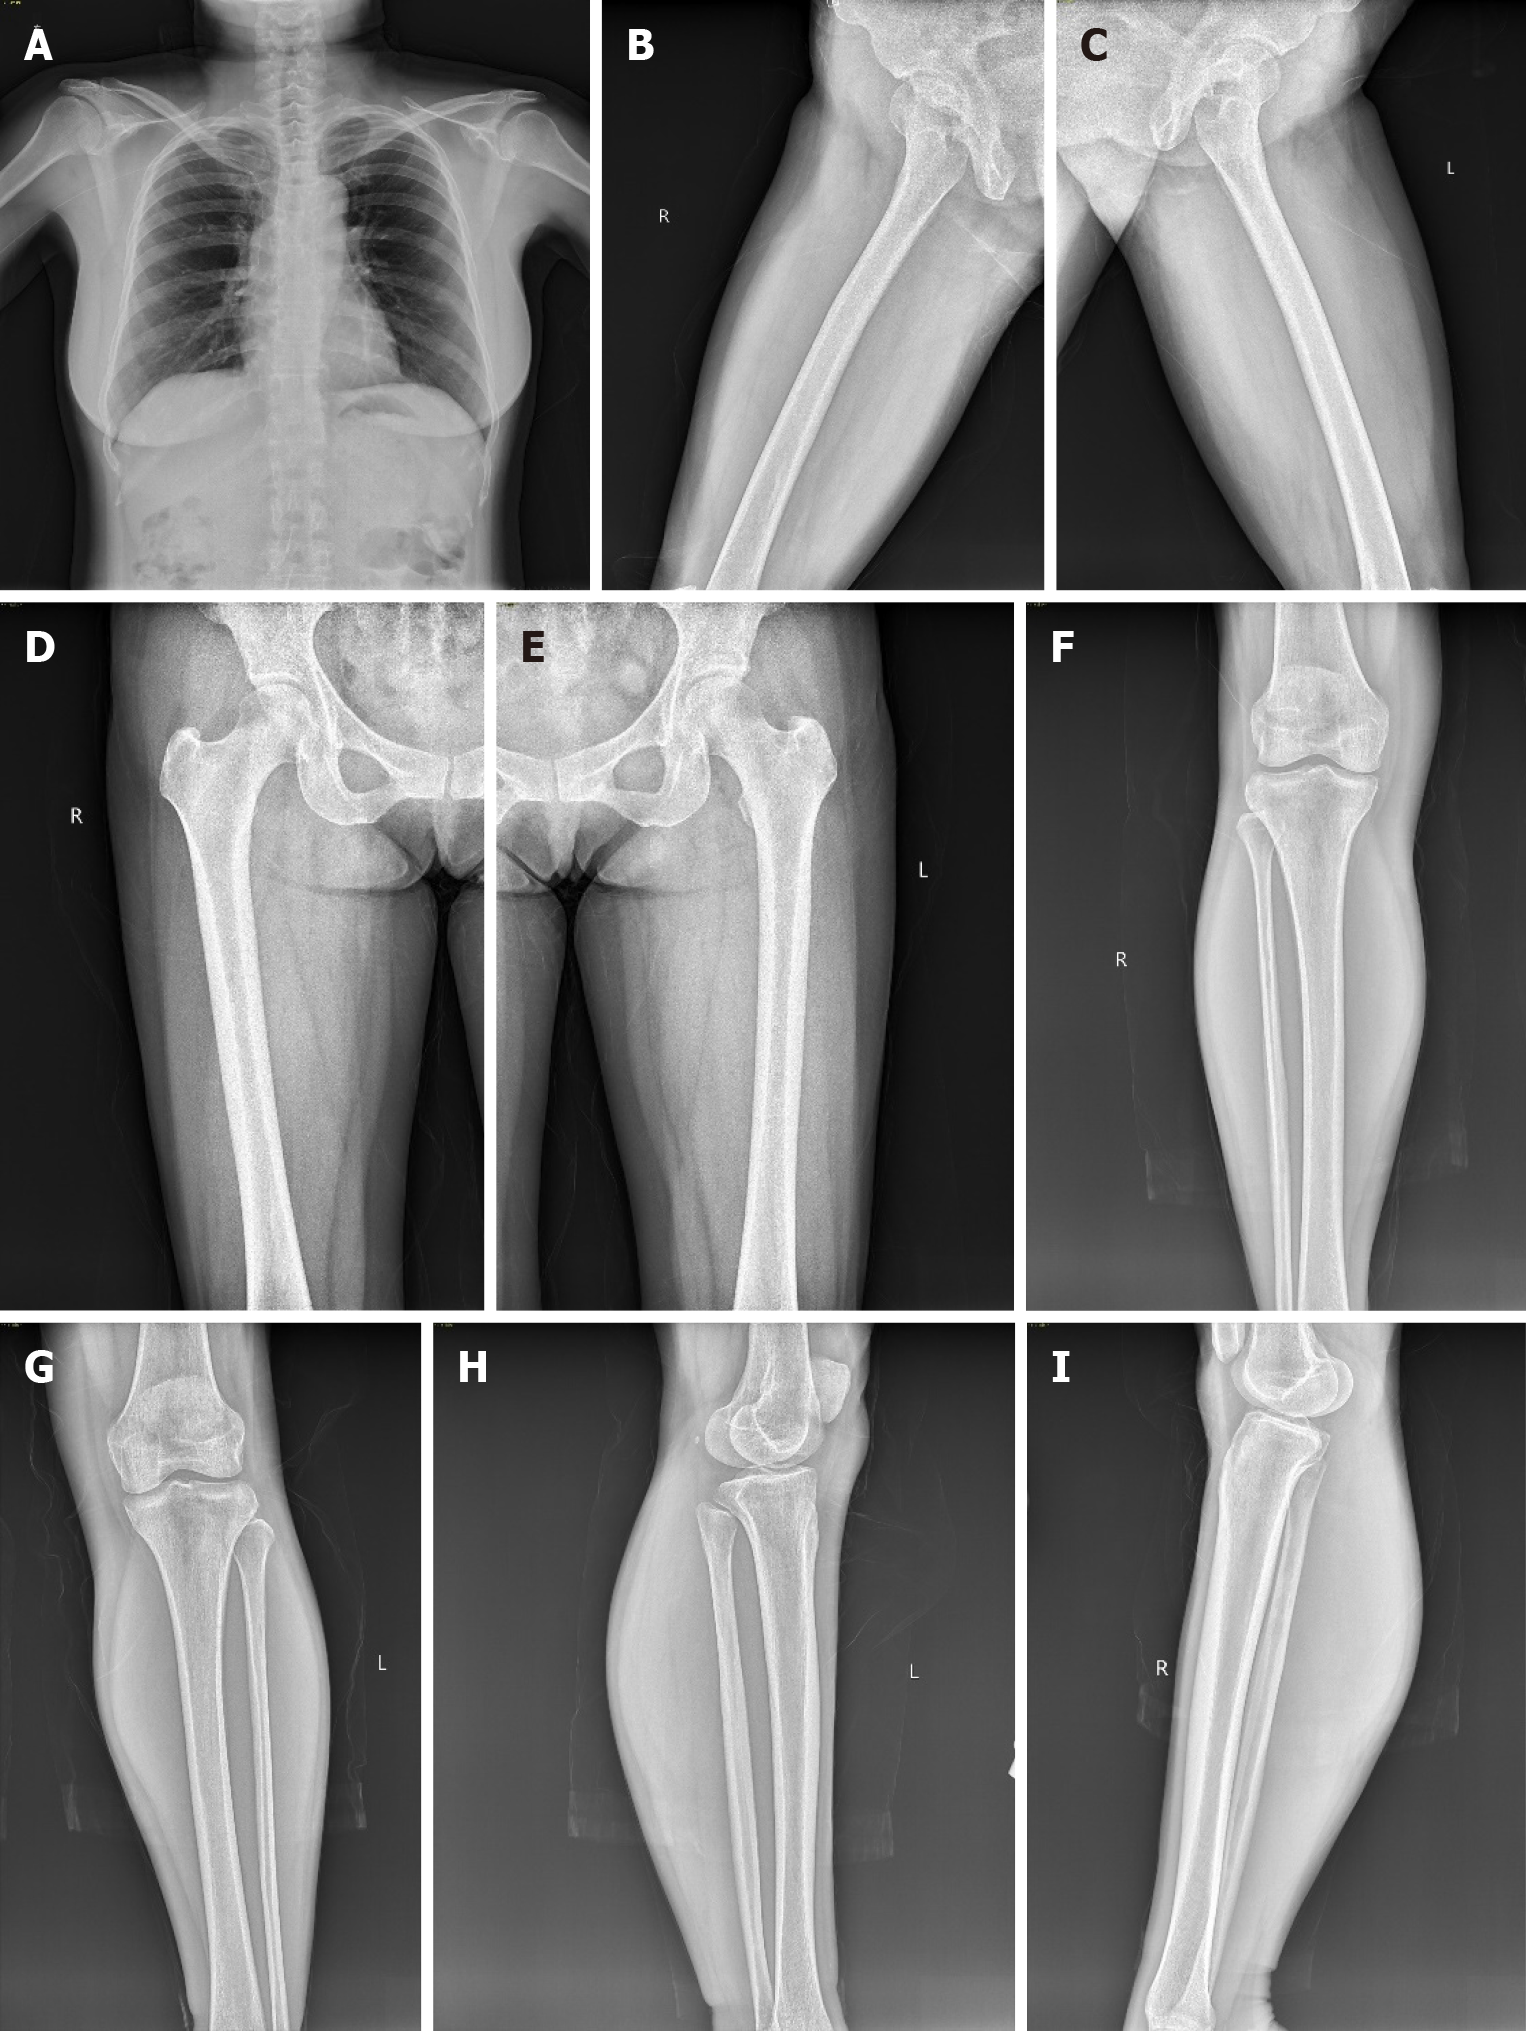
Figure 4 Post-operative bone X-ray which shows no lesion in skeletal system thereby excluding metastasis.
A: Anterior-posterior view of the chest; B: Posterior-anterior right upper thigh; C: Posterior-anterior left upper thigh; D: Anterior-posterior right upper thigh; E: Anterior-posterior left upper thigh; F: Anterior-posterior lower leg; G: Anterior-posterior lower leg; H: Medial-lateral lower leg; I: Medial-lateral lower leg.
- Citation: Shadhu K, Ramlagun-Mungur D, Ping XC. Ewing sarcoma of the jejunum: A case report and literature review . World J Gastrointest Surg 2021; 13(5): 507-515
- URL: https://www.wjgnet.com/1948-9366/full/v13/i5/507.htm
- DOI: https://dx.doi.org/10.4240/wjgs.v13.i5.507


