
















Copyright: ©Author(s) 2026.
World J Diabetes. Sep 15, 2026; 17(9): 123886
Published online Sep 15, 2026. doi: 10.4239/wjd.123886
Published online Sep 15, 2026. doi: 10.4239/wjd.123886
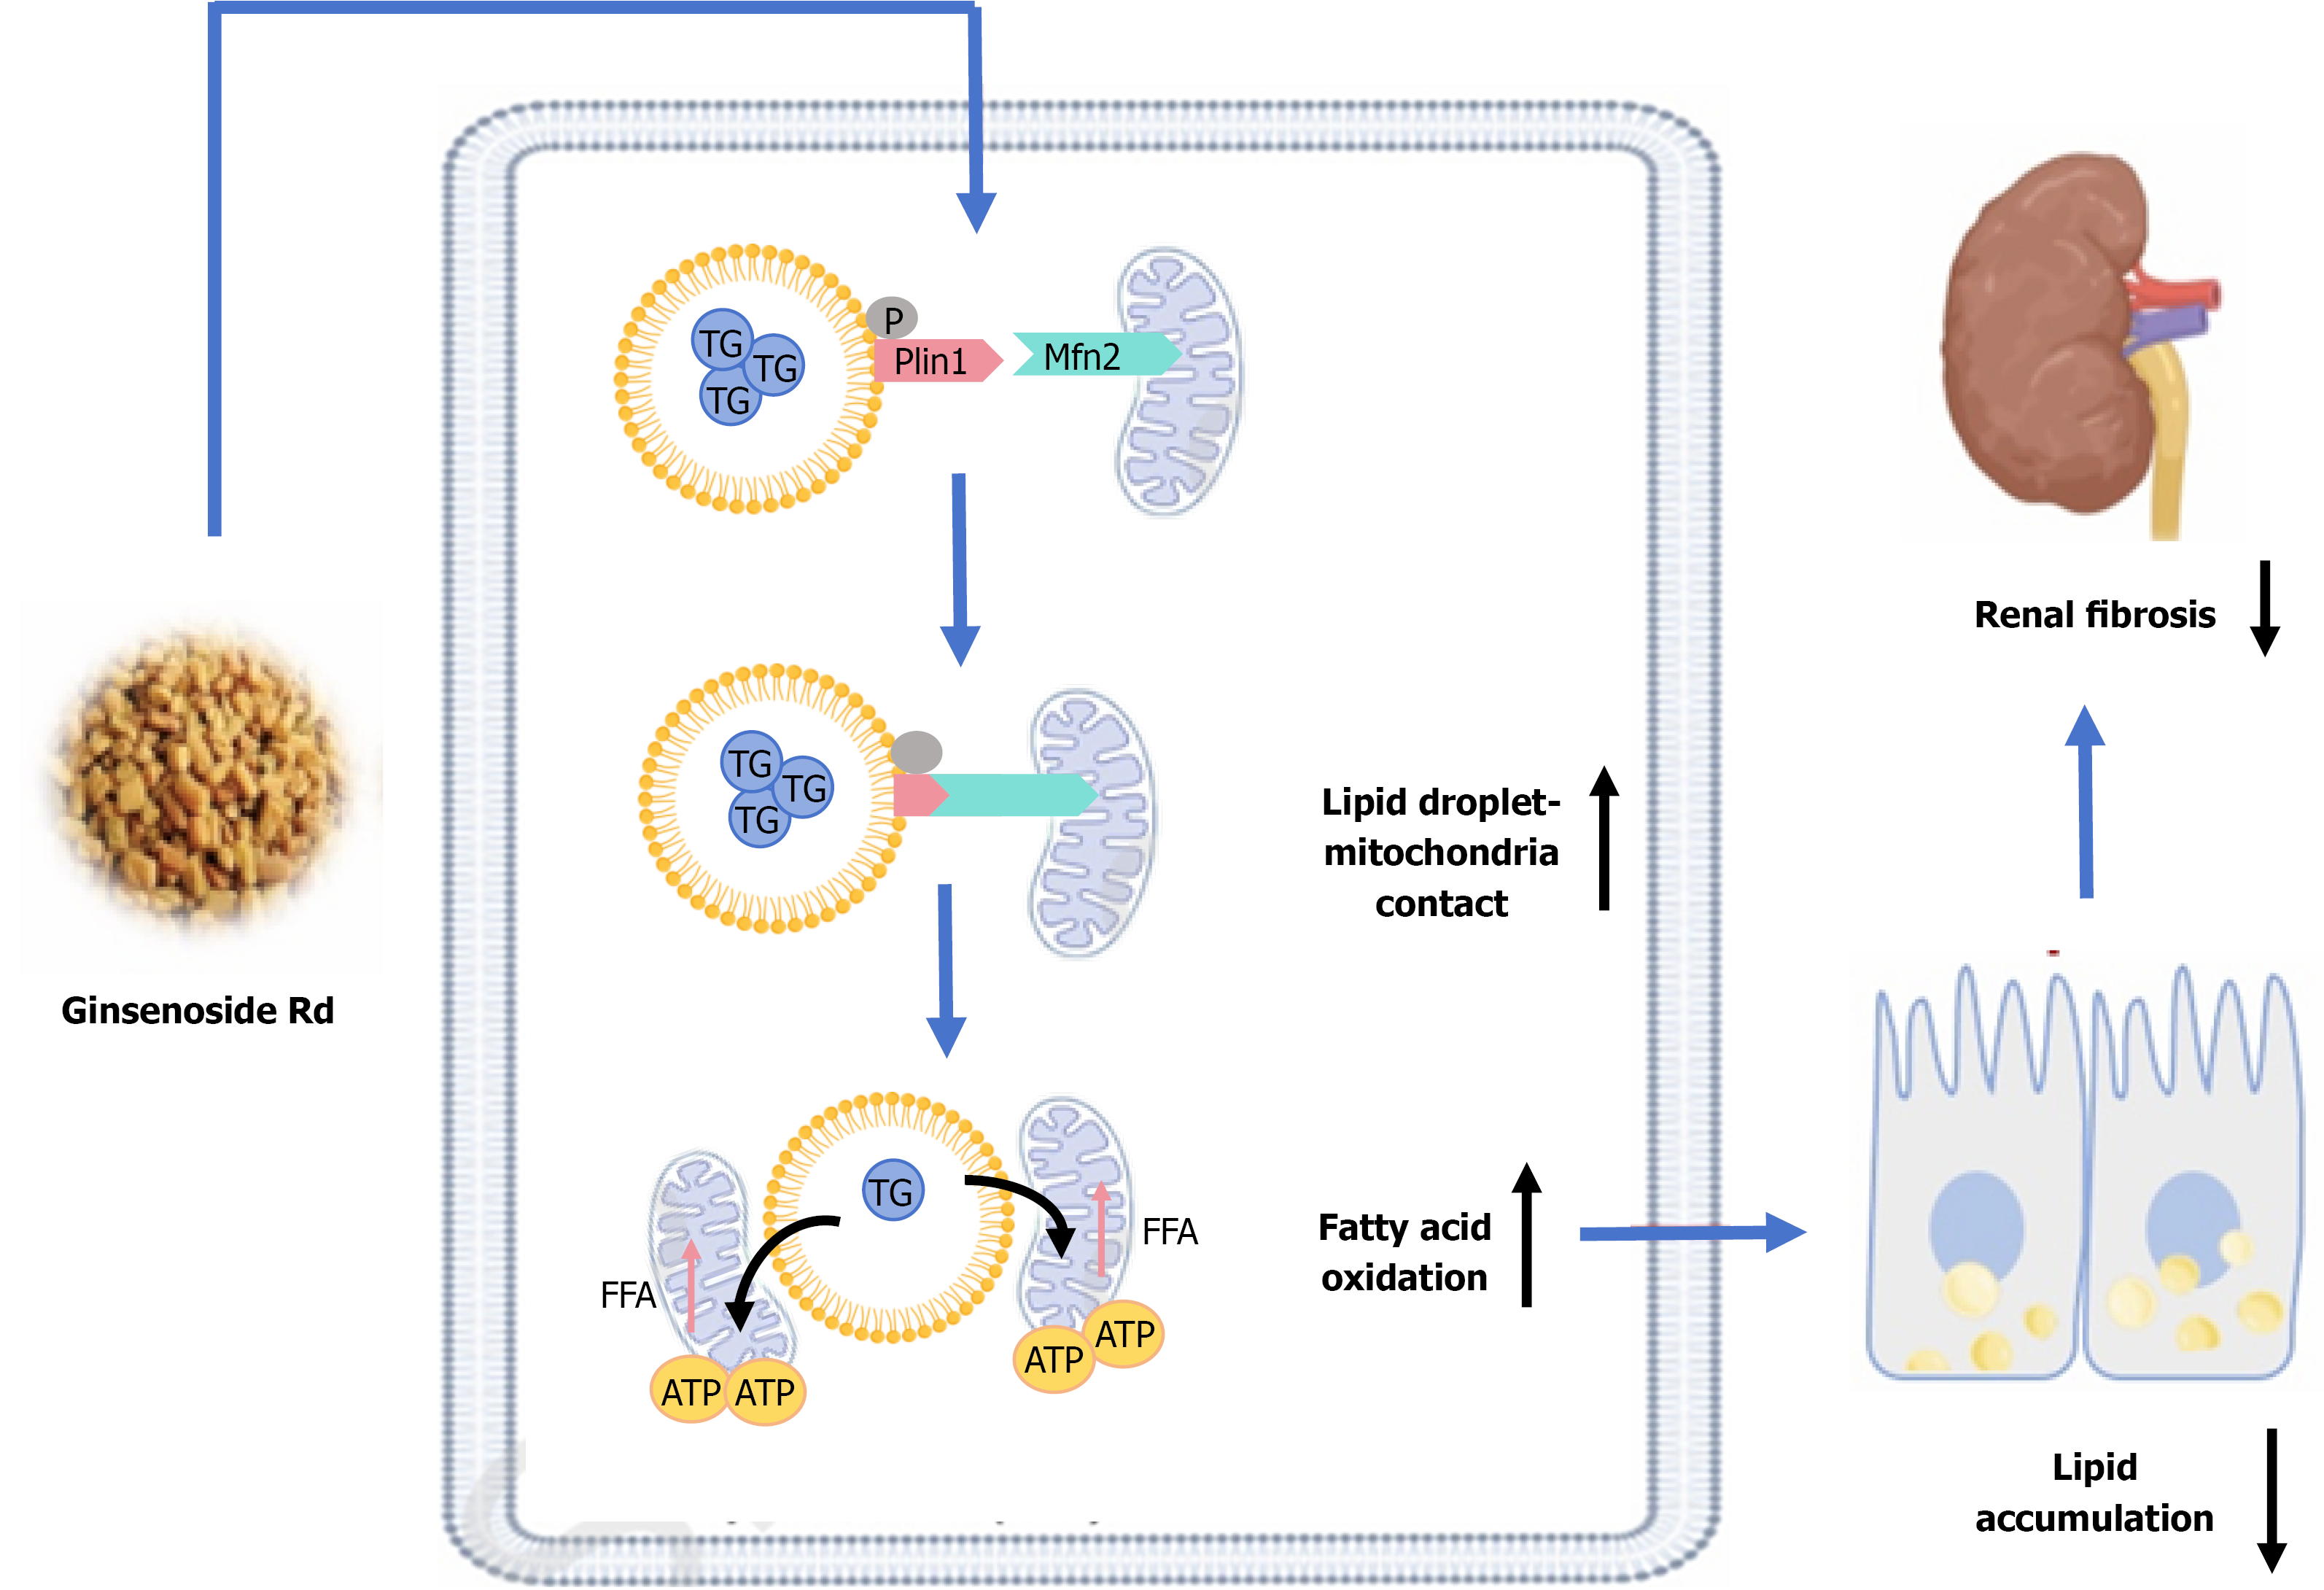
Figure 1 Proposed mechanism by which ginsenoside Rd promote the contact between mitochondria and lipid droplets through perilipin 1/mitofusin 2.
FFA: Free fatty acid; ATP: Adenosine triphosphate.
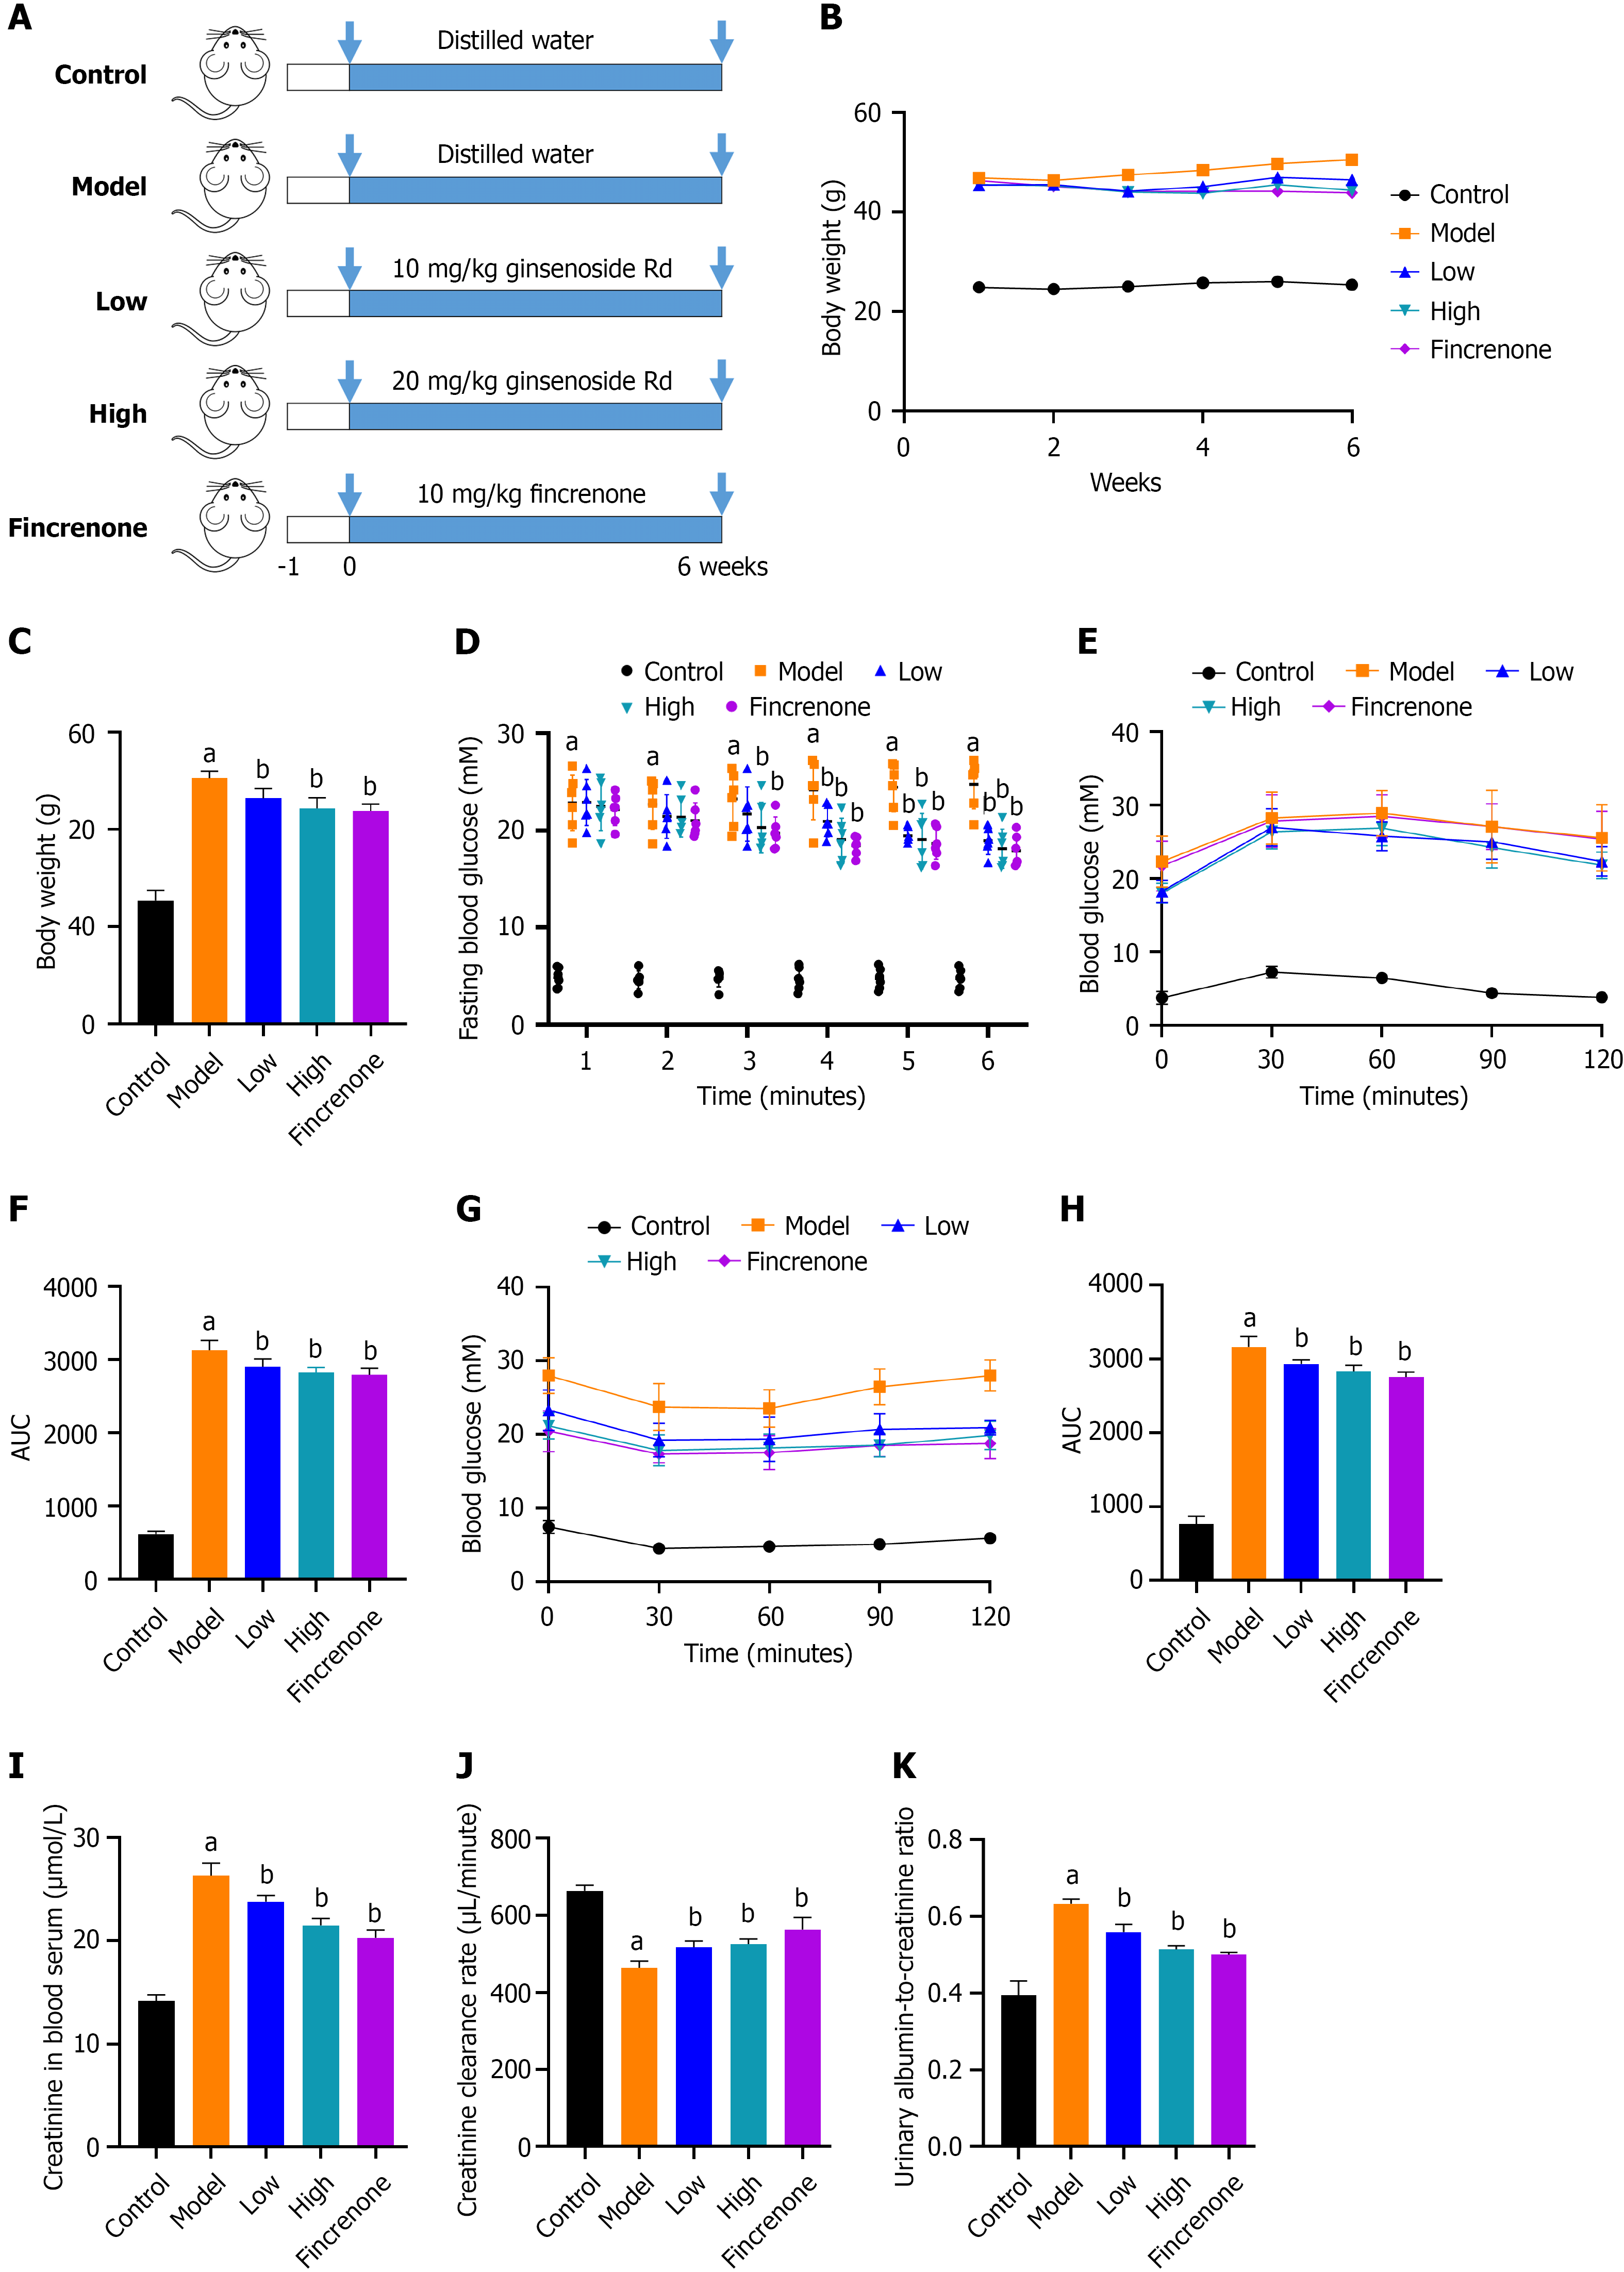
Figure 2 Treatment of diabetic kidney disease symptoms in db/db mice with ginsenoside Rd.
A: Animal experimental process; B: Weekly recorded weight (n = 6); C: The last weight chart (n = 6); D: Fasting blood glucose levels (n = 6); E: Blood glucose changes in the Glucose Tolerance Test (n = 6); F: Average area under Glucose Tolerance Test curve (n = 6); G: Blood glucose changes in the Insulin Tolerance Test (n = 6); H: Average area under Insulin Tolerance Test curve (n = 6); I: Creatinine in blood serum (n = 4); J: Creatinine clearance rate (n = 4); K: Urinary albumin-to-creatinine ratio (n = 4). Data are presented as mean ± SEM. aP < 0.01 compared with control group; bP < 0.01 compared with model group. AUC: Area under the curve.
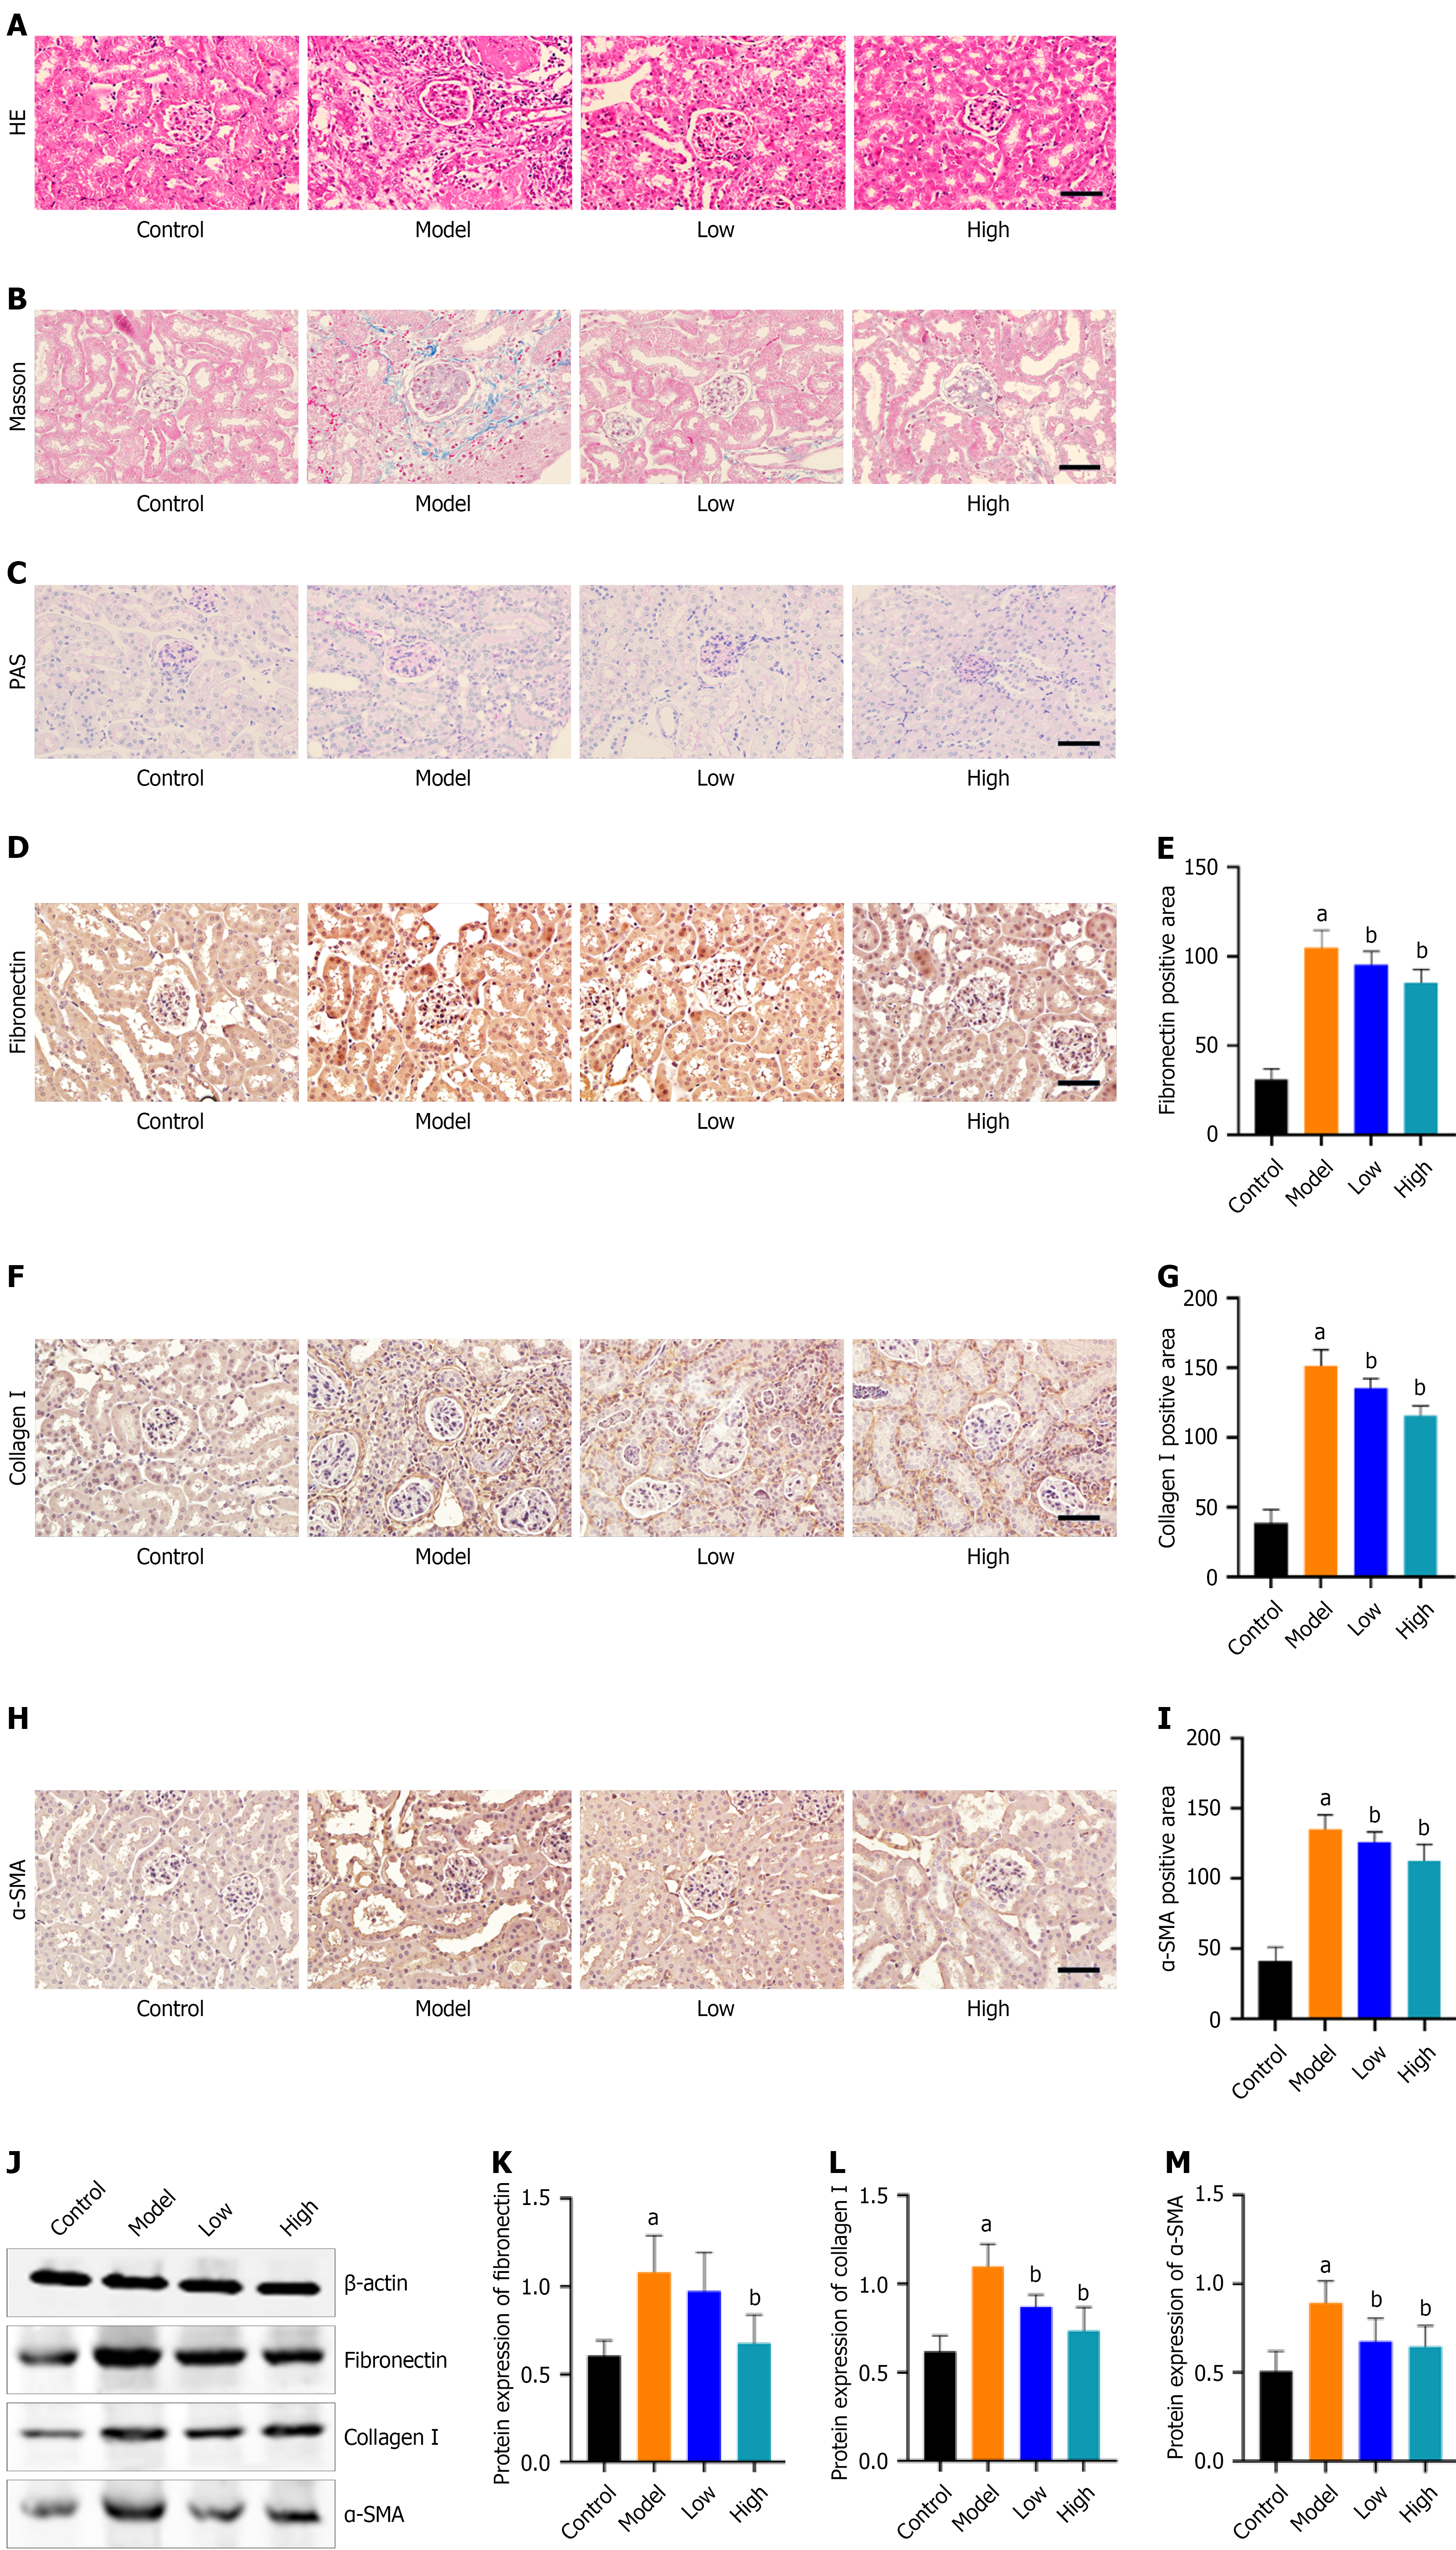
Figure 3 Ginsenoside Rd can inhibit renal interstitial fibrosis in db/db mice.
A: Hematoxylin and eosin staining in kidney. Scale bar, 100 μm; B: Masson staining in kidney. Scale bar, 100 μm; C: Periodic acid-Schiff staining in kidney. Scale bar, 100 μm; D: Immunohistochemical images of fibronectin in kidney. Scale bar, 100 μm; E: Statistical image of the positive area for fibronectin (n = 3); F: Immunohistochemical images of collagen I in kidney. Scale bar, 100 μm; G: Statistical image of the positive area for collagen I (n = 3); H: Immunohistochemical images of α-smooth muscle actin (SMA) in kidney. Scale bar, 100 μm; I: Statistical image of the positive area for α-SMA (n = 3); J: Western blot bands of fibronectin, collagen I and α-SMA; K: Western blot analysis of fibronectin (n = 4); L: Western blot analysis of collagen I (n = 4); M: Western blot analysis of α-SMA (n = 4). Data are presented as mean ± SEM. aP < 0.01 compared with control group; bP < 0.01 compared with model group. HE: Hematoxylin and eosin; SMA: Smooth muscle actin.
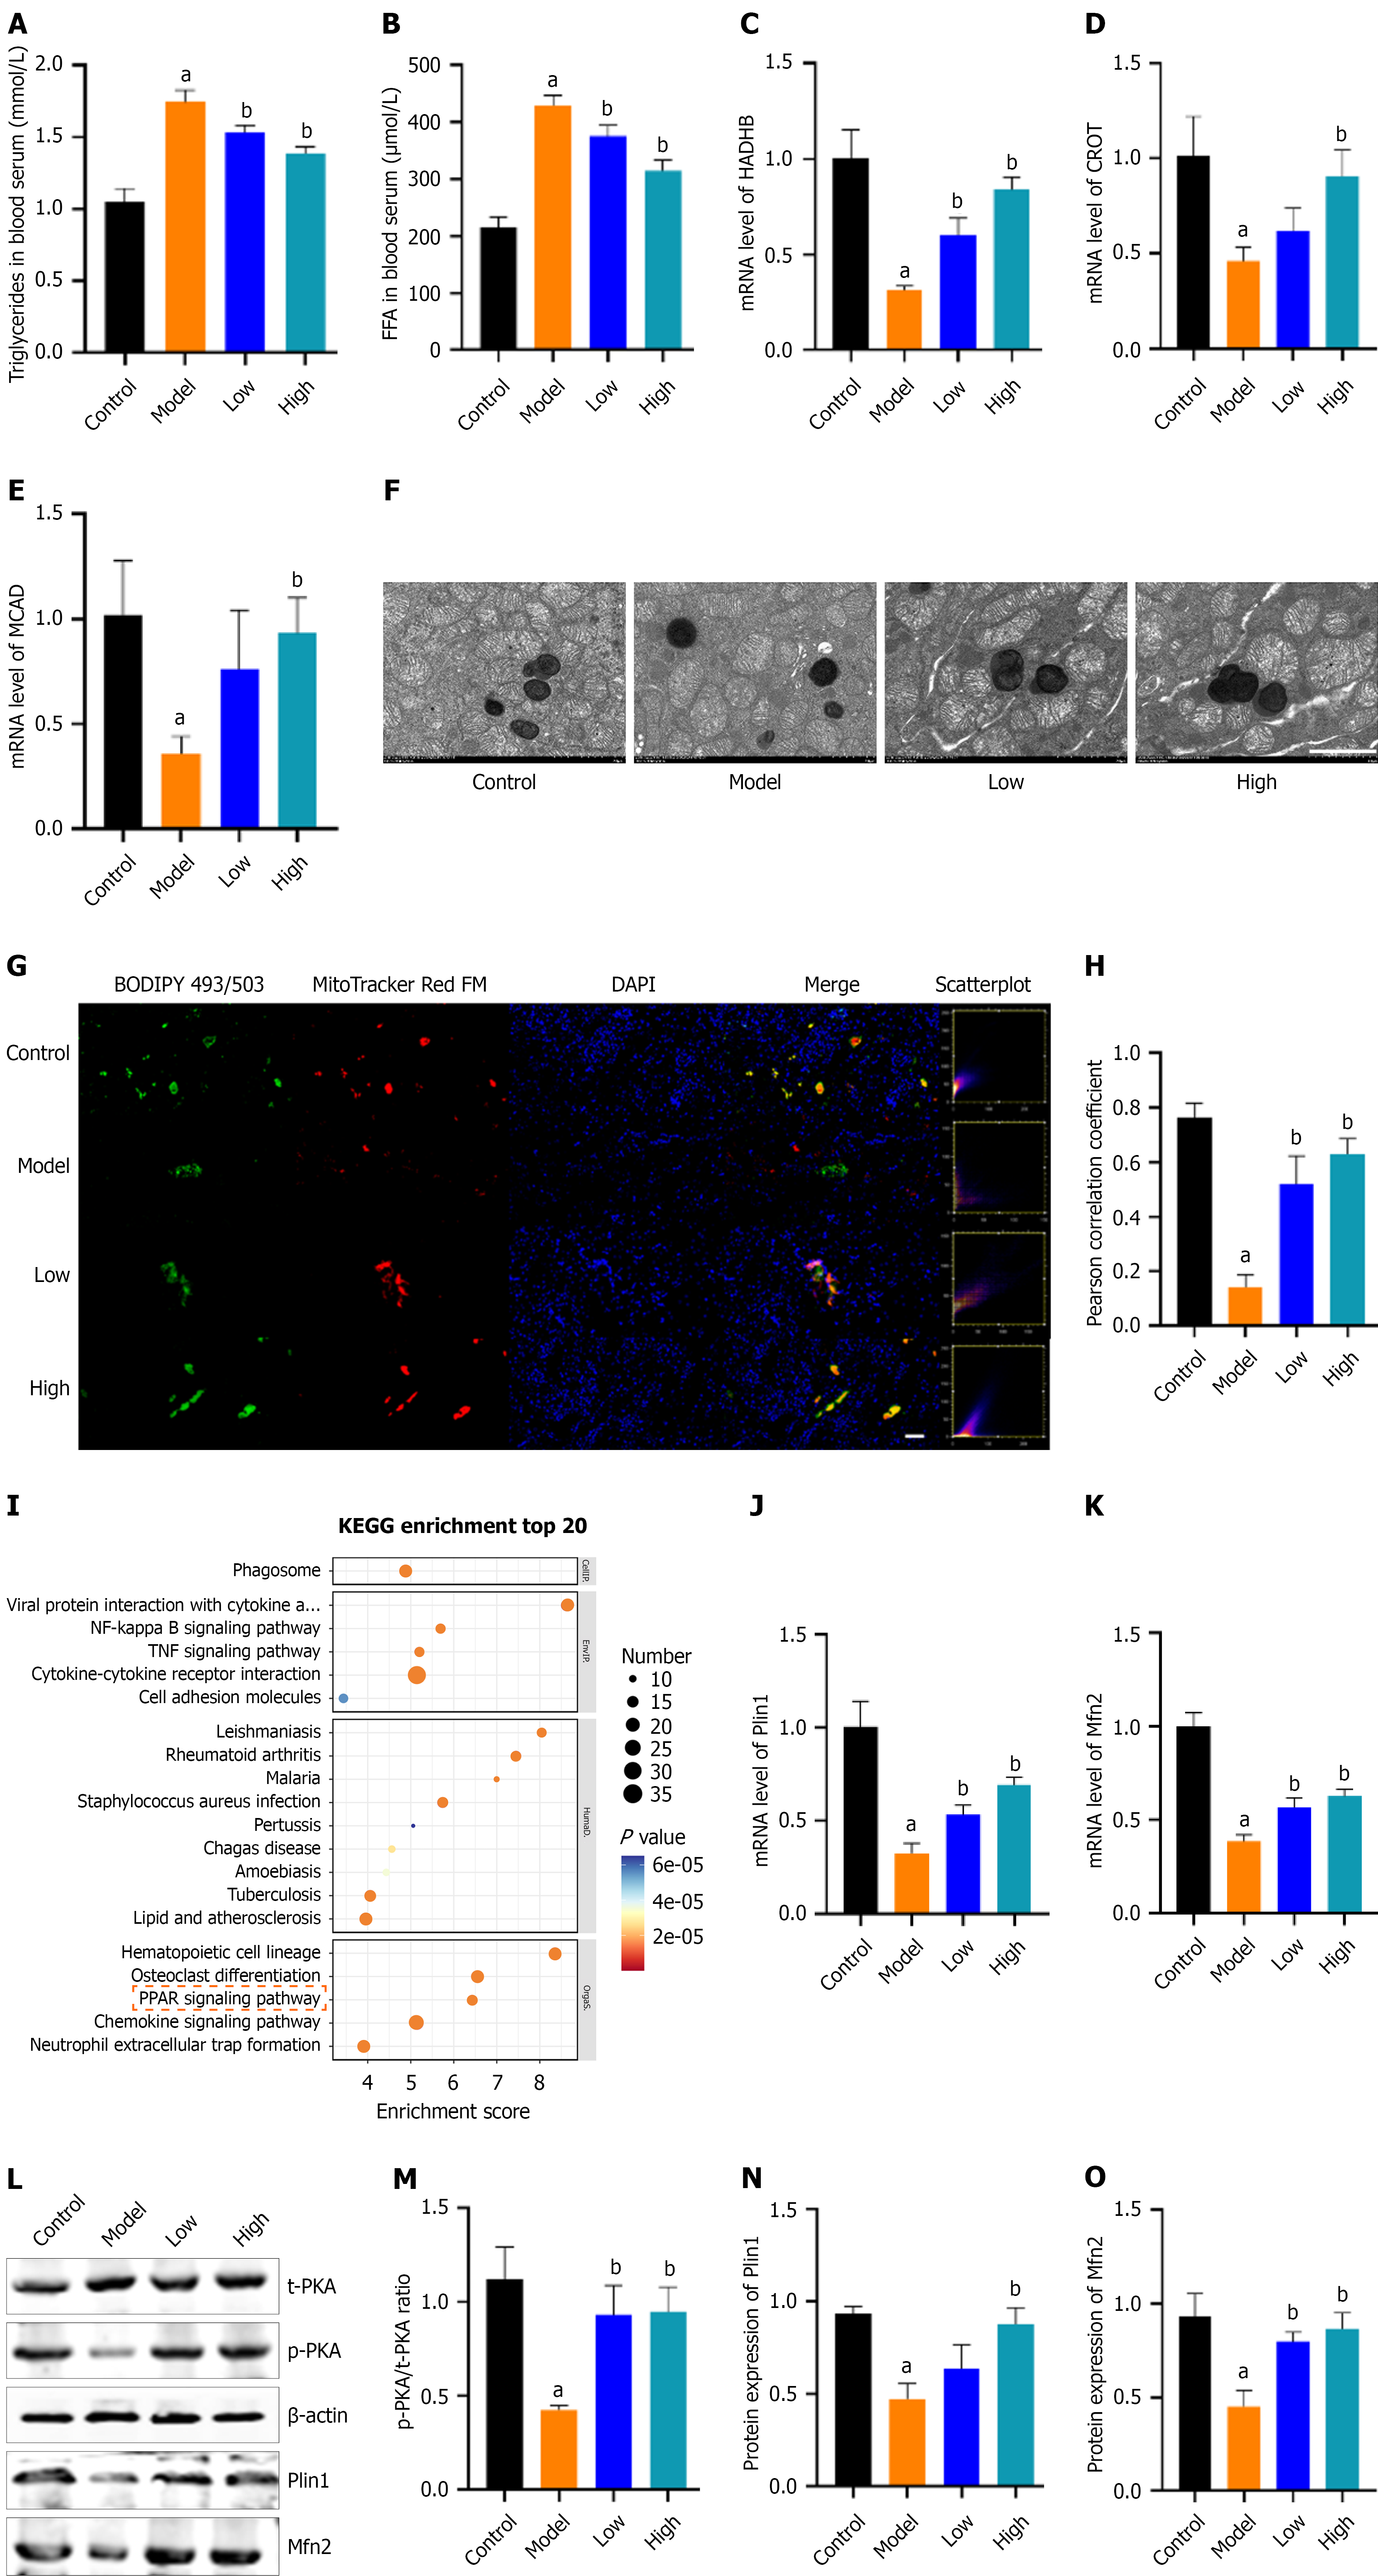
Figure 4 Ginsenoside Rd enhance the coupling of mitochondria and lipid droplets via perilipin 1-mitofusin 2 signaling pathway in db/db mice.
A: Triglycerides in blood serum (n = 4); B: Free fatty acid in blood serum (n = 4); C: The polymerase chain reaction (PCR) results of hydroxyacyl-CoA dehydrogenase trifunctional multienzyme complex subunit beta (n = 3); D: The PCR results of carnitine O-octanoyltransferase (n = 3); E: The PCR results of medium-chain acyl-CoA dehydrogenase (n = 3); F: Coupling of mitochondria and lipid droplets under electron microscopy. Scale bar, 2 μm; G: Immunofluorescence images showing the MitoTracker (red) and BODIPY (green) expression of kidney. DAPI staining indicates the nuclei (blue). Scale bar, 100 μm; H: Pearson correlation coefficient of MitoTracker and BODIPY (n = 3); I: Kyoto Encyclopedia of Genes and Genomes enrichment (total); J: The PCR results of perilipin (Plin) 1 (n = 3); K: The PCR results of mitofusin (Mfn) 2 (n = 3); L: Western blot bands of protein kinase A, Plin1 and Mfn2; M: Western blot analysis of protein kinase A (n = 4); N: Western blot analysis of Plin1 (n = 4); O: Western blot analysis of Mfn2 (n = 4). Data are presented as mean ± SEM. aP < 0.01 compared with control group; bP < 0.01 compared with model group. FFA: Free fatty acid; PKA: Protein kinase A; Plin1: Perilipin 1; Mfn2: Mitofusin 2; KEGG: Kyoto Encyclopedia of Genes and Genomes; NF: Nuclear factor; TNF: Tumor necrosis factor.
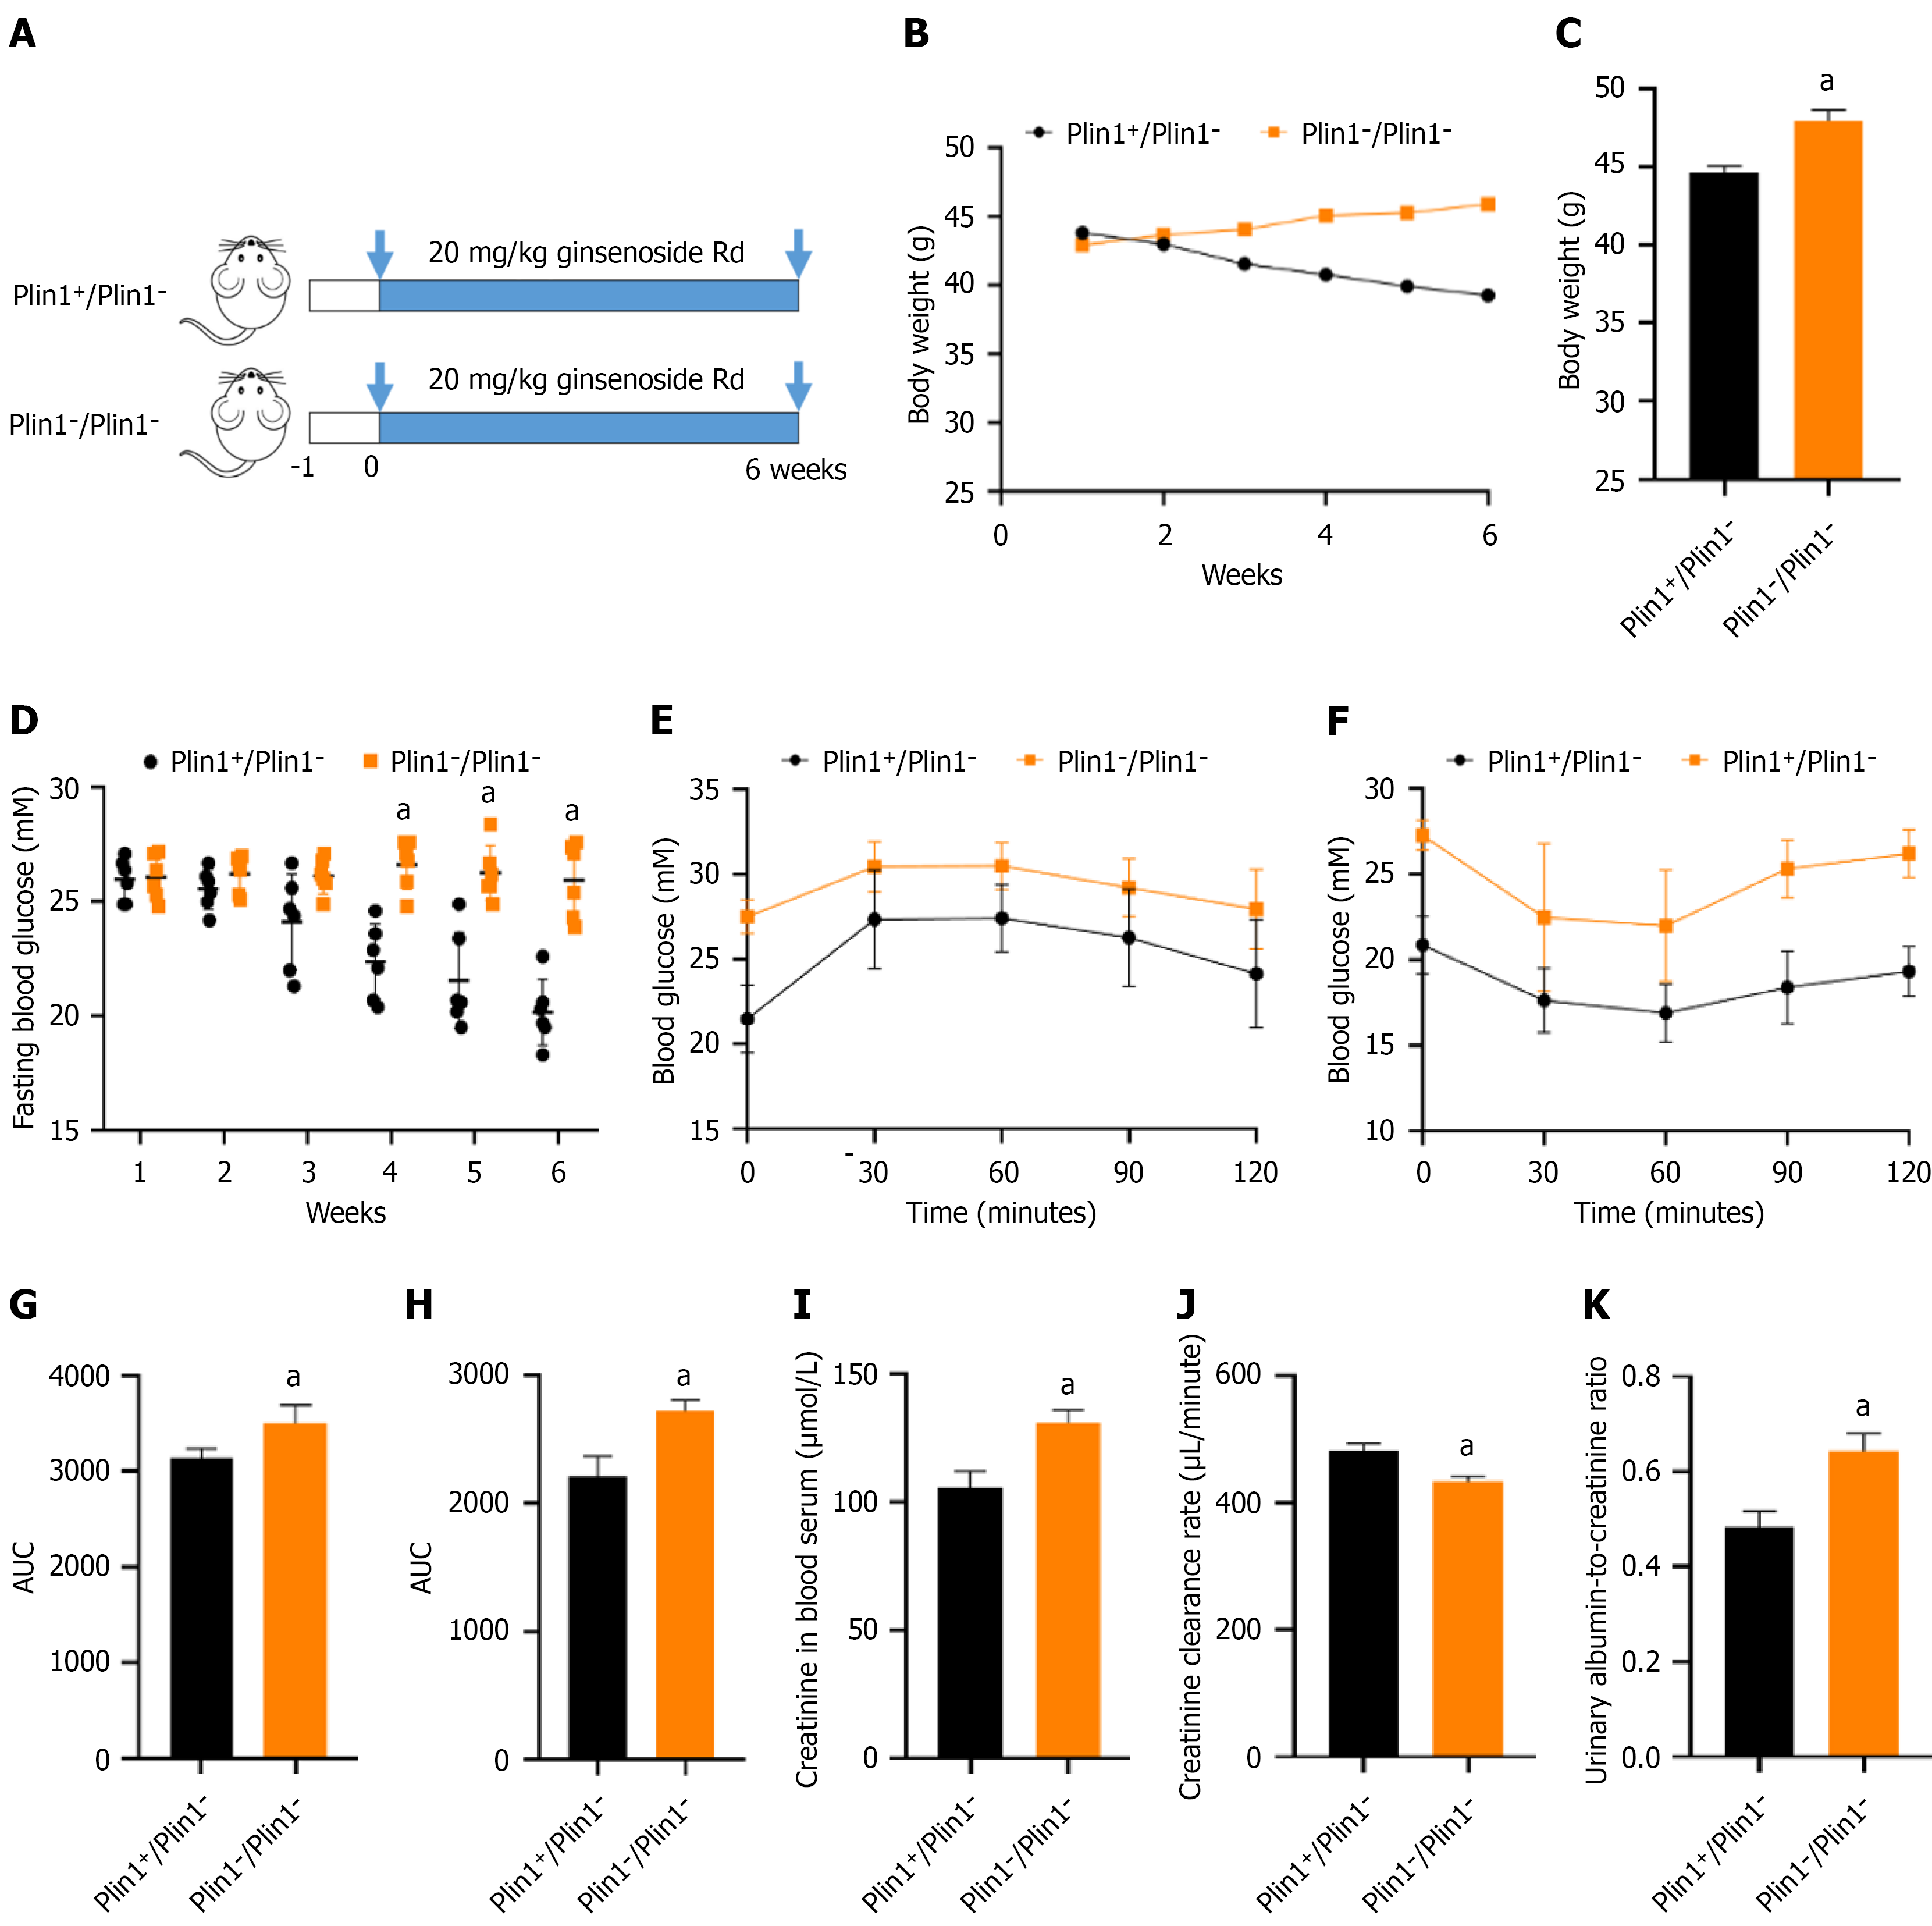
Figure 5 Treatment of diabetic kidney disease symptoms in perilipin 1-/perilipin 1- mice with ginsenoside Rd.
A: Animal experimental process; B: Weekly recorded weight (n = 6); C: The last weight chart (n = 6); D: Fasting blood glucose levels (n = 6); E: Blood glucose changes in the Glucose Tolerance Test (n = 6); F: Blood glucose changes in the Insulin Tolerance Test (n = 6); G: Average area under Glucose Tolerance Test curve (n = 6); H: Average area under Insulin Tolerance Test curve (n = 6); I: Creatinine in blood serum (n = 4); J: Creatinine clearance rate (n = 4); K: Urinary albumin-to-creatinine ratio (n = 4). Data are presented as mean ± SEM. aP < 0.01 compared with perilipin 1+/perilipin 1- group. Plin1: Perilipin 1; AUC: Area under the curve.
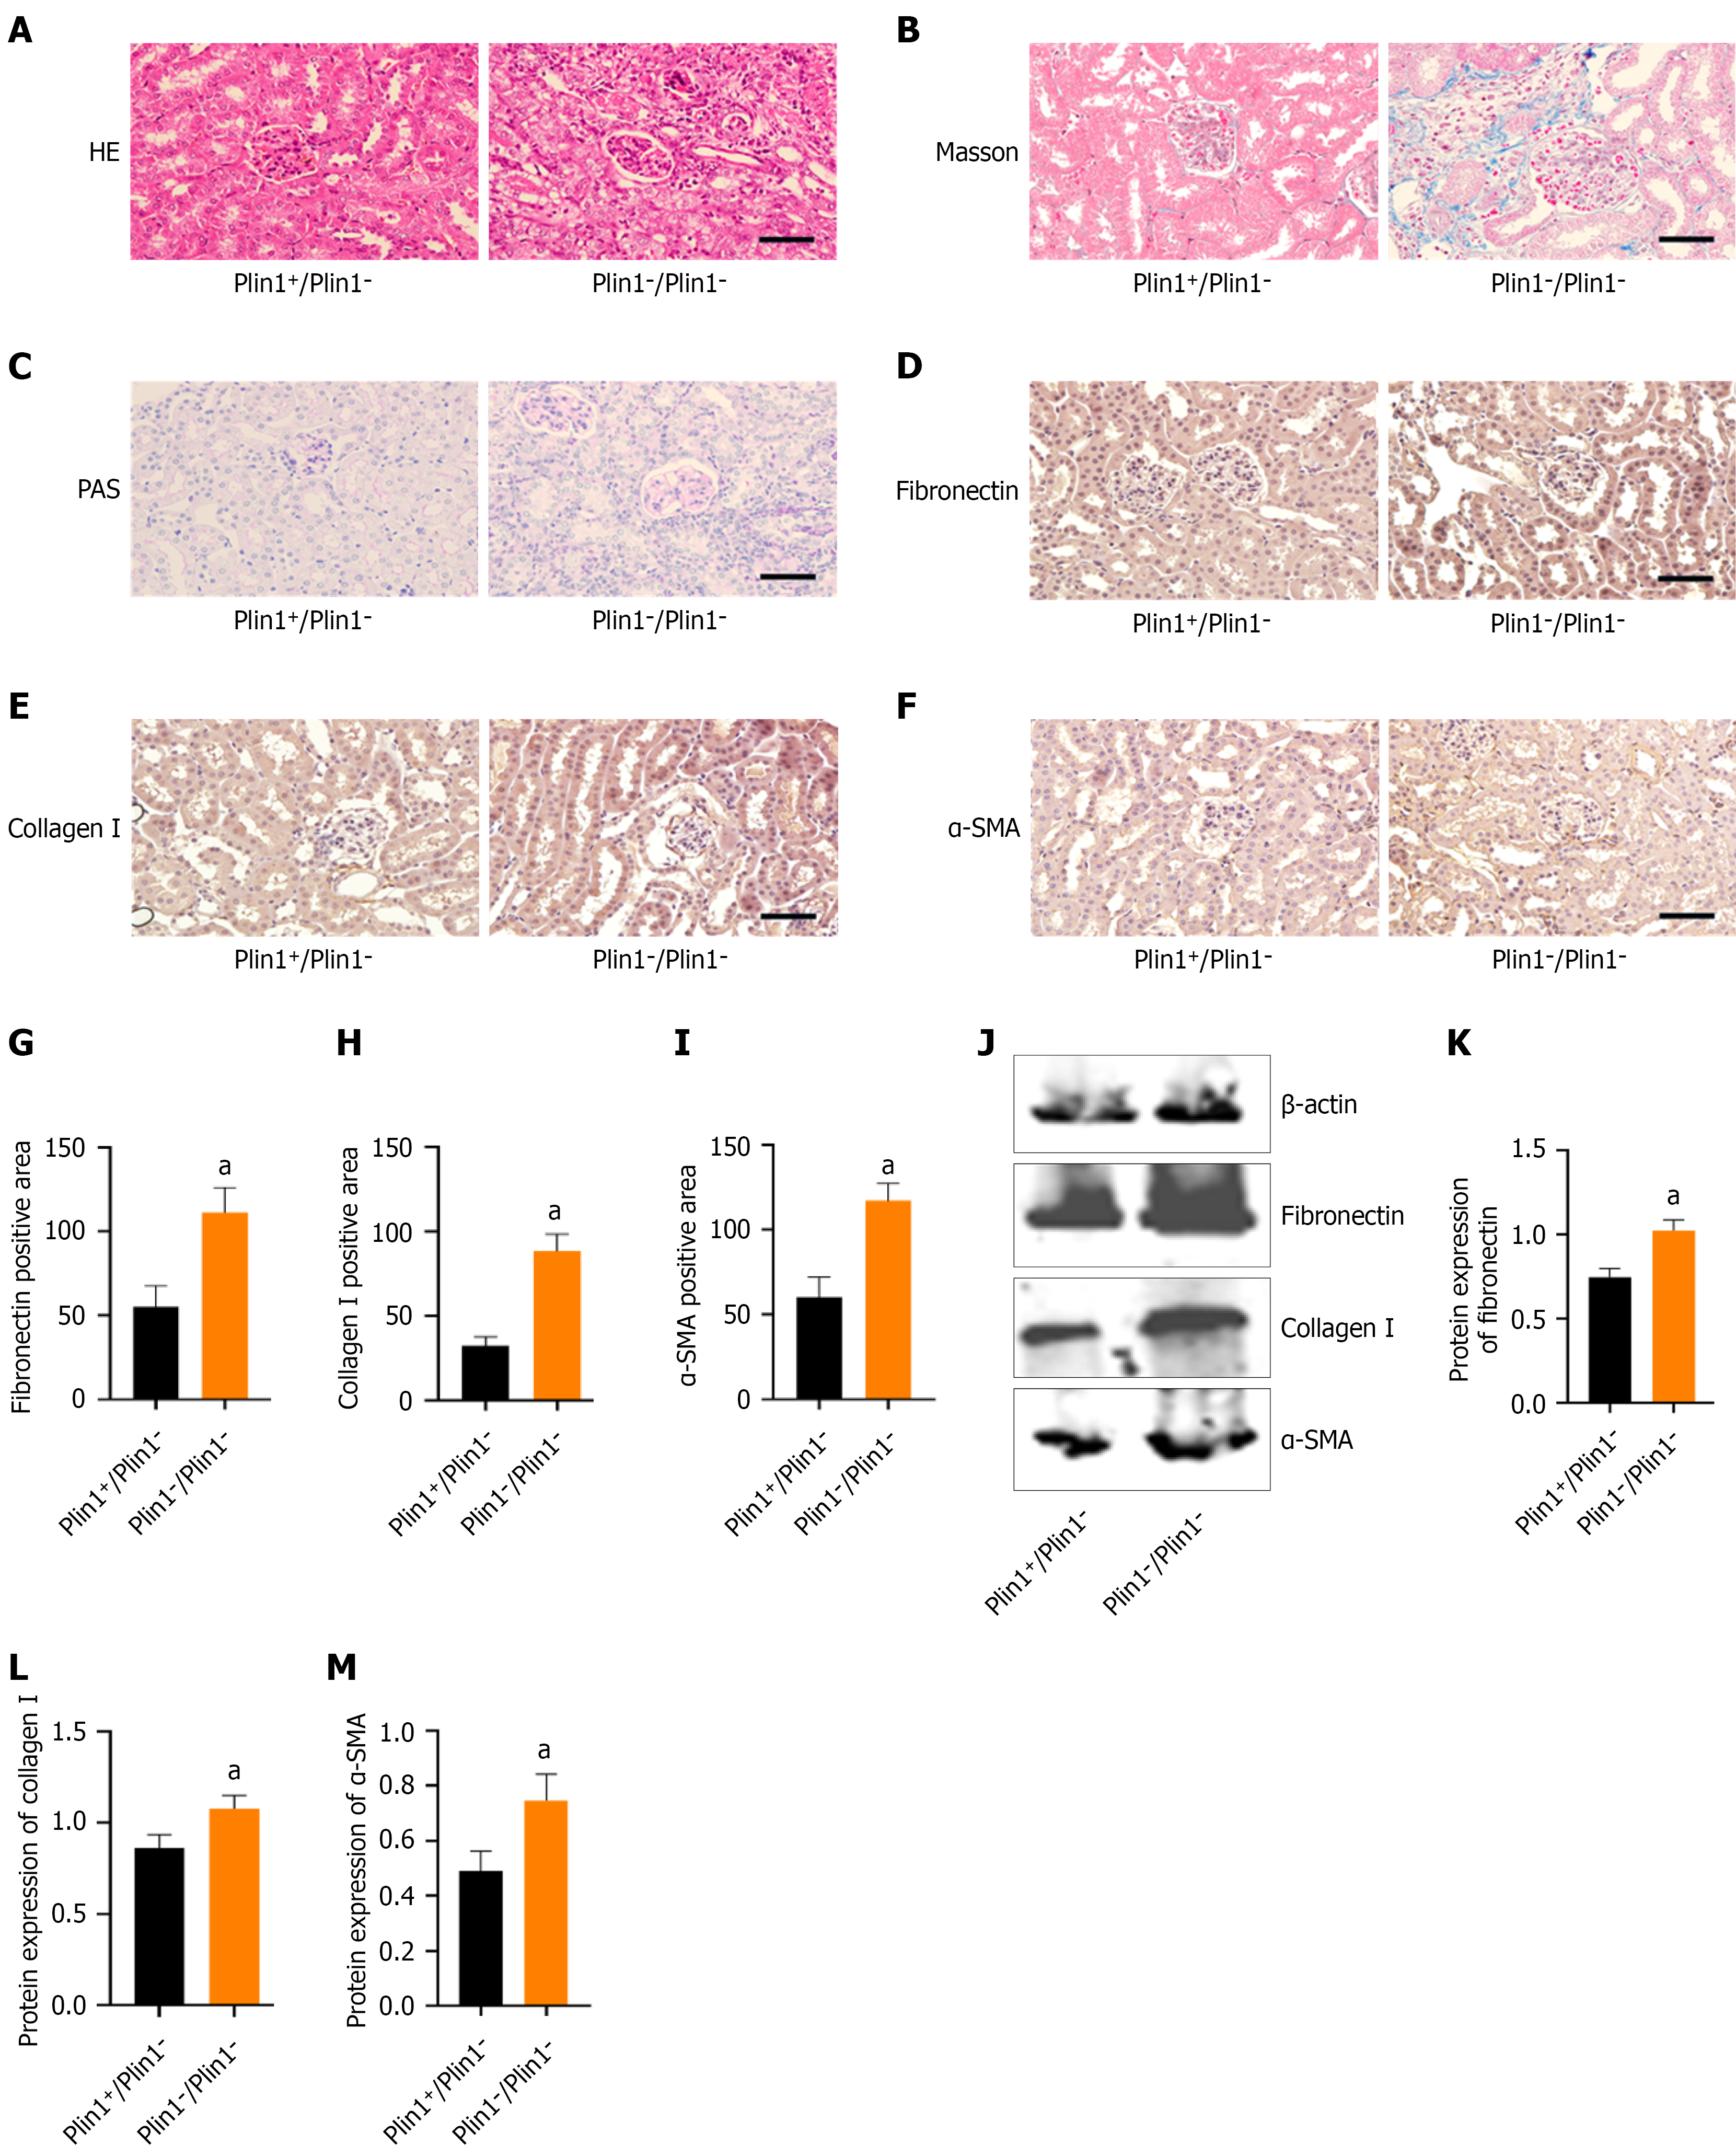
Figure 6 Ginsenoside Rd can inhibit renal interstitial fibrosis in perilipin 1-/perilipin 1- mice.
A: Representative hematoxylin and eosin staining in kidney. Scale bar, 100 μm; B: Representative Masson staining in the kidney. Scale bar, 100 μm; C: Representative Periodic acid-Schiff staining in the kidney. Scale bar, 100 μm; D: Immunohistochemical images of fibronectin in the kidney. Scale bar, 100 μm; E: Statistical image of the positive area for fibronectin (n = 3); F: Immunohistochemical images of collagen I in the kidney. Scale bar, 100 μm; G: Statistical image of the positive area for collagen I (n = 3); H: Immunohistochemical images of α-smooth muscle actin (SMA) in the kidney. Scale bar, 100 μm; I: Statistical image of the positive area for α-SMA (n = 3); J: Western blot bands of fibronectin, collagen I and α-SMA; K: Western blot analysis of fibronectin (n = 4); L: Western blot analysis of collagen I (n = 4); M: Western blot analysis of α-SMA (n = 4). Data are presented as mean ± SEM. aP < 0.01 compared with perilipin 1-/perilipin 1- group. HE: Hematoxylin and eosin; SMA: Smooth muscle actin; Plin1: Perilipin 1; PAS: Periodic acid-Schiff.
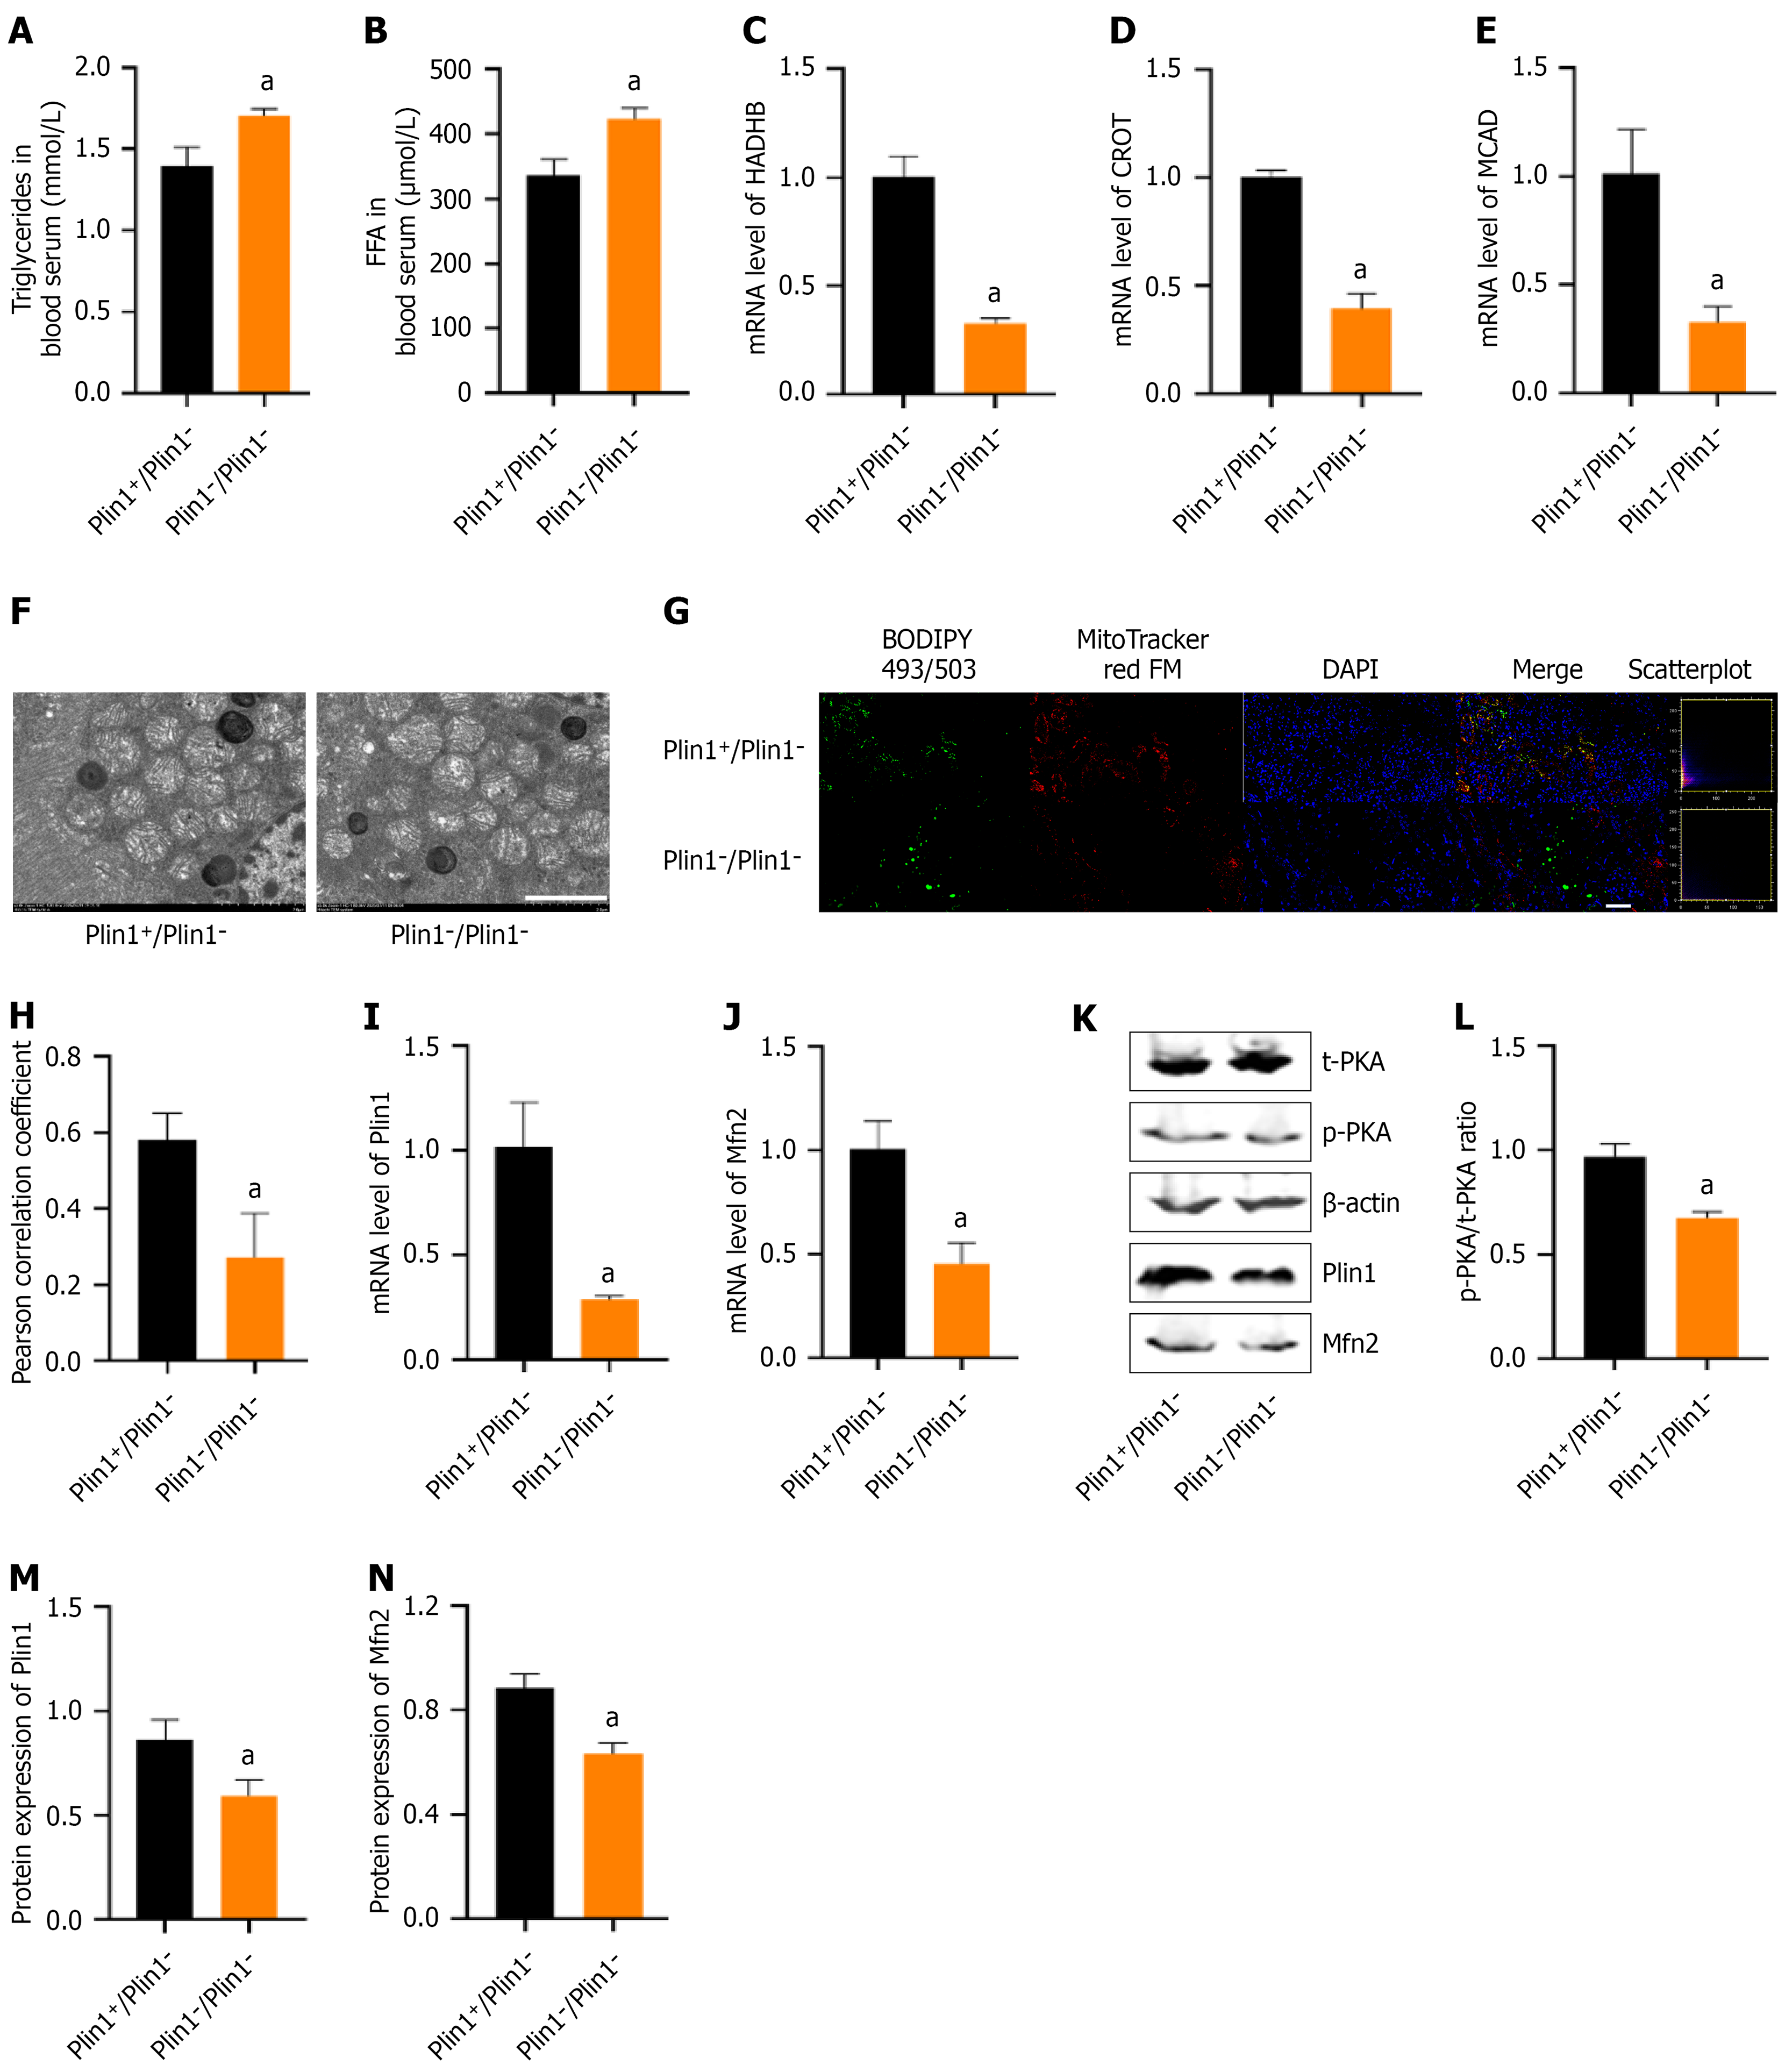
Figure 7 Ginsenoside Rd enhances the coupling of mitochondria and lipid droplets via perilipin 1-mitofusin 2 signaling pathway in perilipin 1-/perilipin 1- mice.
A: Triglycerides in blood serum (n = 4); B: Free fatty acid in blood serum (n = 4); C: The polymerase chain reaction (PCR) results of hydroxyacyl-CoA dehydrogenase trifunctional multienzyme complex subunit beta (n = 3); D: The PCR results of carnitine O-octanoyltransferase (n = 3); E: The PCR results of medium-chain acyl-CoA dehydrogenase (n = 3); F: Coupling of mitochondria and lipid droplets under electron microscopy. Scale bar, 2 μm; G: Immunofluorescence images showing the MitoTracker (red) and BODIPY (green) expression in the kidney. DAPI staining indicates the nuclei (blue). Scale bar, 100 μm; H: Pearson correlation coefficient of MitoTracker and BODIPY (n = 3); I: The PCR results of perilipin (Plin) 1 (n = 3); J: The PCR results of mitofusin (Mfn) 2 (n = 3); K: Western blot bands of protein kinase A, Plin1 and Mfn2; L: Western blot analysis of protein kinase A (n = 4); M: Western blot analysis of Plin1 (n = 4); N: Western blot analysis of Mfn2 (n = 4). Data are presented as mean ± SEM. aP < 0.01 compared with Plin1-/Plin1- group. HADHB: Hydroxyacyl-CoA dehydrogenase trifunctional multienzyme complex subunit beta; CROT: Carnitine O-octanoyltransferase; MCAD: Medium-chain acyl-CoA dehydrogenase; FFA: Free fatty acid; PKA: Protein kinase A; Plin1: Perilipin 1; Mfn2: Mitofusin 2.
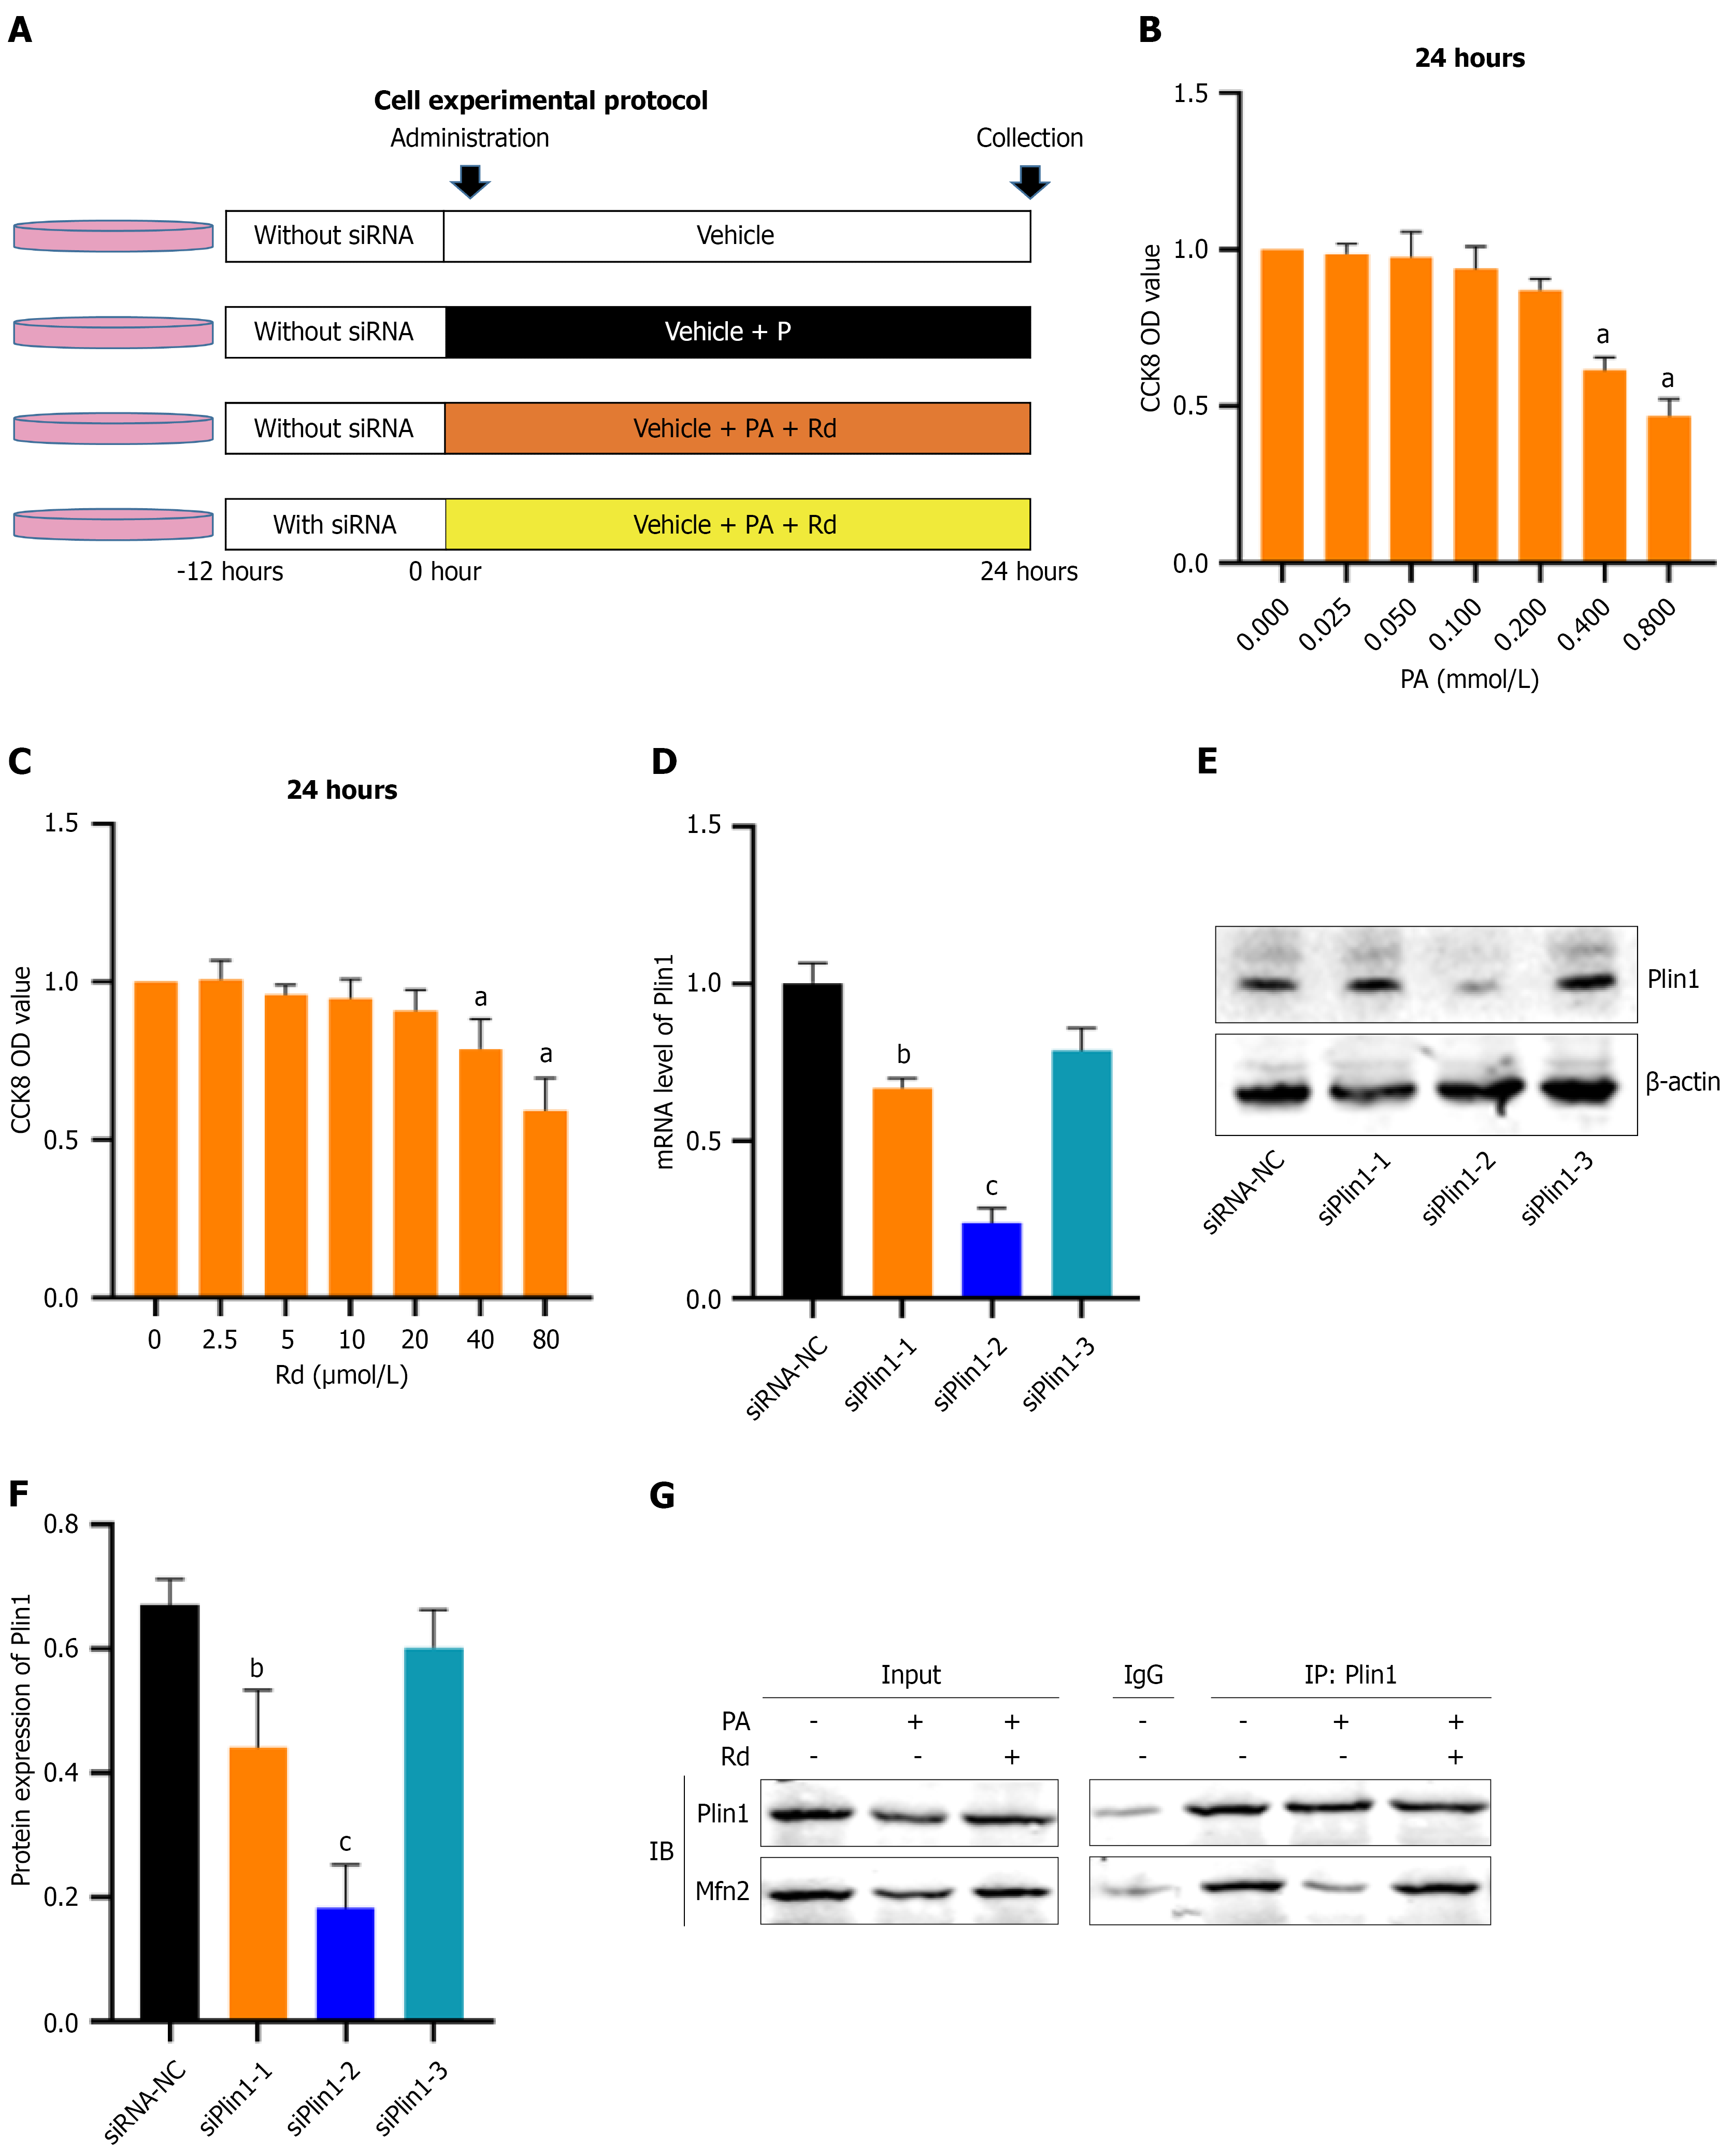
Figure 8 CCK-8 and siRNA in HK-2 cells.
A: HK-2 experimental protocol; B: The CCK-8 of palmitic acid (n = 4); C: The CCK-8 of Rd (n = 4); D: Knockdown efficiency of si-perilipin (Plin) 1 at mRNA level (n = 3); E: Western blot bands of si-Plin1; F: Knockdown efficiency of si-Plin1 at protein level (n = 3); G: Co-immunoprecipitation analysis of the interaction between Plin1 and mitofusin 2 (n = 3). Data are presented as mean ± SEM. aP < 0.05 compared with control group; bP < 0.05, cP < 0.01 compared with negative control siRNA group. Plin1: Perilipin 1; Mfn2: Mitofusin 2; PA: Palmitic acid; IgG: Immunoglobulin G; siRNA-NC: Negative control siRNA.
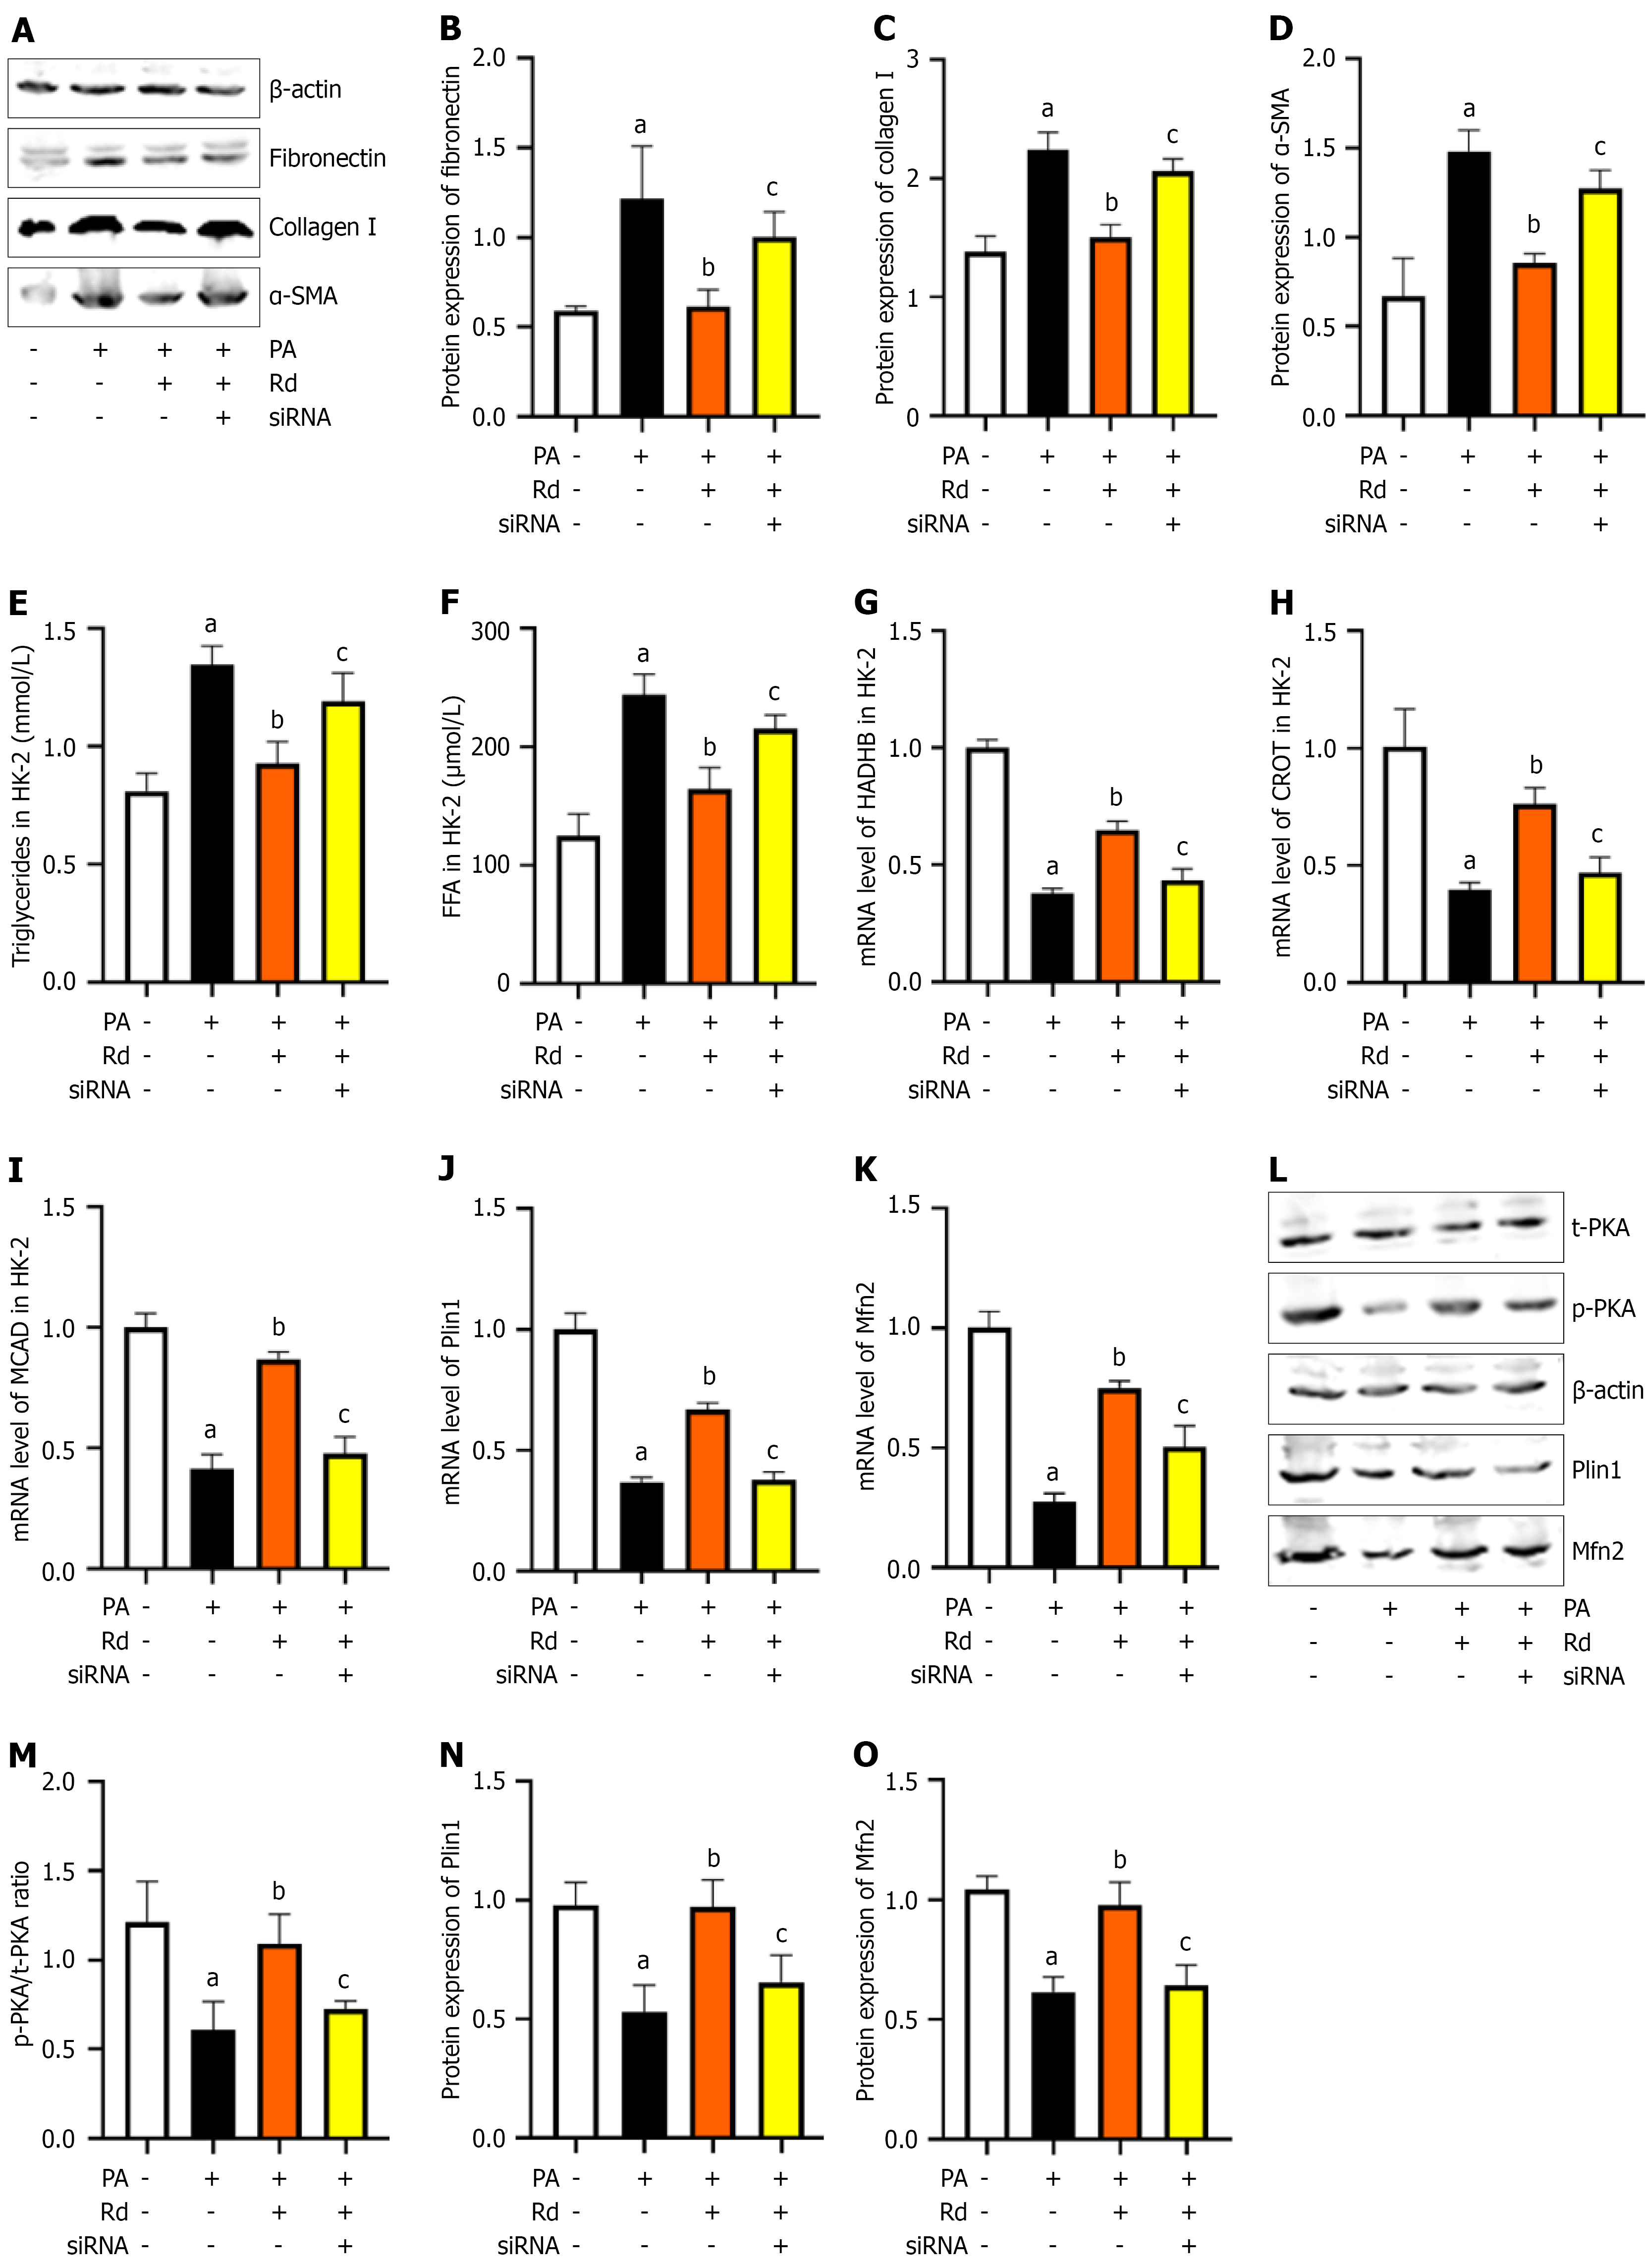
Figure 9 Ginsenoside Rd enhances the coupling of mitochondria and lipid droplets via perilipin 1-mitofusin 2 signaling pathway in HK-2 cells.
A: Western blot bands of fibronectin, collagen I and α-smooth muscle actin; B: Western blot analysis of fibronectin (n = 4); C: Western blot analysis of collagen I (n = 4); D: Western blot analysis of α-smooth muscle actin (n = 4); E: Triglycerides in blood serum (n = 3); F: Free fatty acid in blood serum (n = 3); G: The polymerase chain reaction (PCR) results of hydroxyacyl-CoA dehydrogenase trifunctional multienzyme complex subunit beta (n = 3); H: The PCR results of carnitine O-octanoyltransferase (n = 3); I: The PCR results of medium-chain acyl-CoA dehydrogenase (n = 3); J: The PCR results of perilipin (Plin) 1 (n = 3); K: The PCR results of mitofusin (Mfn) 2 (n = 3); L: Western blot bands of protein kinase A, Plin1 and Mfn2; M: Western blot analysis of protein kinase A (n = 4); N: Western blot analysis of Plin1 (n = 4); O: Western blot analysis of Mfn2 (n = 4). Data are presented as mean ± SEM. aP < 0.01 compared with control group; bP < 0.01 compared with model group; cP < 0.01 compared with Rd group. PA: Palmitic acid; SMA: Smooth muscle actin; HADHB: Hydroxyacyl-CoA dehydrogenase trifunctional multienzyme complex subunit beta; CROT: Carnitine O-octanoyltransferase; MCAD: Medium-chain acyl-CoA dehydrogenase; FFA: Free fatty acid; Plin1: Perilipin 1; Mfn2: Mitofusin 2.
- Citation: Wu WB, Tao Y, Xu NJ, Shao QQ, Yuan F, Dong H, Lu FE, Zheng CH, Wu F. Ginsenoside Rd promote the contact between mitochondria and lipid droplets through Plin1/Mfn2 to treat diabetic kidney disease. World J Diabetes 2026; 17(9): 123886
- URL: https://www.wjgnet.com/1948-9358/full/v17/i9/123886.htm
- DOI: https://dx.doi.org/10.4239/wjd.123886