
















Copyright: ©Author(s) 2026.
World J Diabetes. Sep 15, 2026; 17(9): 123276
Published online Sep 15, 2026. doi: 10.4239/wjd.123276
Published online Sep 15, 2026. doi: 10.4239/wjd.123276
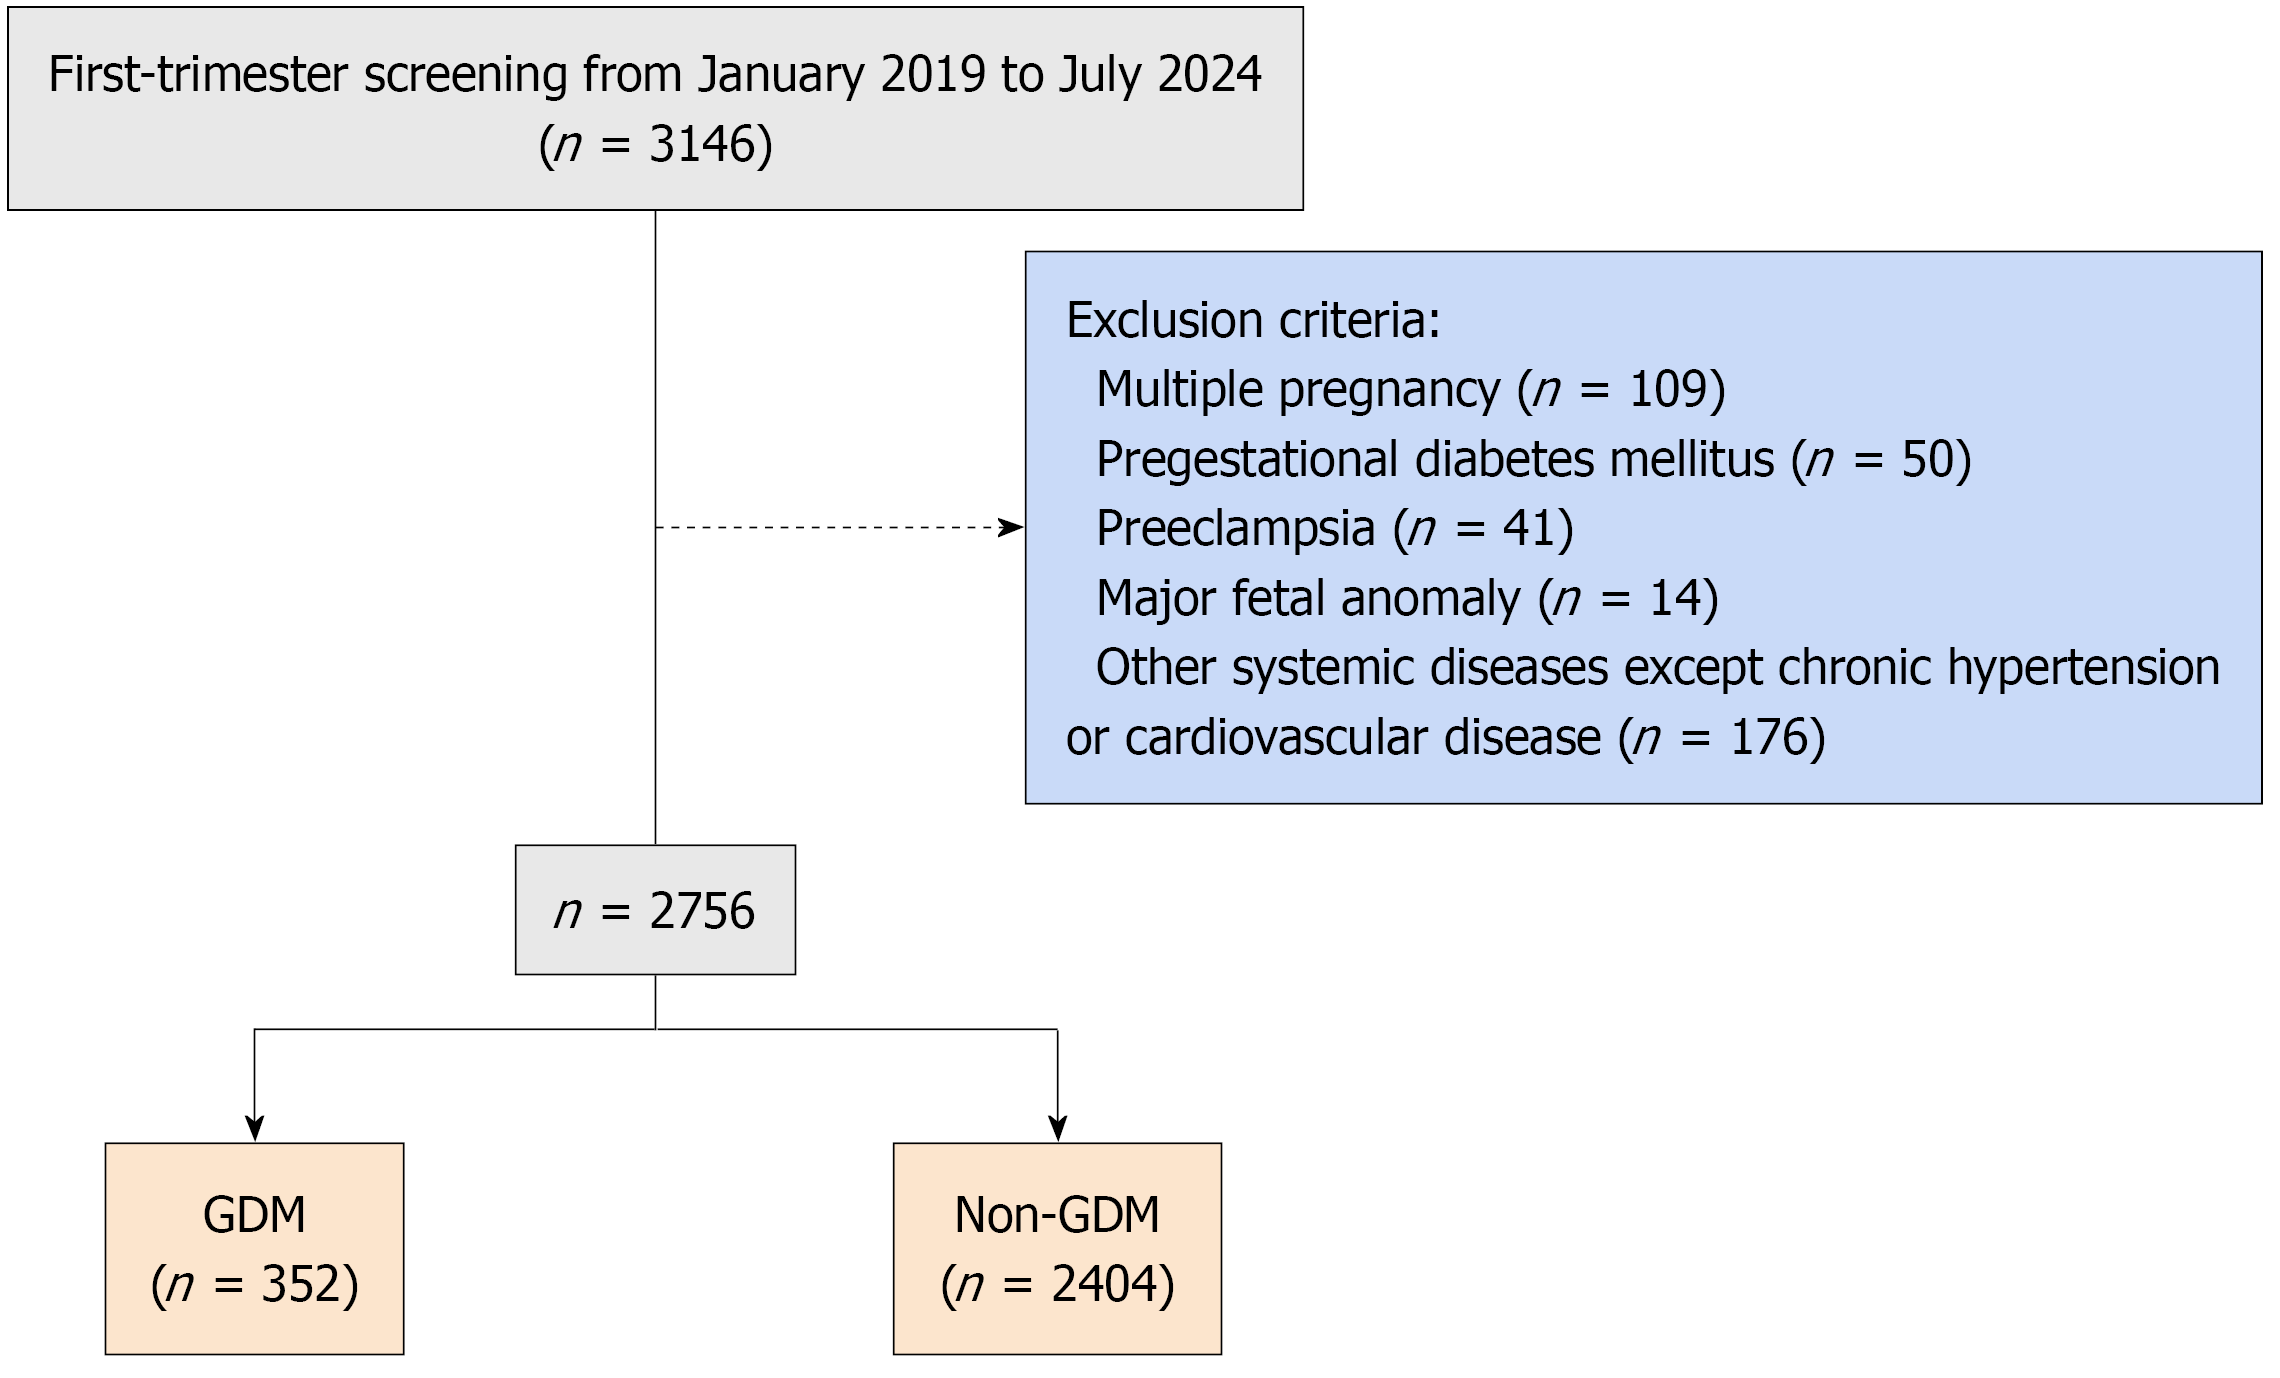
Figure 1 Flowchart of participant selection and study population enrollment for gestational diabetes mellitus prediction analysis.
GDM: Gestational diabetes mellitus.
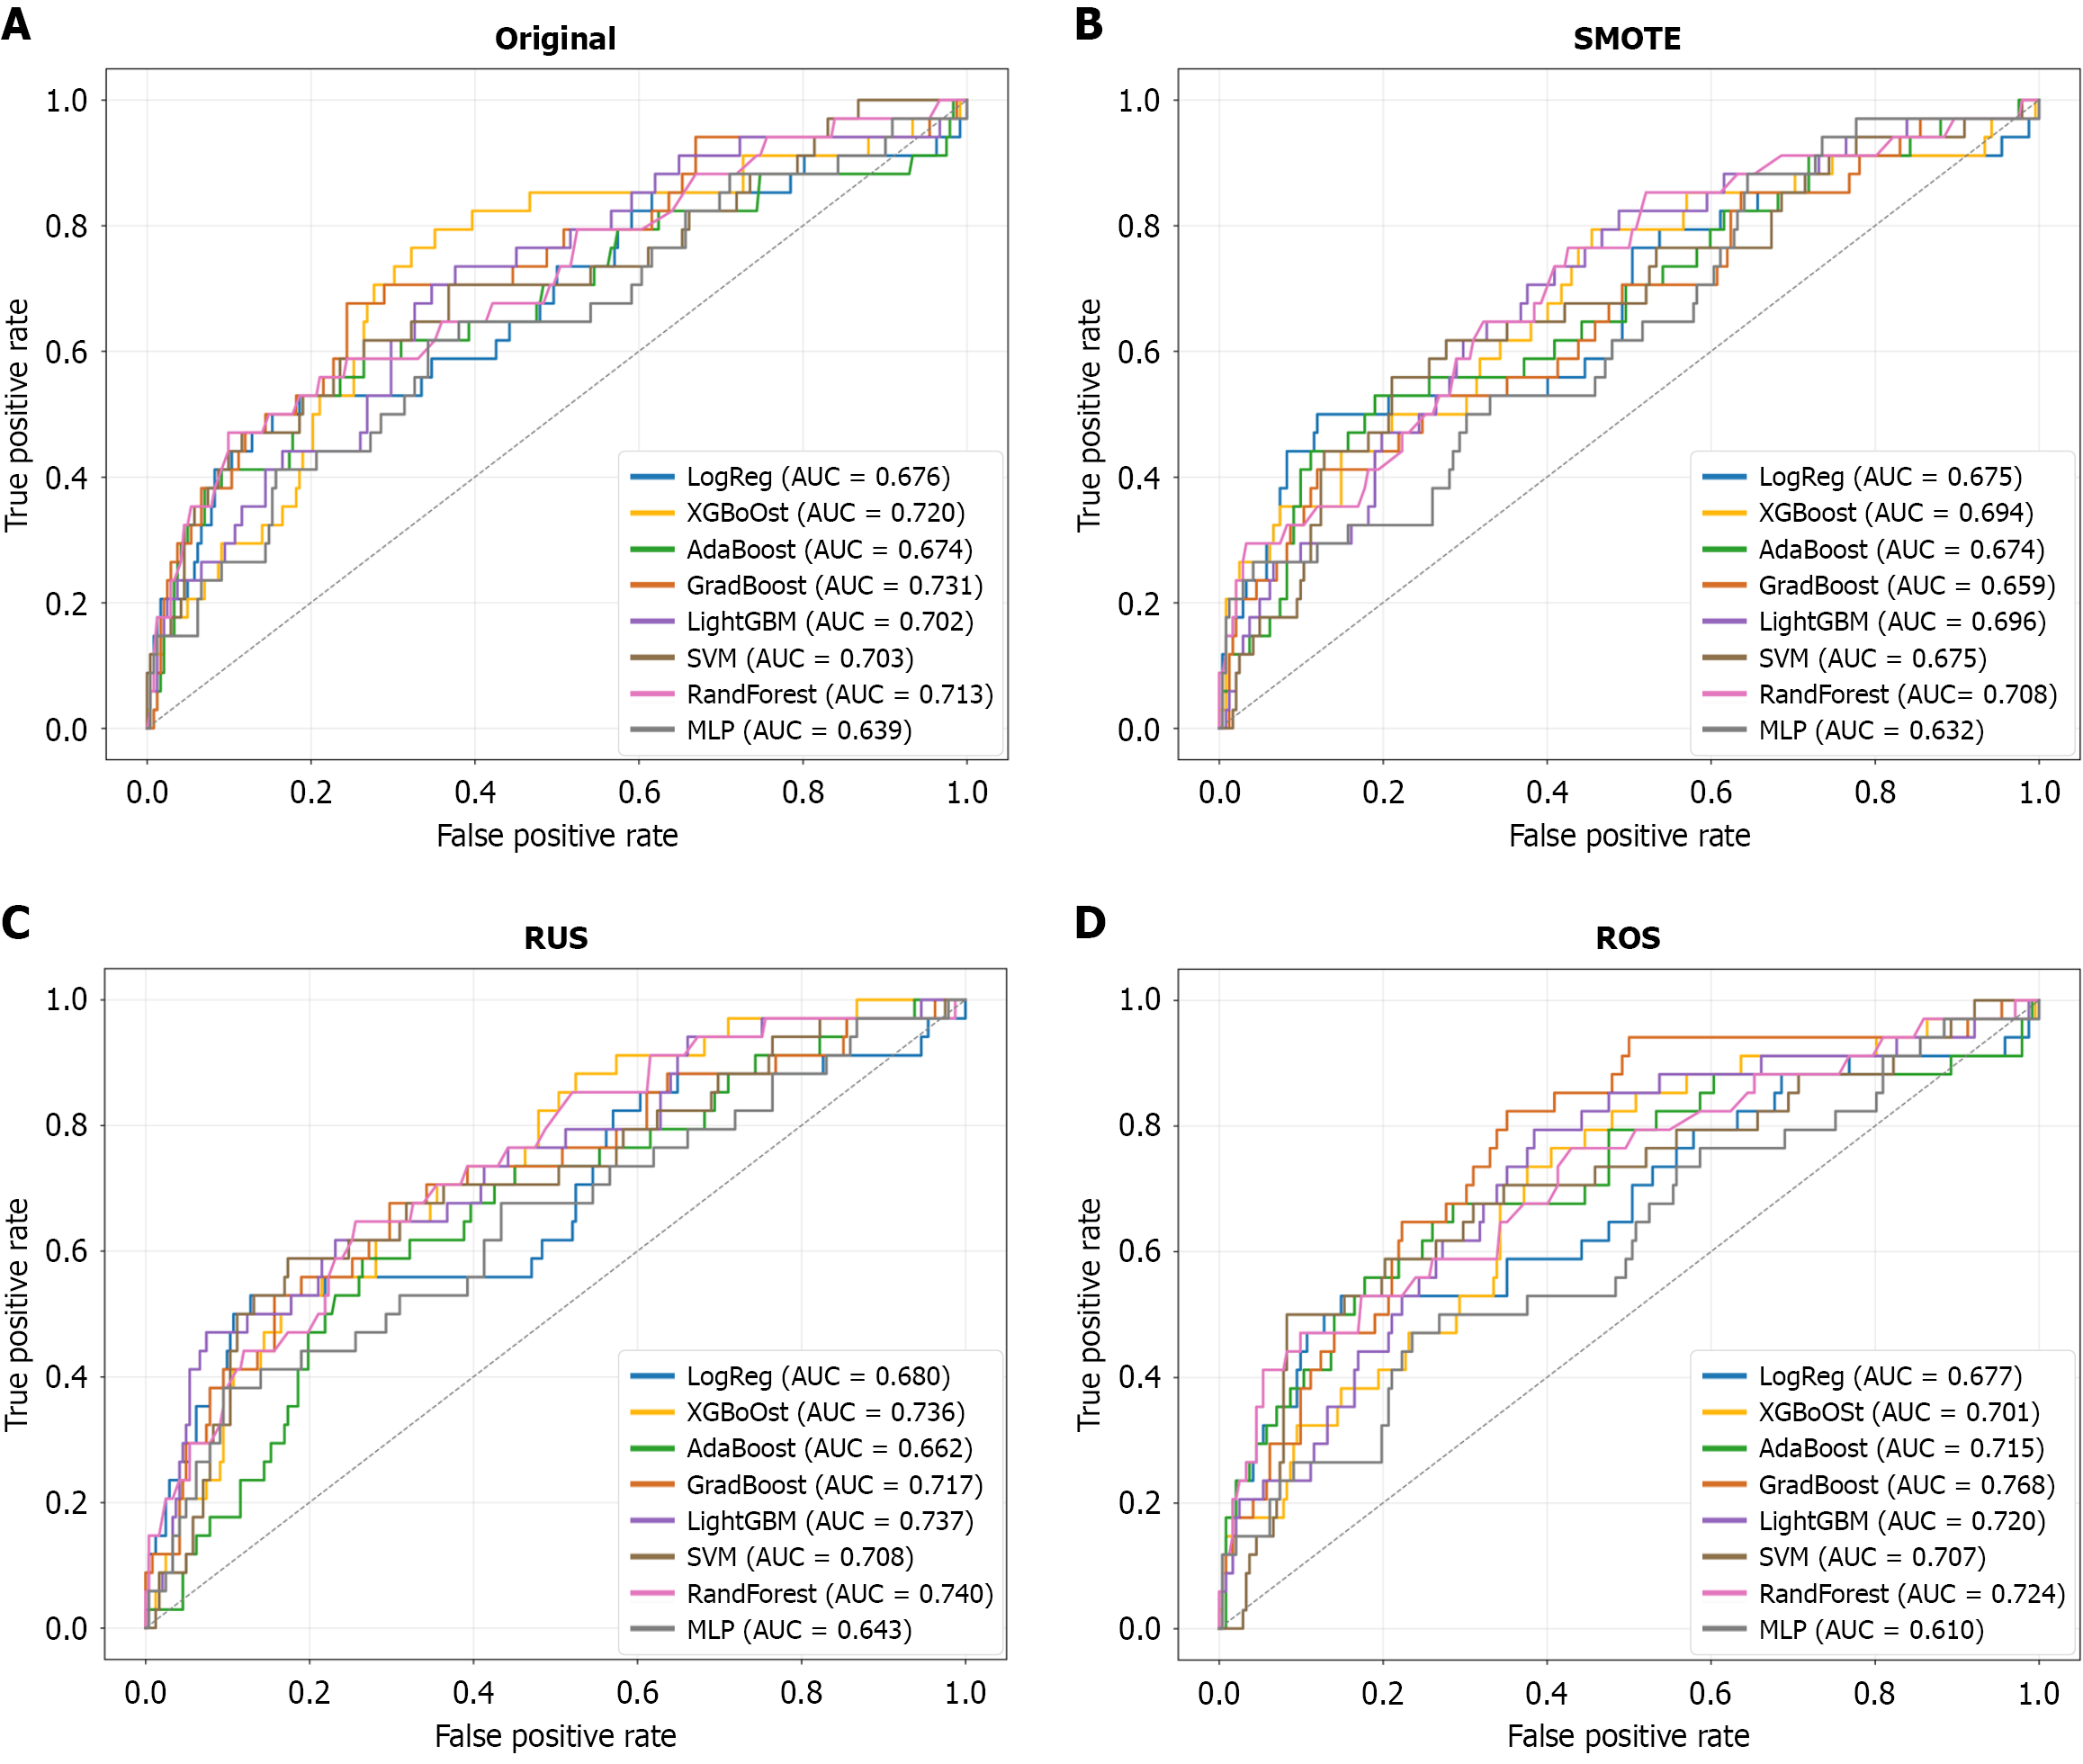
Figure 2 Receiver operating characteristic curves comparing the predictive performance of multiple machine learning models for gestational diabetes mellitus prediction under different class imbalance handling strategies on the independent test set.
A: Original dataset without resampling; B: Synthetic minority oversampling technique; C: Random undersampling; D: Random oversampling. The evaluated models included logistic regression, extreme gradient boosting, adaptive boosting, gradient boosting, light gradient boosting machine, support vector machine, random forest, and multilayer perceptron. The X-axis represents the false positive rate, and the Y-axis represents the true positive rate. The diagonal dashed line indicates random classification performance. The area under the curve values for each model are shown in the corresponding legends. SMOTE: Synthetic minority oversampling technique; RUS: Random undersampling; ROS: Random oversampling; LogReg: Logistic regression; XGBoost: Extreme gradient boosting; AdaBoost: Adaptive boosting; GradBoost: Gradient boosting; LightGBM: Light gradient boosting machine; SVM: Support vector machine; RandForest: Random forest; MLP: Multilayer perceptron; AUC: Area under the curve.
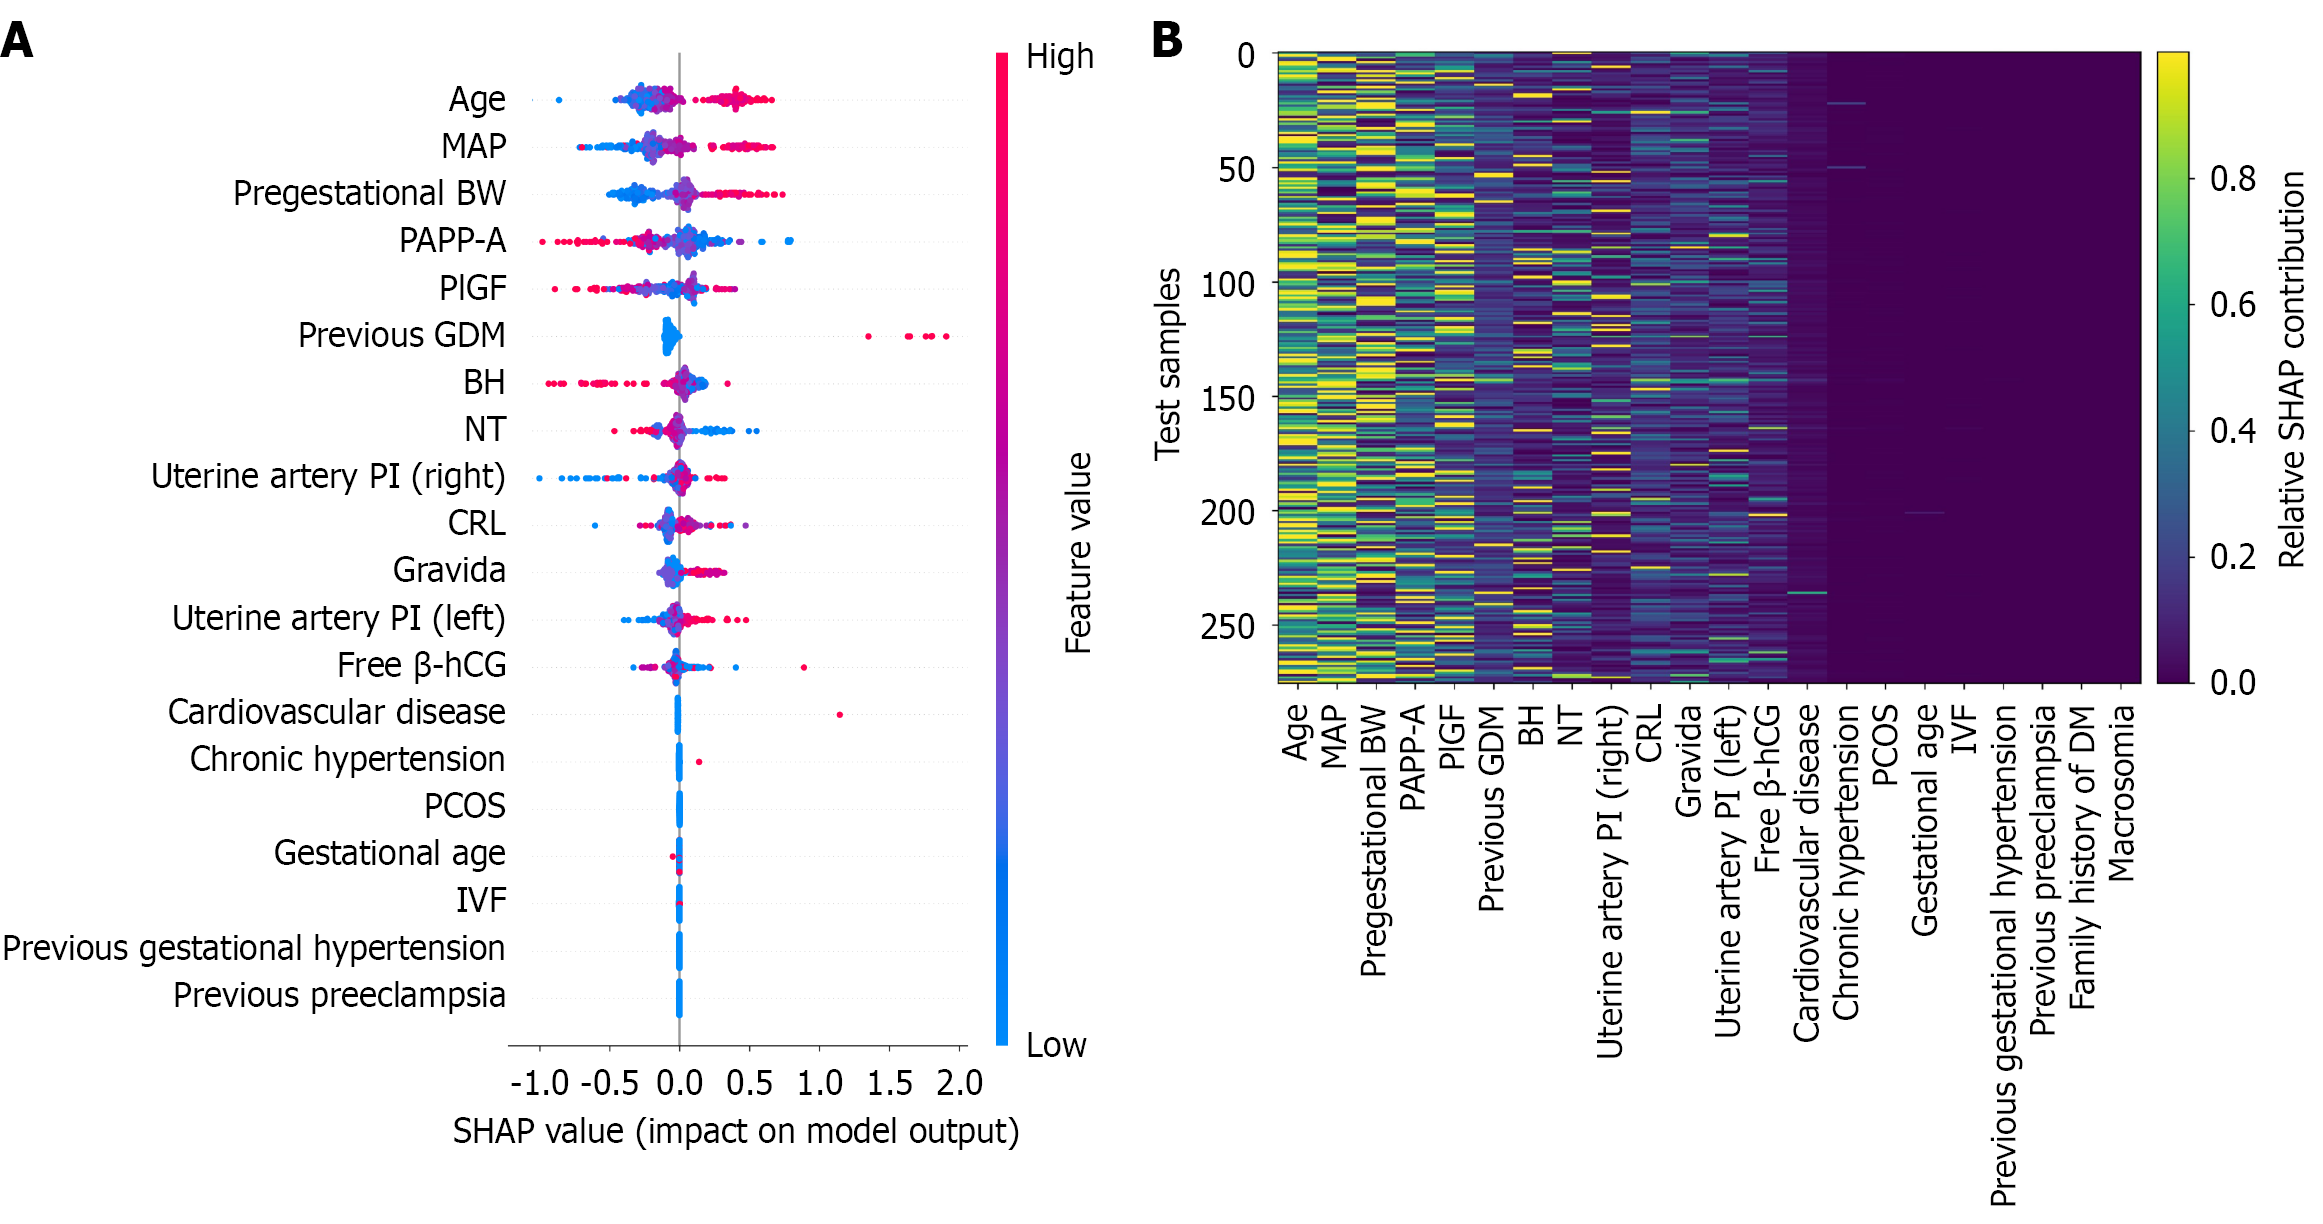
Figure 3 Model interpretability analysis of the gradient boosting model using SHapley Additive exPlanations.
A: SHapley Additive exPlanations summary plot demonstrating the relative contribution and impact of clinical, biochemical, and ultrasound variables on gestational diabetes mellitus prediction; B: Heatmap of SHapley Additive exPlanations values across individual participants, illustrating feature importance patterns and model output distribution. Warmer colors indicate positive contributions to the predicted risk of gestational diabetes mellitus, whereas cooler colors indicate negative contributions. Greater color intensity reflects larger contribution magnitudes. SHAP: SHapley Additive exPlanations; MAP: Mean arterial pressure; BW: Weight; PAPP-A: Pregnancy-associated plasma protein A; PlGF: Placental growth factor; GDM: Gestational diabetes mellitus; BH: Body height; NT: Nuchal translucency; PI: Pulsatility index; CRL: Crown-rump length; β-hCG: β-human chorionic gonadotropin; PCOS: Polycystic ovary syndrome; IVF: In vitro fertilization; DM: Diabetes mellitus.
- Citation: Hung SM, Chen CP, Sun FJ, Chen YY, Wang LK, Chen CY. Early risk stratification of gestational diabetes using interpretable machine learning with first-trimester screening parameters. World J Diabetes 2026; 17(9): 123276
- URL: https://www.wjgnet.com/1948-9358/full/v17/i9/123276.htm
- DOI: https://dx.doi.org/10.4239/wjd.123276