
















Copyright: ©Author(s) 2026.
World J Diabetes. Sep 15, 2026; 17(9): 122779
Published online Sep 15, 2026. doi: 10.4239/wjd.122779
Published online Sep 15, 2026. doi: 10.4239/wjd.122779
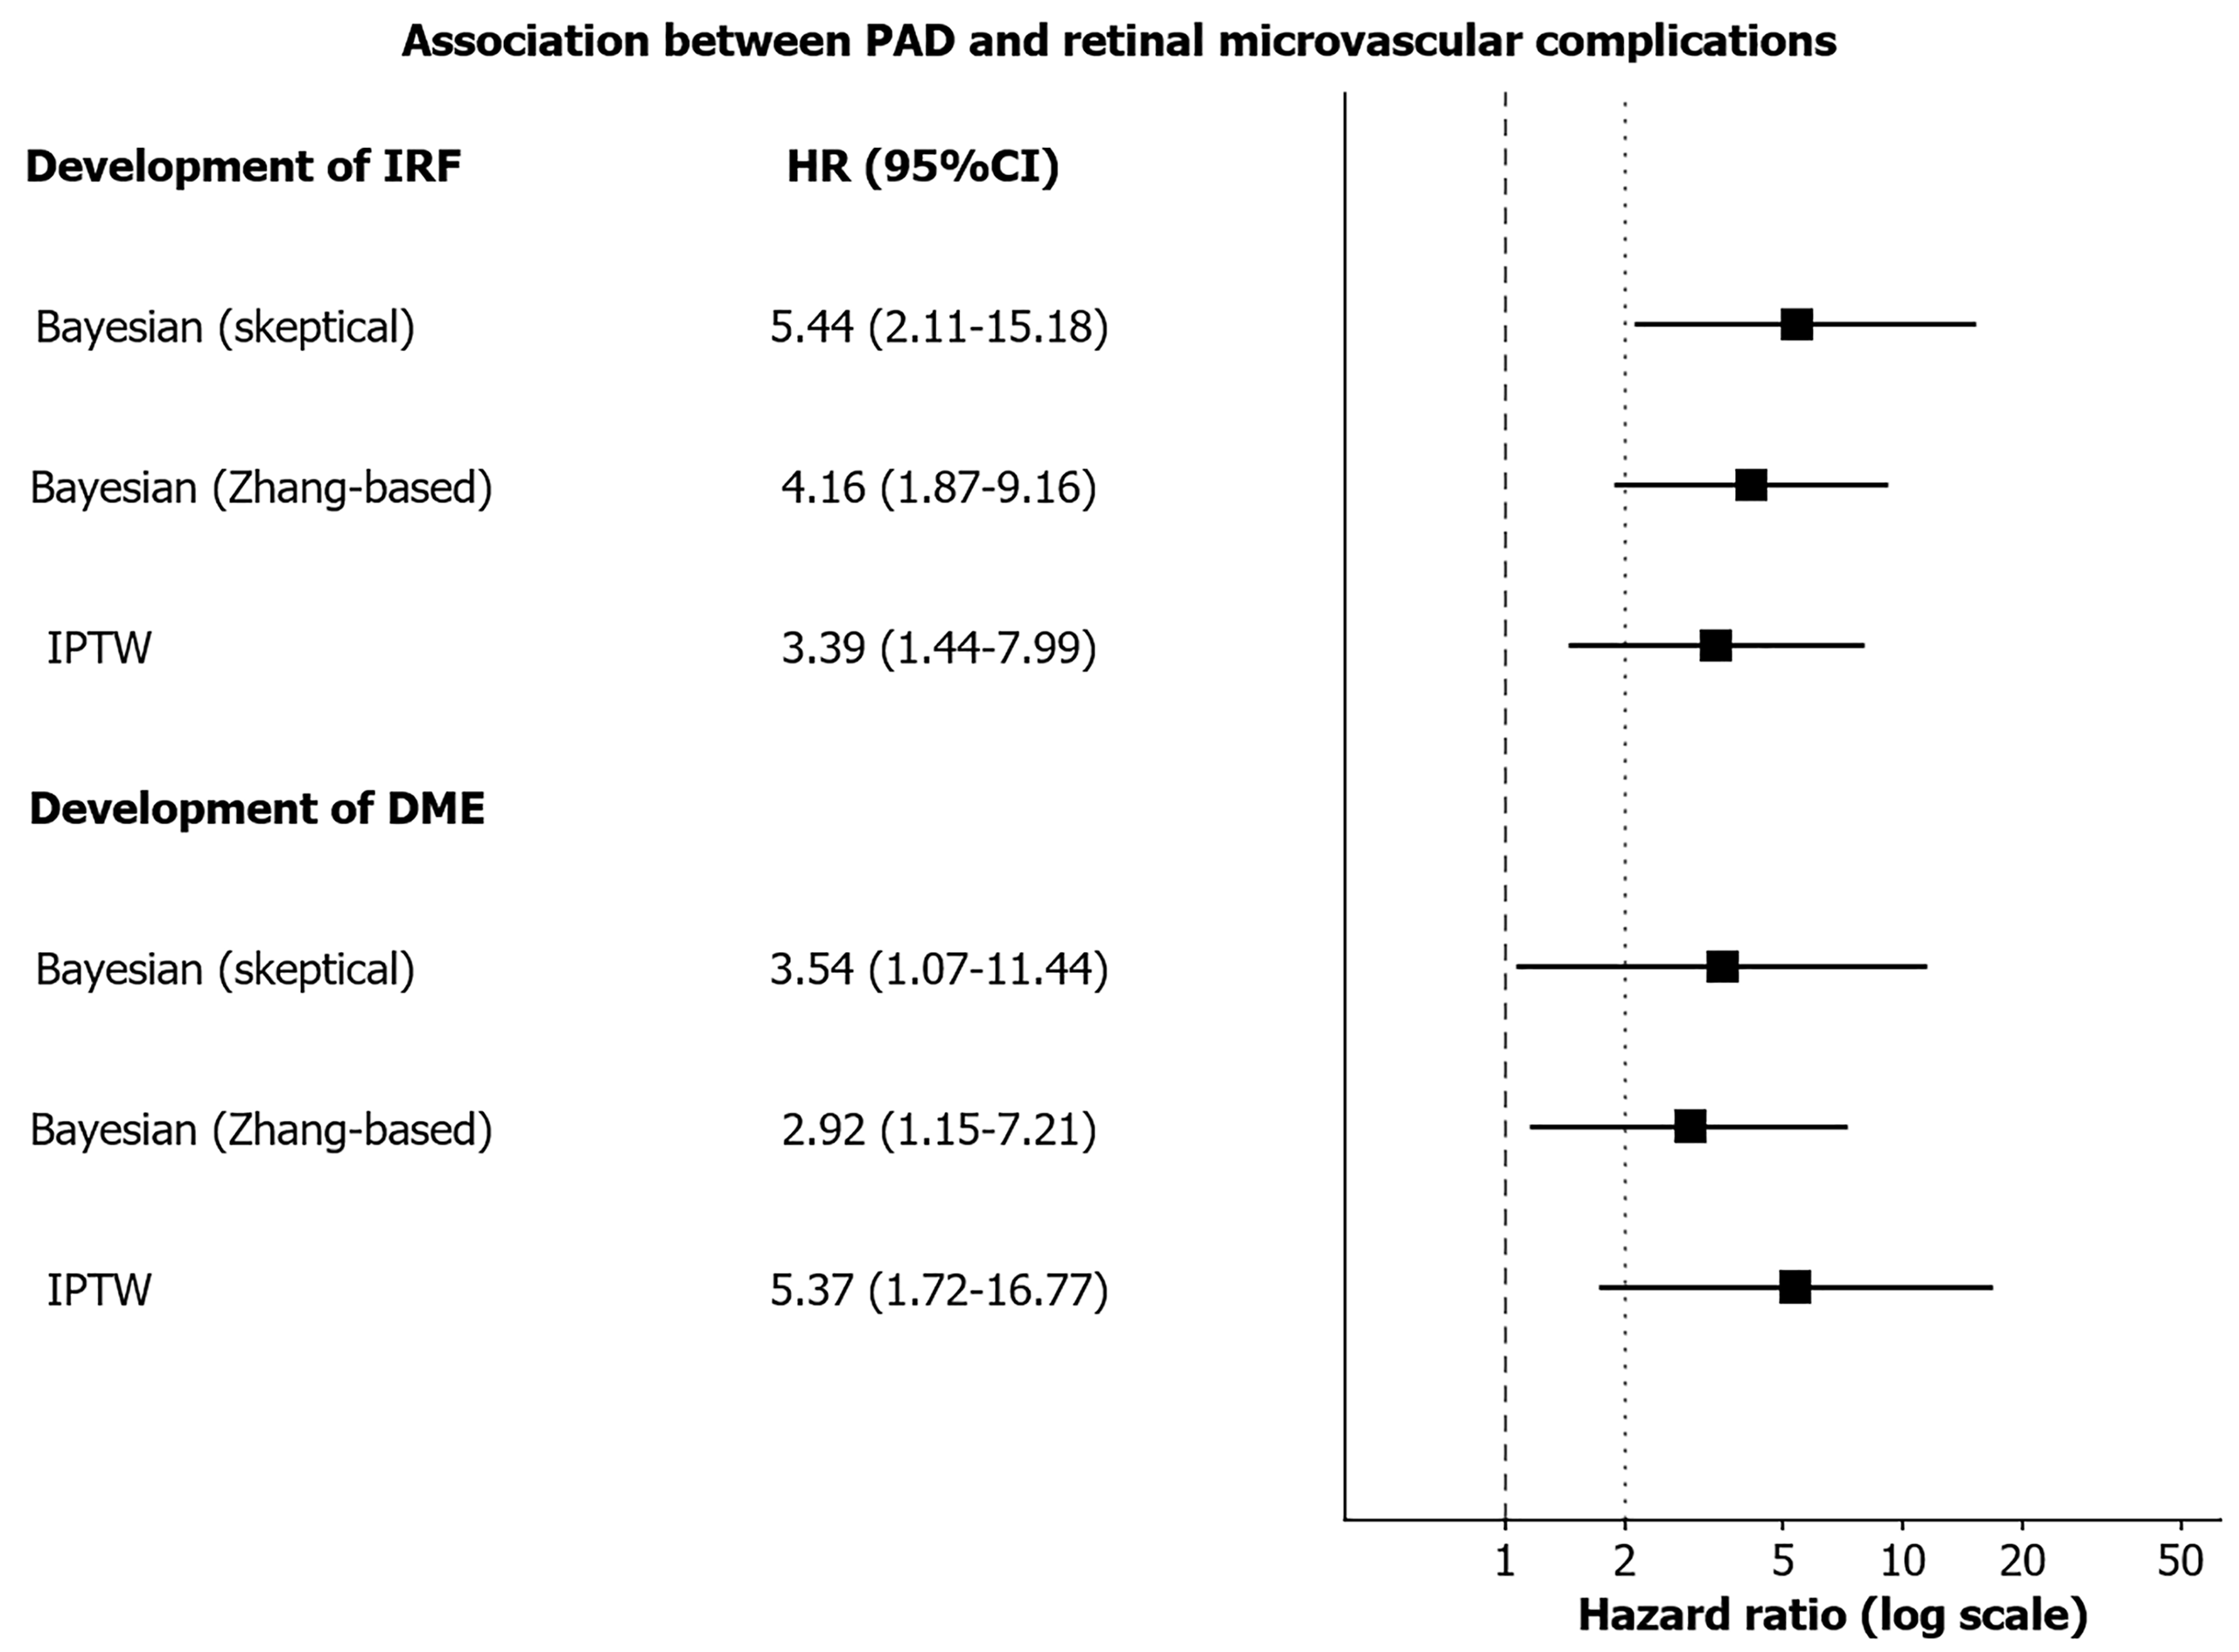
Figure 1 Association between peripheral arterial disease and retinal microvascular complications.
Forest plot showing adjusted hazard ratios for intra-retinal fluid and diabetic macular edema development. Bayesian Cox estimates are shown with 95% credible intervals, whereas inverse probability of treatment weighting estimates are shown with 95% confidence intervals. Three methods: Bayesian Cox with skeptical prior N(0,1) (primary), Bayesian Cox with Zhang-based prior (sensitivity), and inverse probability of treatment weighting (triangulation). Dashed line = hazard ratio 1; dotted line = hazard ratio 2. PAD: Peripheral arterial disease; IRF: Intra-retinal fluid; DME: Diabetic macular edema; IPTW: Inverse probability of treatment weighting; HR: Hazard ratio; CI: Confidence interval.
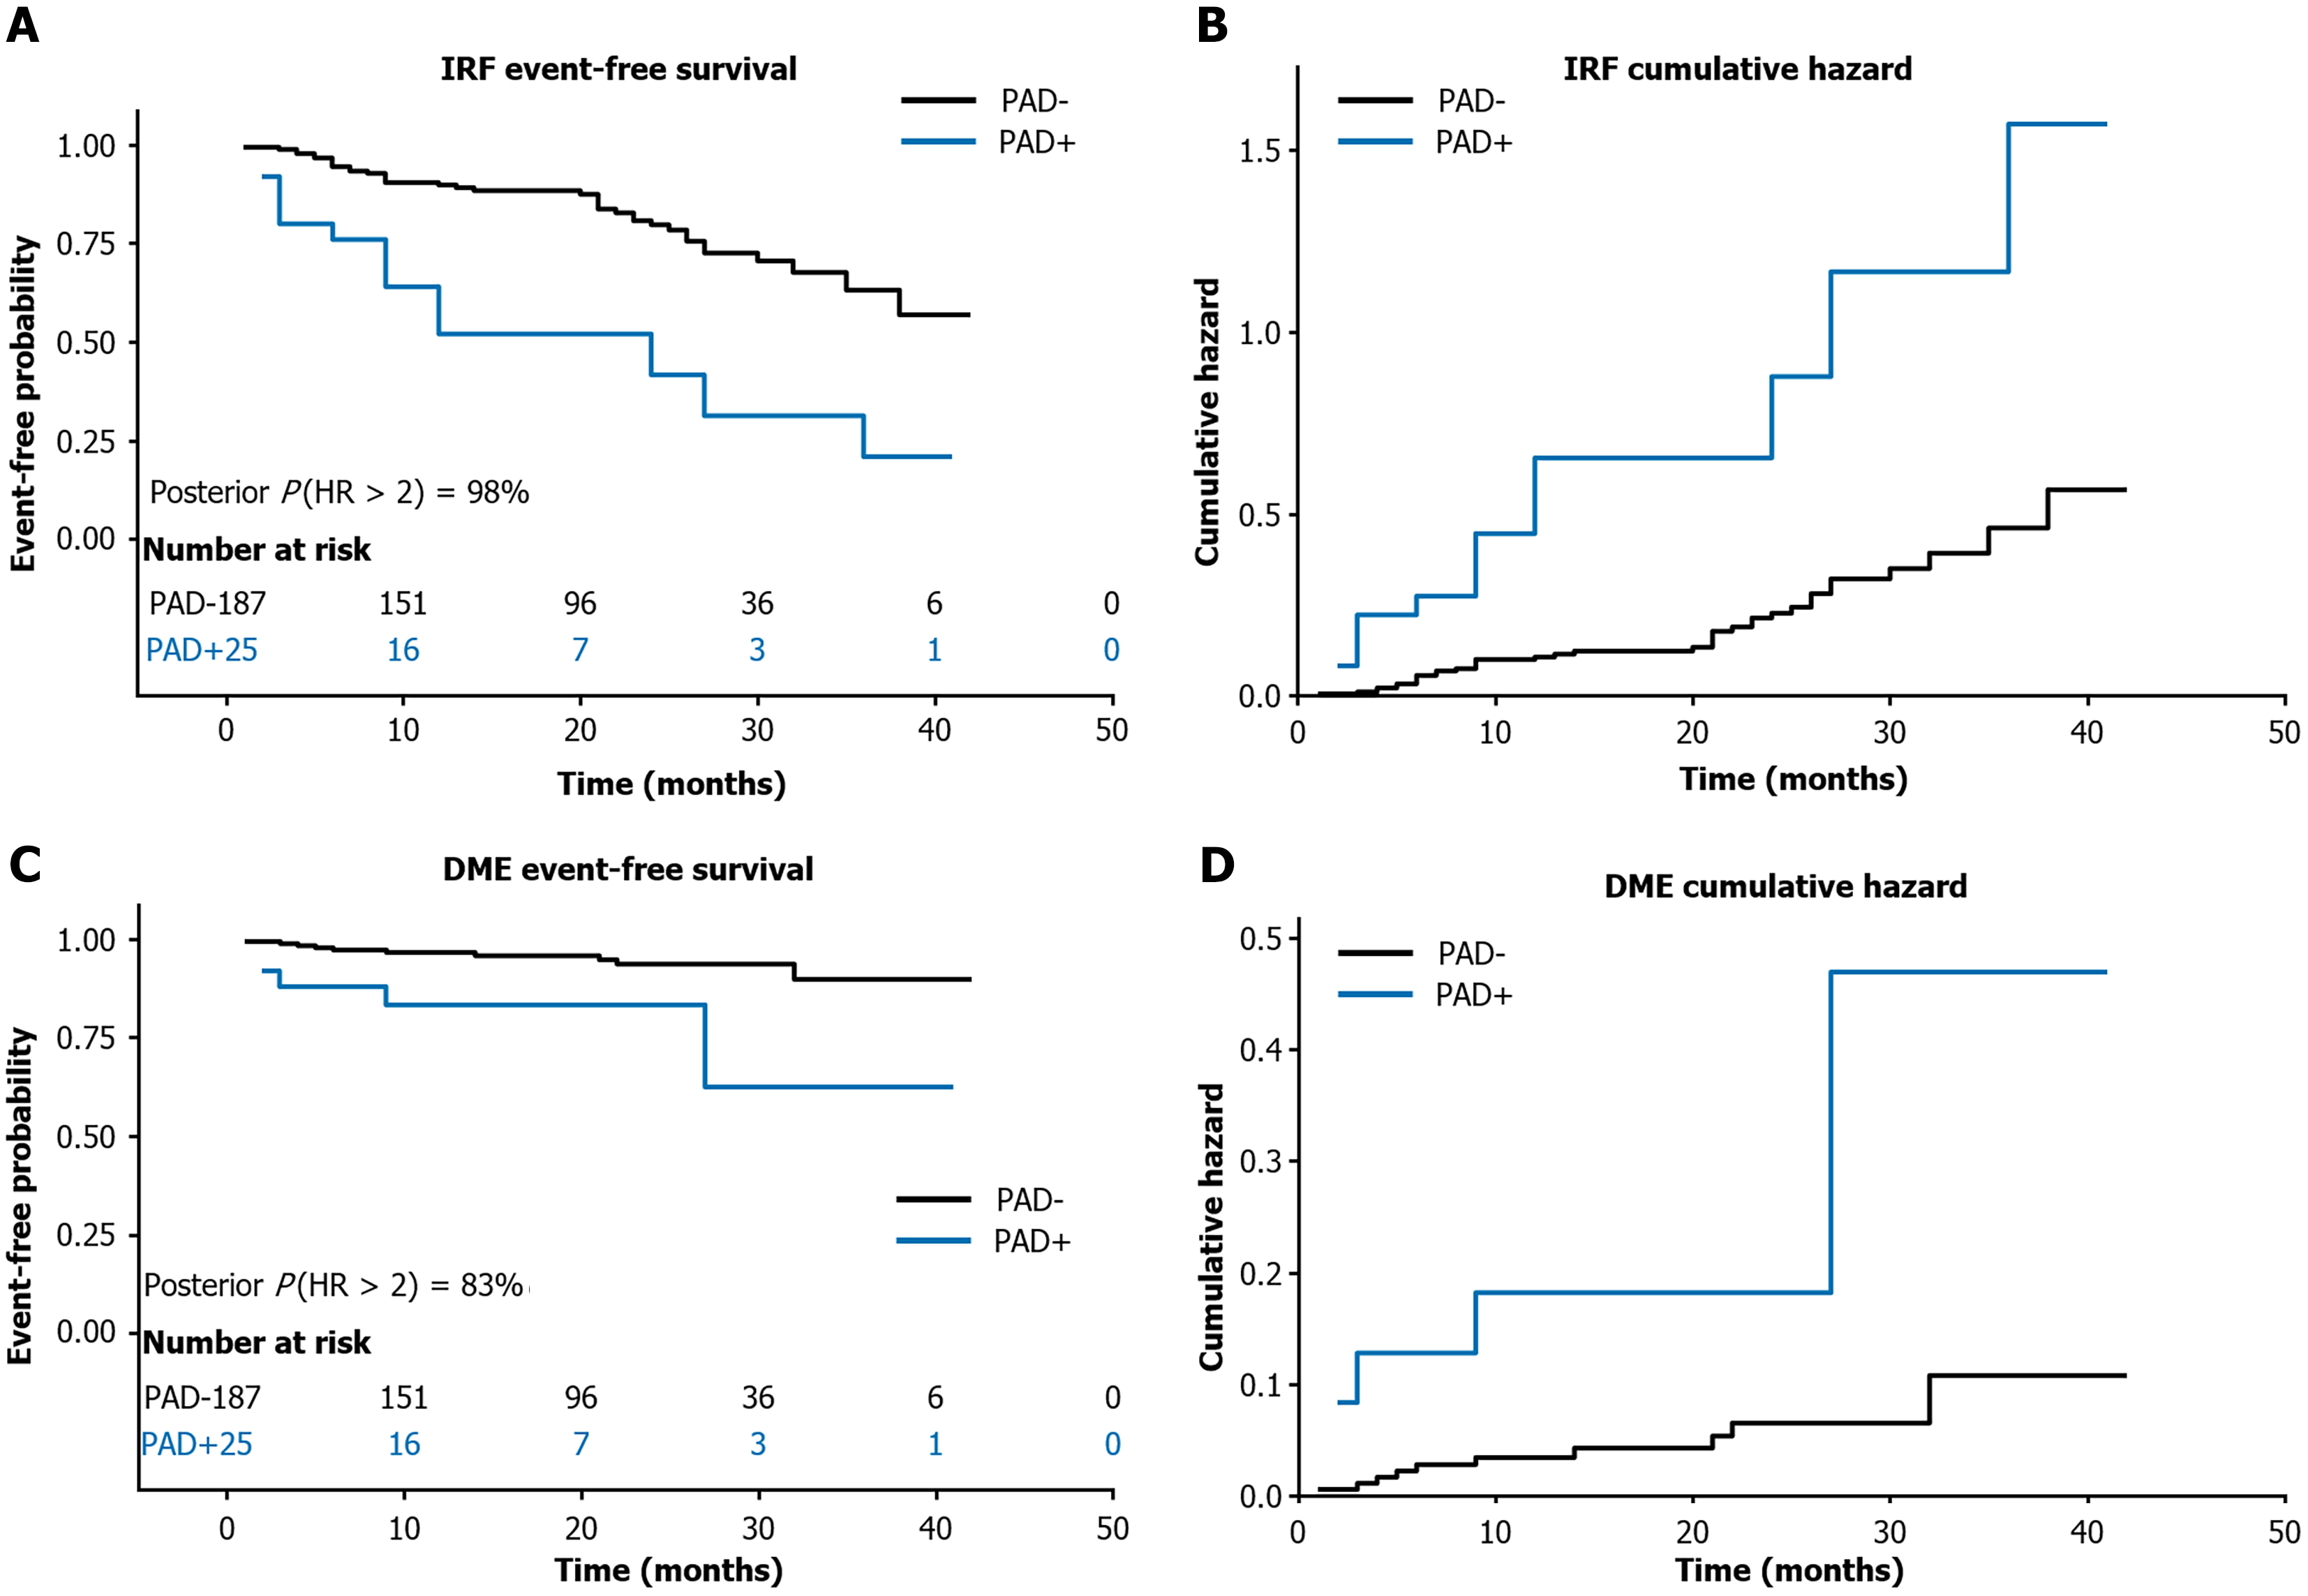
Figure 2 Kaplan-Meier survival curves by peripheral arterial disease status.
A: Intra-retinal fluid event-free survival; B: Intra-retinal fluid cumulative hazard; C: Diabetic macular edema event-free survival; D: Diabetic macular edema cumulative hazard. Black = peripheral arterial disease- (n = 187); blue = peripheral arterial disease + (n = 25). IRF: Intra-retinal fluid; DME: Diabetic macular edema; HR: Hazard ratio; PAD: Peripheral arterial disease.
- Citation: Yang JM, Kwak J, Min SH, Choi SU, Park J, Yon DK, Lee JY, Kim JG, Yoon YH, Kim YJ. Peripheral arterial disease is associated with retinal fluid and microvascular alterations in type 2 diabetes. World J Diabetes 2026; 17(9): 122779
- URL: https://www.wjgnet.com/1948-9358/full/v17/i9/122779.htm
- DOI: https://dx.doi.org/10.4239/wjd.122779