
















Copyright: ©Author(s) 2026.
World J Diabetes. Sep 15, 2026; 17(9): 122555
Published online Sep 15, 2026. doi: 10.4239/wjd.122555
Published online Sep 15, 2026. doi: 10.4239/wjd.122555
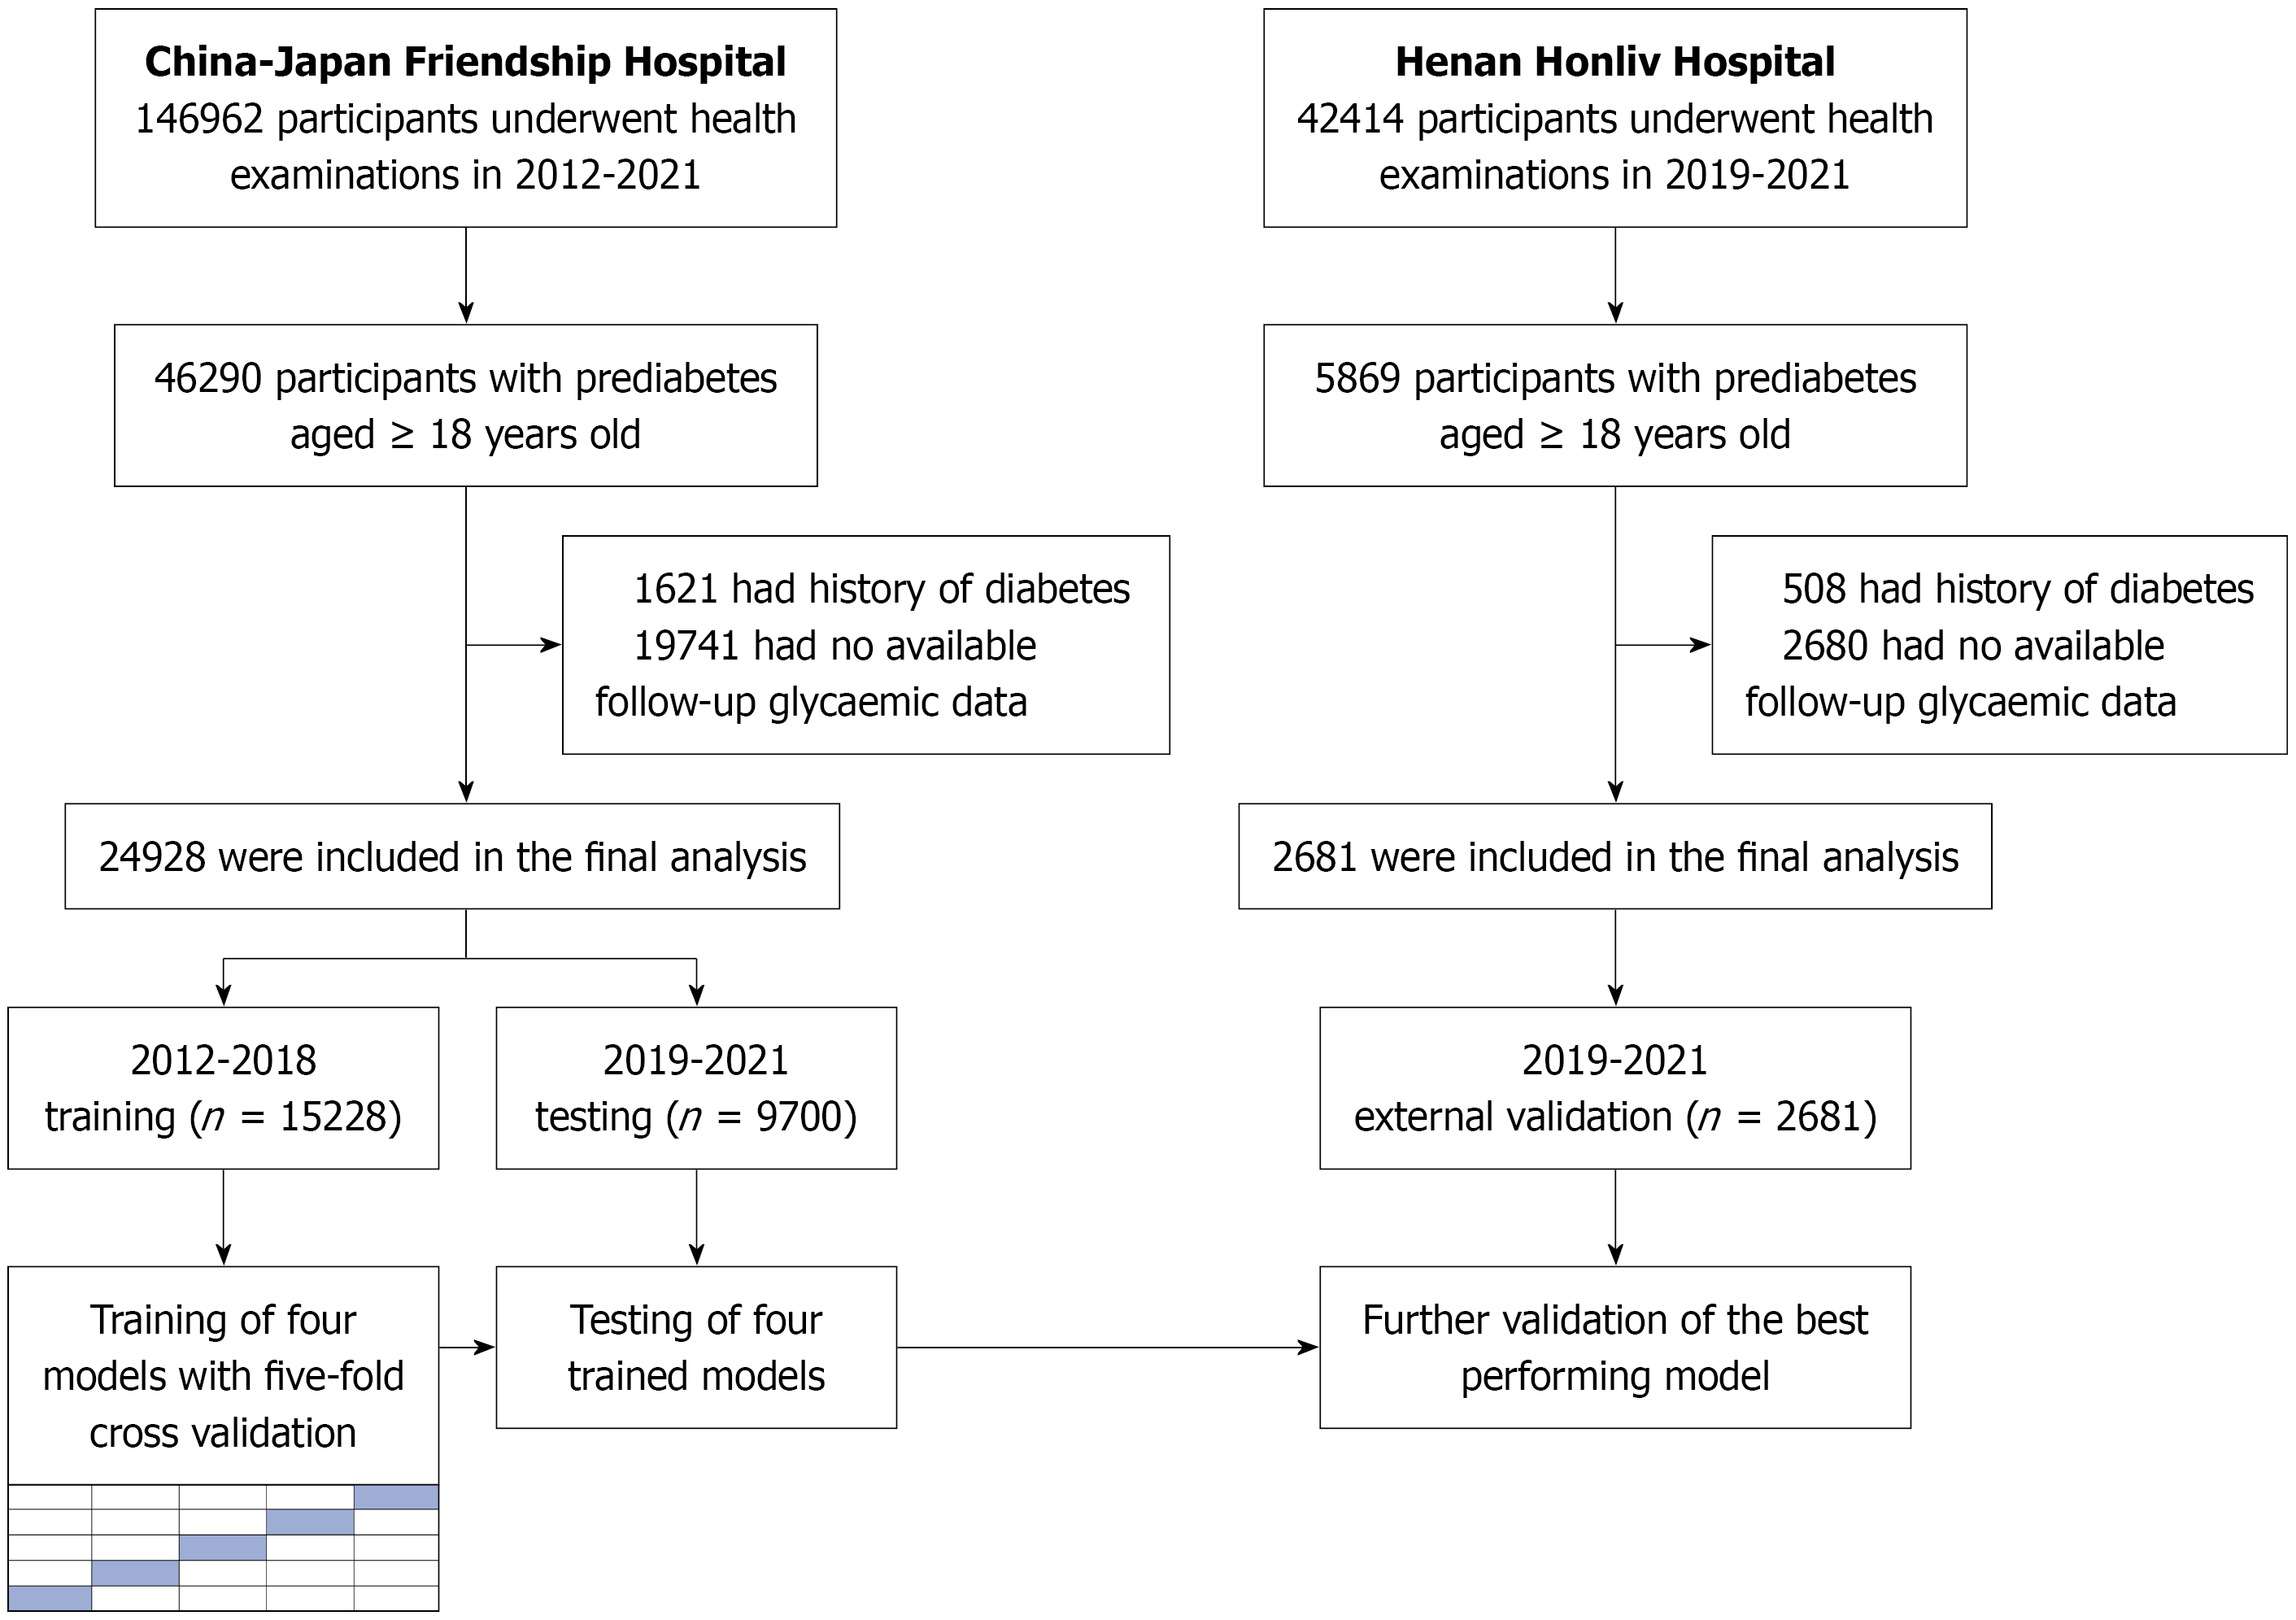
Figure 1
Study flowchart.
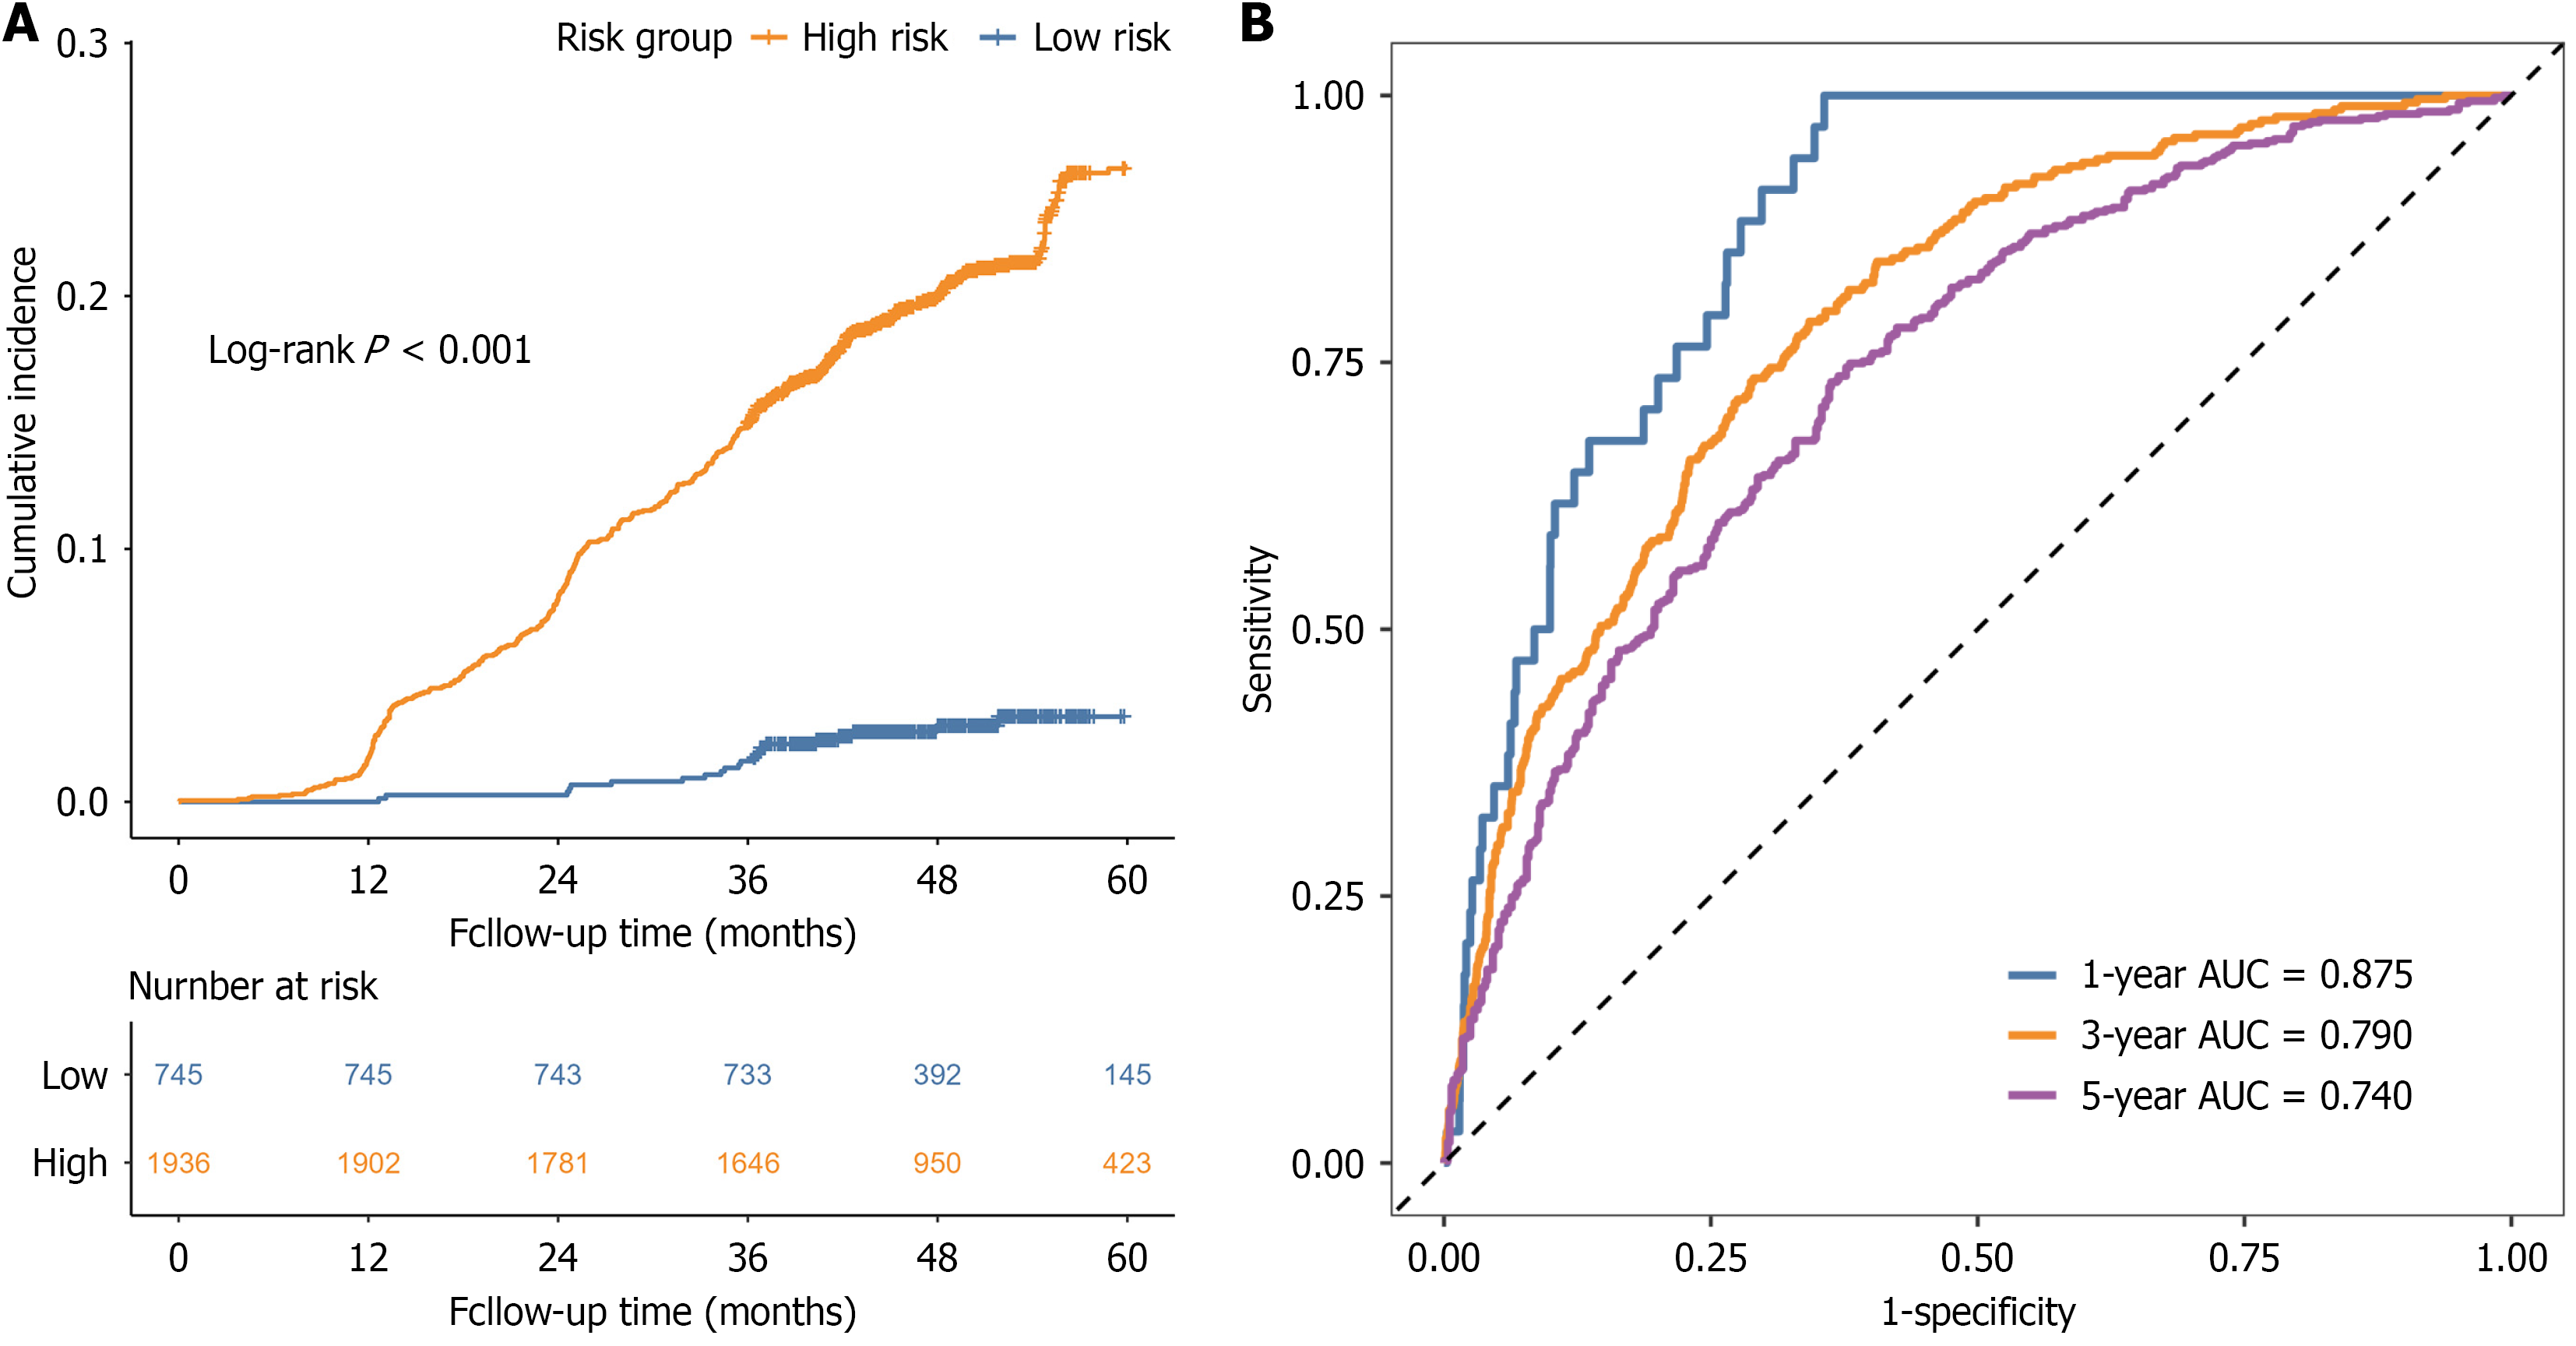
Figure 2 Performance of the gradient boosting survival analysis model in the external validation cohort.
A: Kaplan-Meier curves comparing the cumulative incidence of type 2 diabetes mellitus in the high-risk and low-risk groups; B: Time-dependent receiver operating characteristic curves for predicting 1-year, 3-year, and 5-year progression to type 2 diabetes mellitus. AUC: Area under the curve.
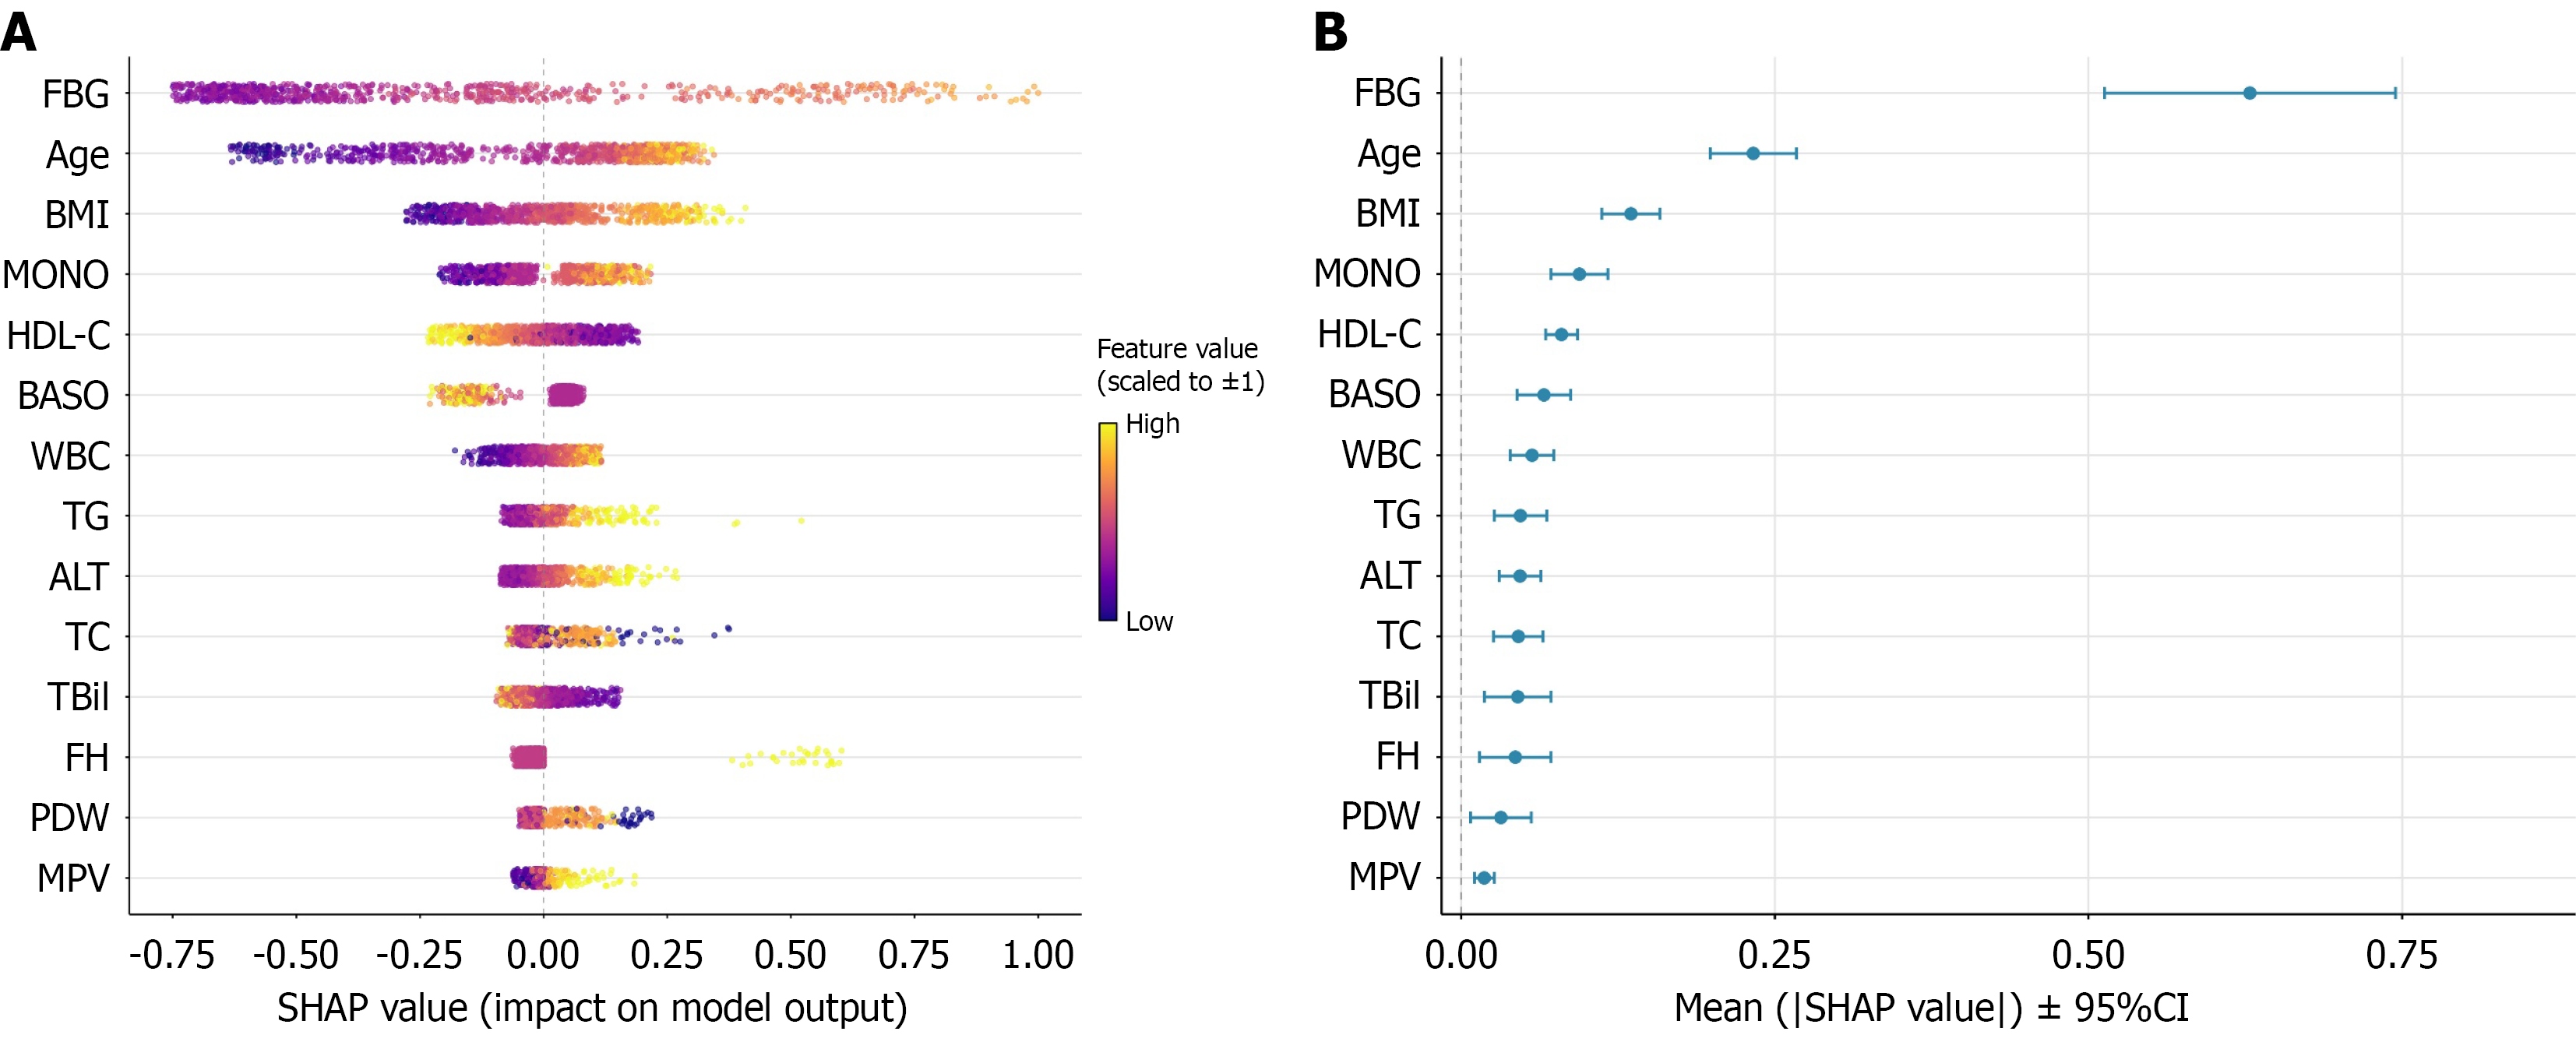
Figure 3 Shapley Additive exPlanations analysis of feature importance for the gradient boosting survival analysis model in the external validation cohort.
A: Beeswarm plot showing the distribution of Shapley Additive exPlanations values for each feature across individuals. Yellow indicates a positive contribution to the predicted risk, while purple indicates a negative contribution; B: Mean absolute Shapley Additive exPlanations values for each feature across 20 imputed datasets, with 95%CI. SHAP: Shapley Additive exPlanations; FBG: Fasting blood glucose; BMI: Body mass index; MONO: Monocyte count; HDL-C: High-density lipoprotein cholesterol; BASO: Basophil count; WBC: White blood cell count; TG: Triglycerides; ALT: Alanine aminotransferase; TC: Total cholesterol; TBil: Total bilirubin; FH: Family history; PDW: Platelet distribution width; MPV: Mean platelet volume.
- Citation: Fan ZY, Ran XH, Wang N, Zhao TY, Li H, Liu X, Wu J, Yang Z, Chen G, Yang L, Ma X. Development and validation of an interpretable machine learning model for predicting progression from prediabetes to type 2 diabetes. World J Diabetes 2026; 17(9): 122555
- URL: https://www.wjgnet.com/1948-9358/full/v17/i9/122555.htm
- DOI: https://dx.doi.org/10.4239/wjd.122555