
















Copyright: ©Author(s) 2026.
World J Diabetes. Sep 15, 2026; 17(9): 120935
Published online Sep 15, 2026. doi: 10.4239/wjd.120935
Published online Sep 15, 2026. doi: 10.4239/wjd.120935
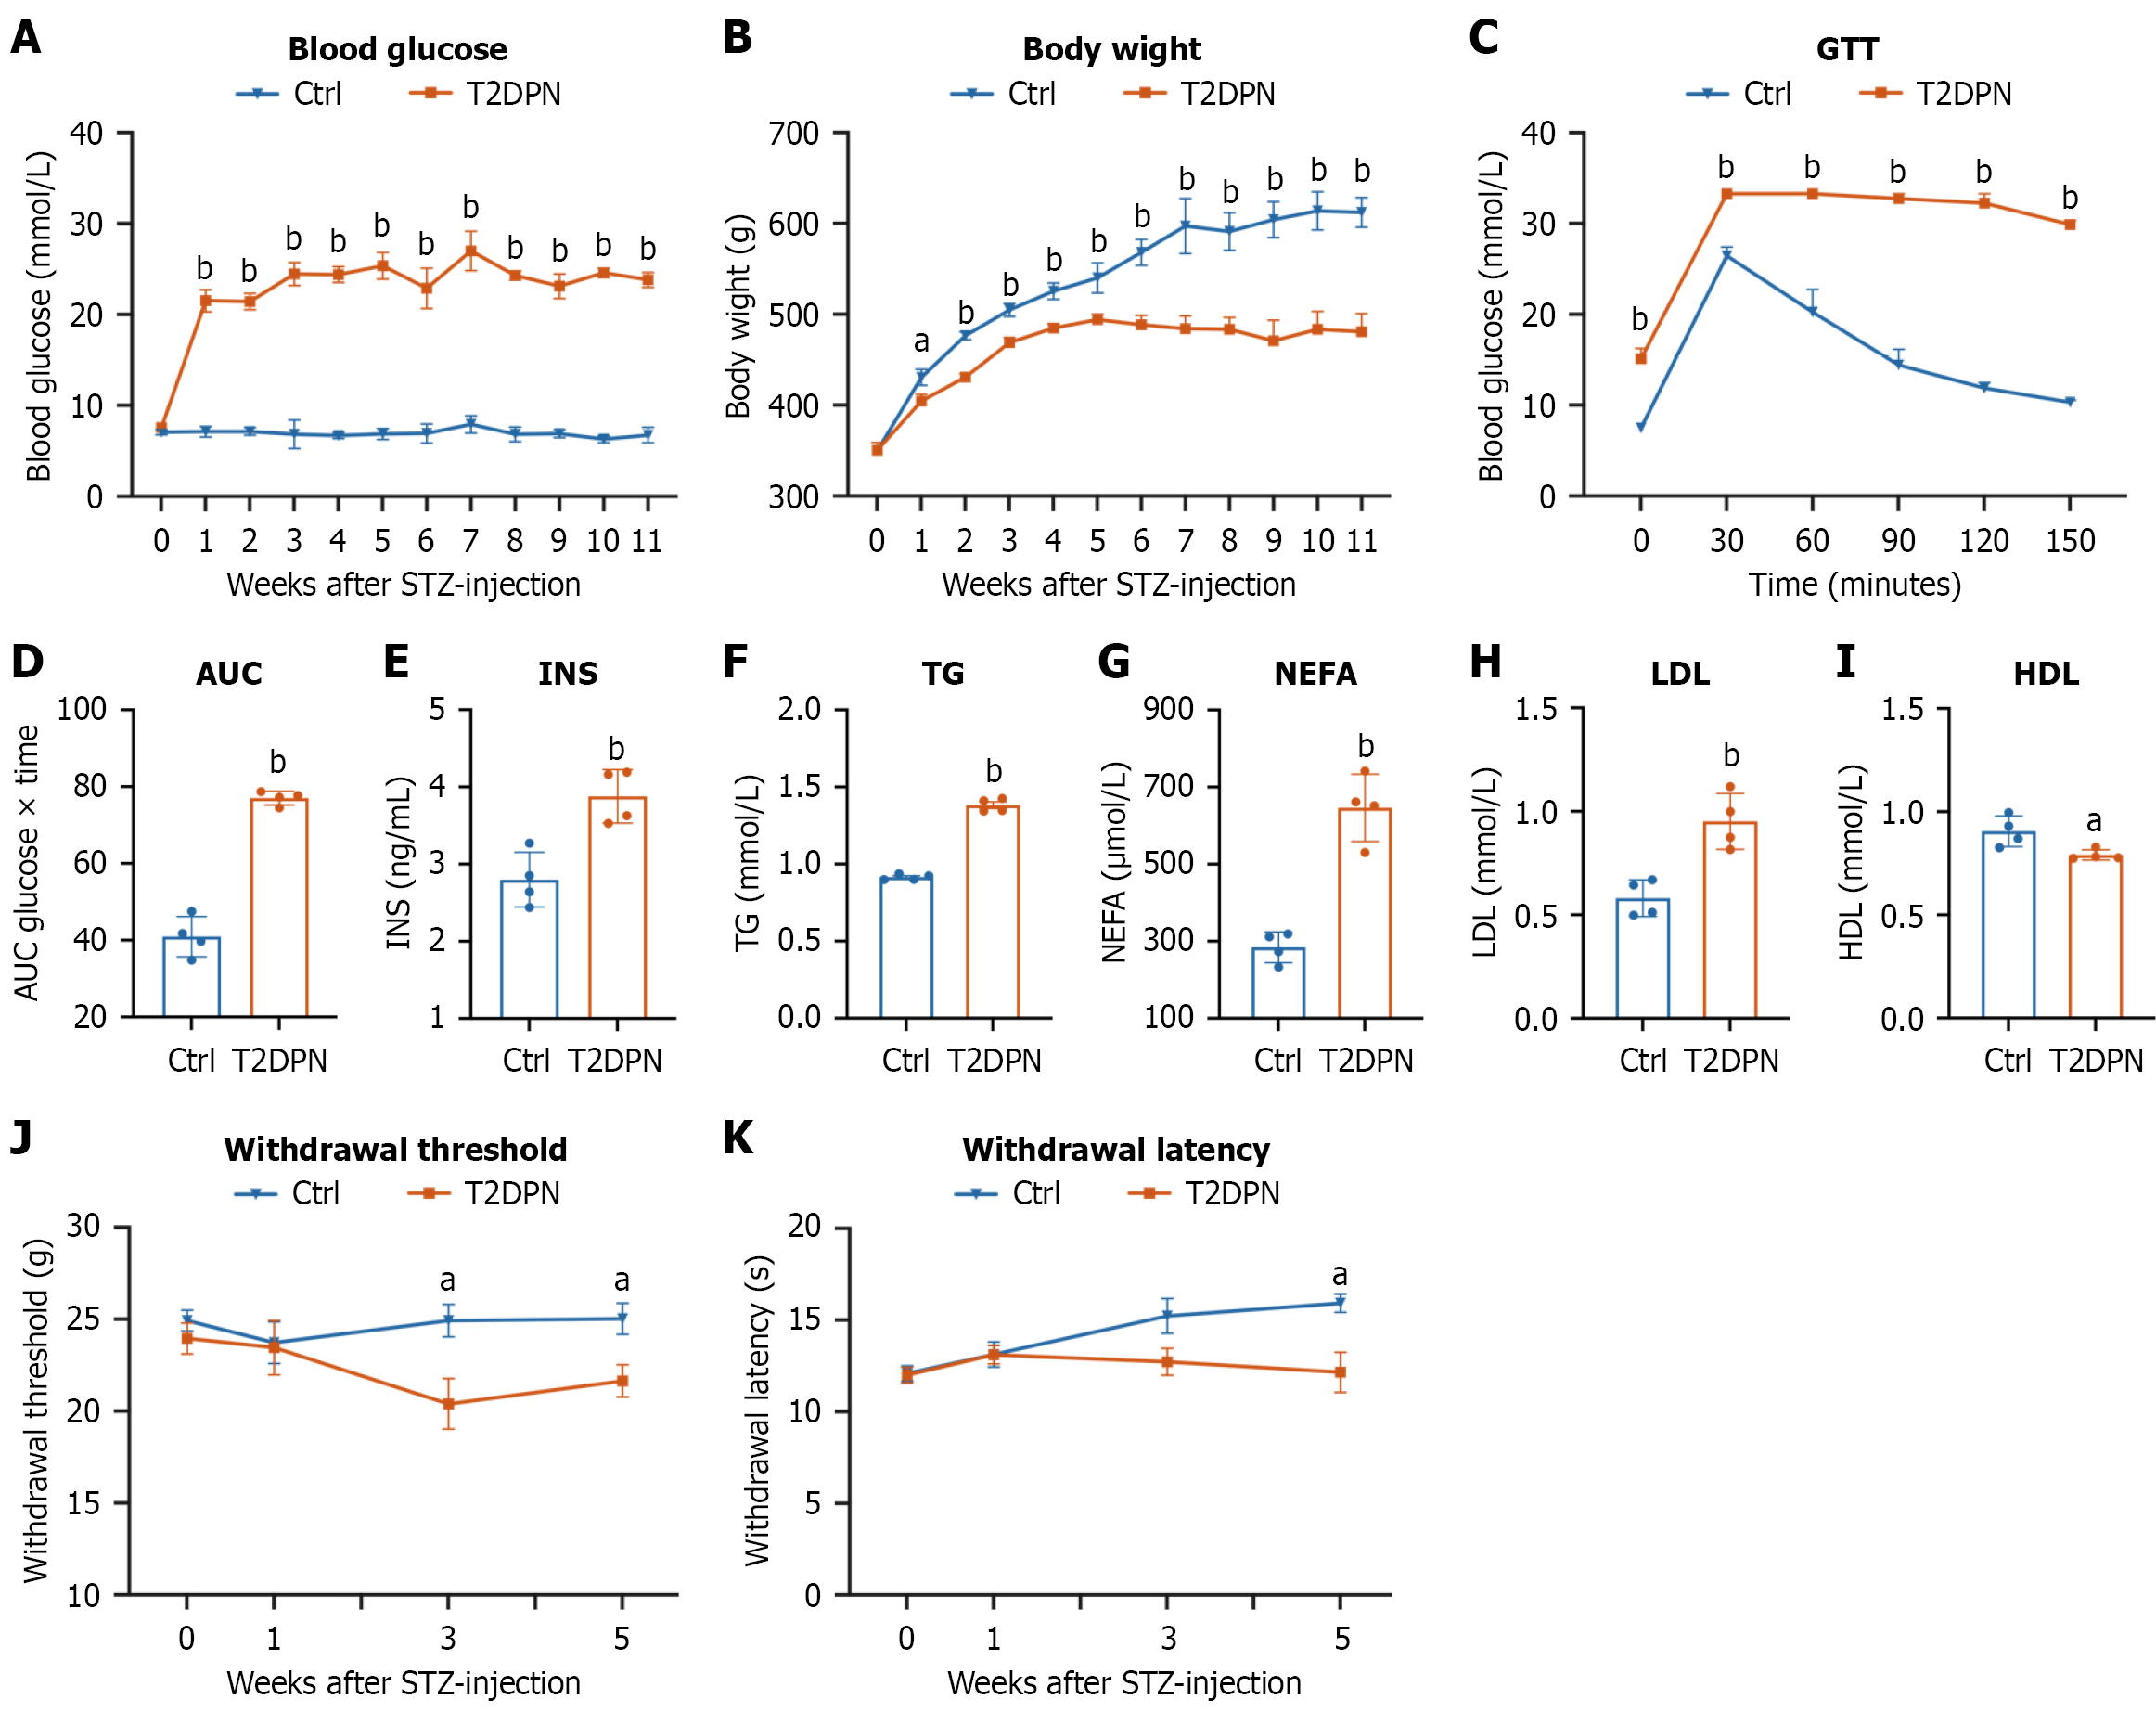
Figure 1 Streptozotocin-high-fat diet-induced rats exhibit significant characteristics of type 2 diabetic peripheral neuropathy.
A and B: Blood glucose (A) and body weight (B) of rats in the control and type 2 diabetic peripheral neuropathy (T2DPN) groups after streptozotocin (STZ) injection; C and D: Glucose tolerance test (C) and the related area under the curve (D) in the control and T2DPN groups; E-I: Serum levels of insulin (E), triglyceride (F), non-esterified fatty acid (G), low-density lipoprotein (H), and high-density lipoprotein (I) in the control and T2DPN groups; J: Withdrawal threshold; K: Withdrawal latency after STZ injection. Data are presented as mean ± SEM (n = 4). aP < 0.05. bP < 0.01. P indicated type 2 diabetic peripheral neuropathy group vs control group. STZ: Streptozotocin; T2DPN: Type 2 diabetic peripheral neuropathy; GTT: Glucose tolerance test; AUC: Area under the curve; Ctrl: Control; INS: Insulin; TG: Triglyceride; NEFA: Non-esterified fatty acid; LDL: Low-density lipoprotein; HDL: High-density lipoprotein.
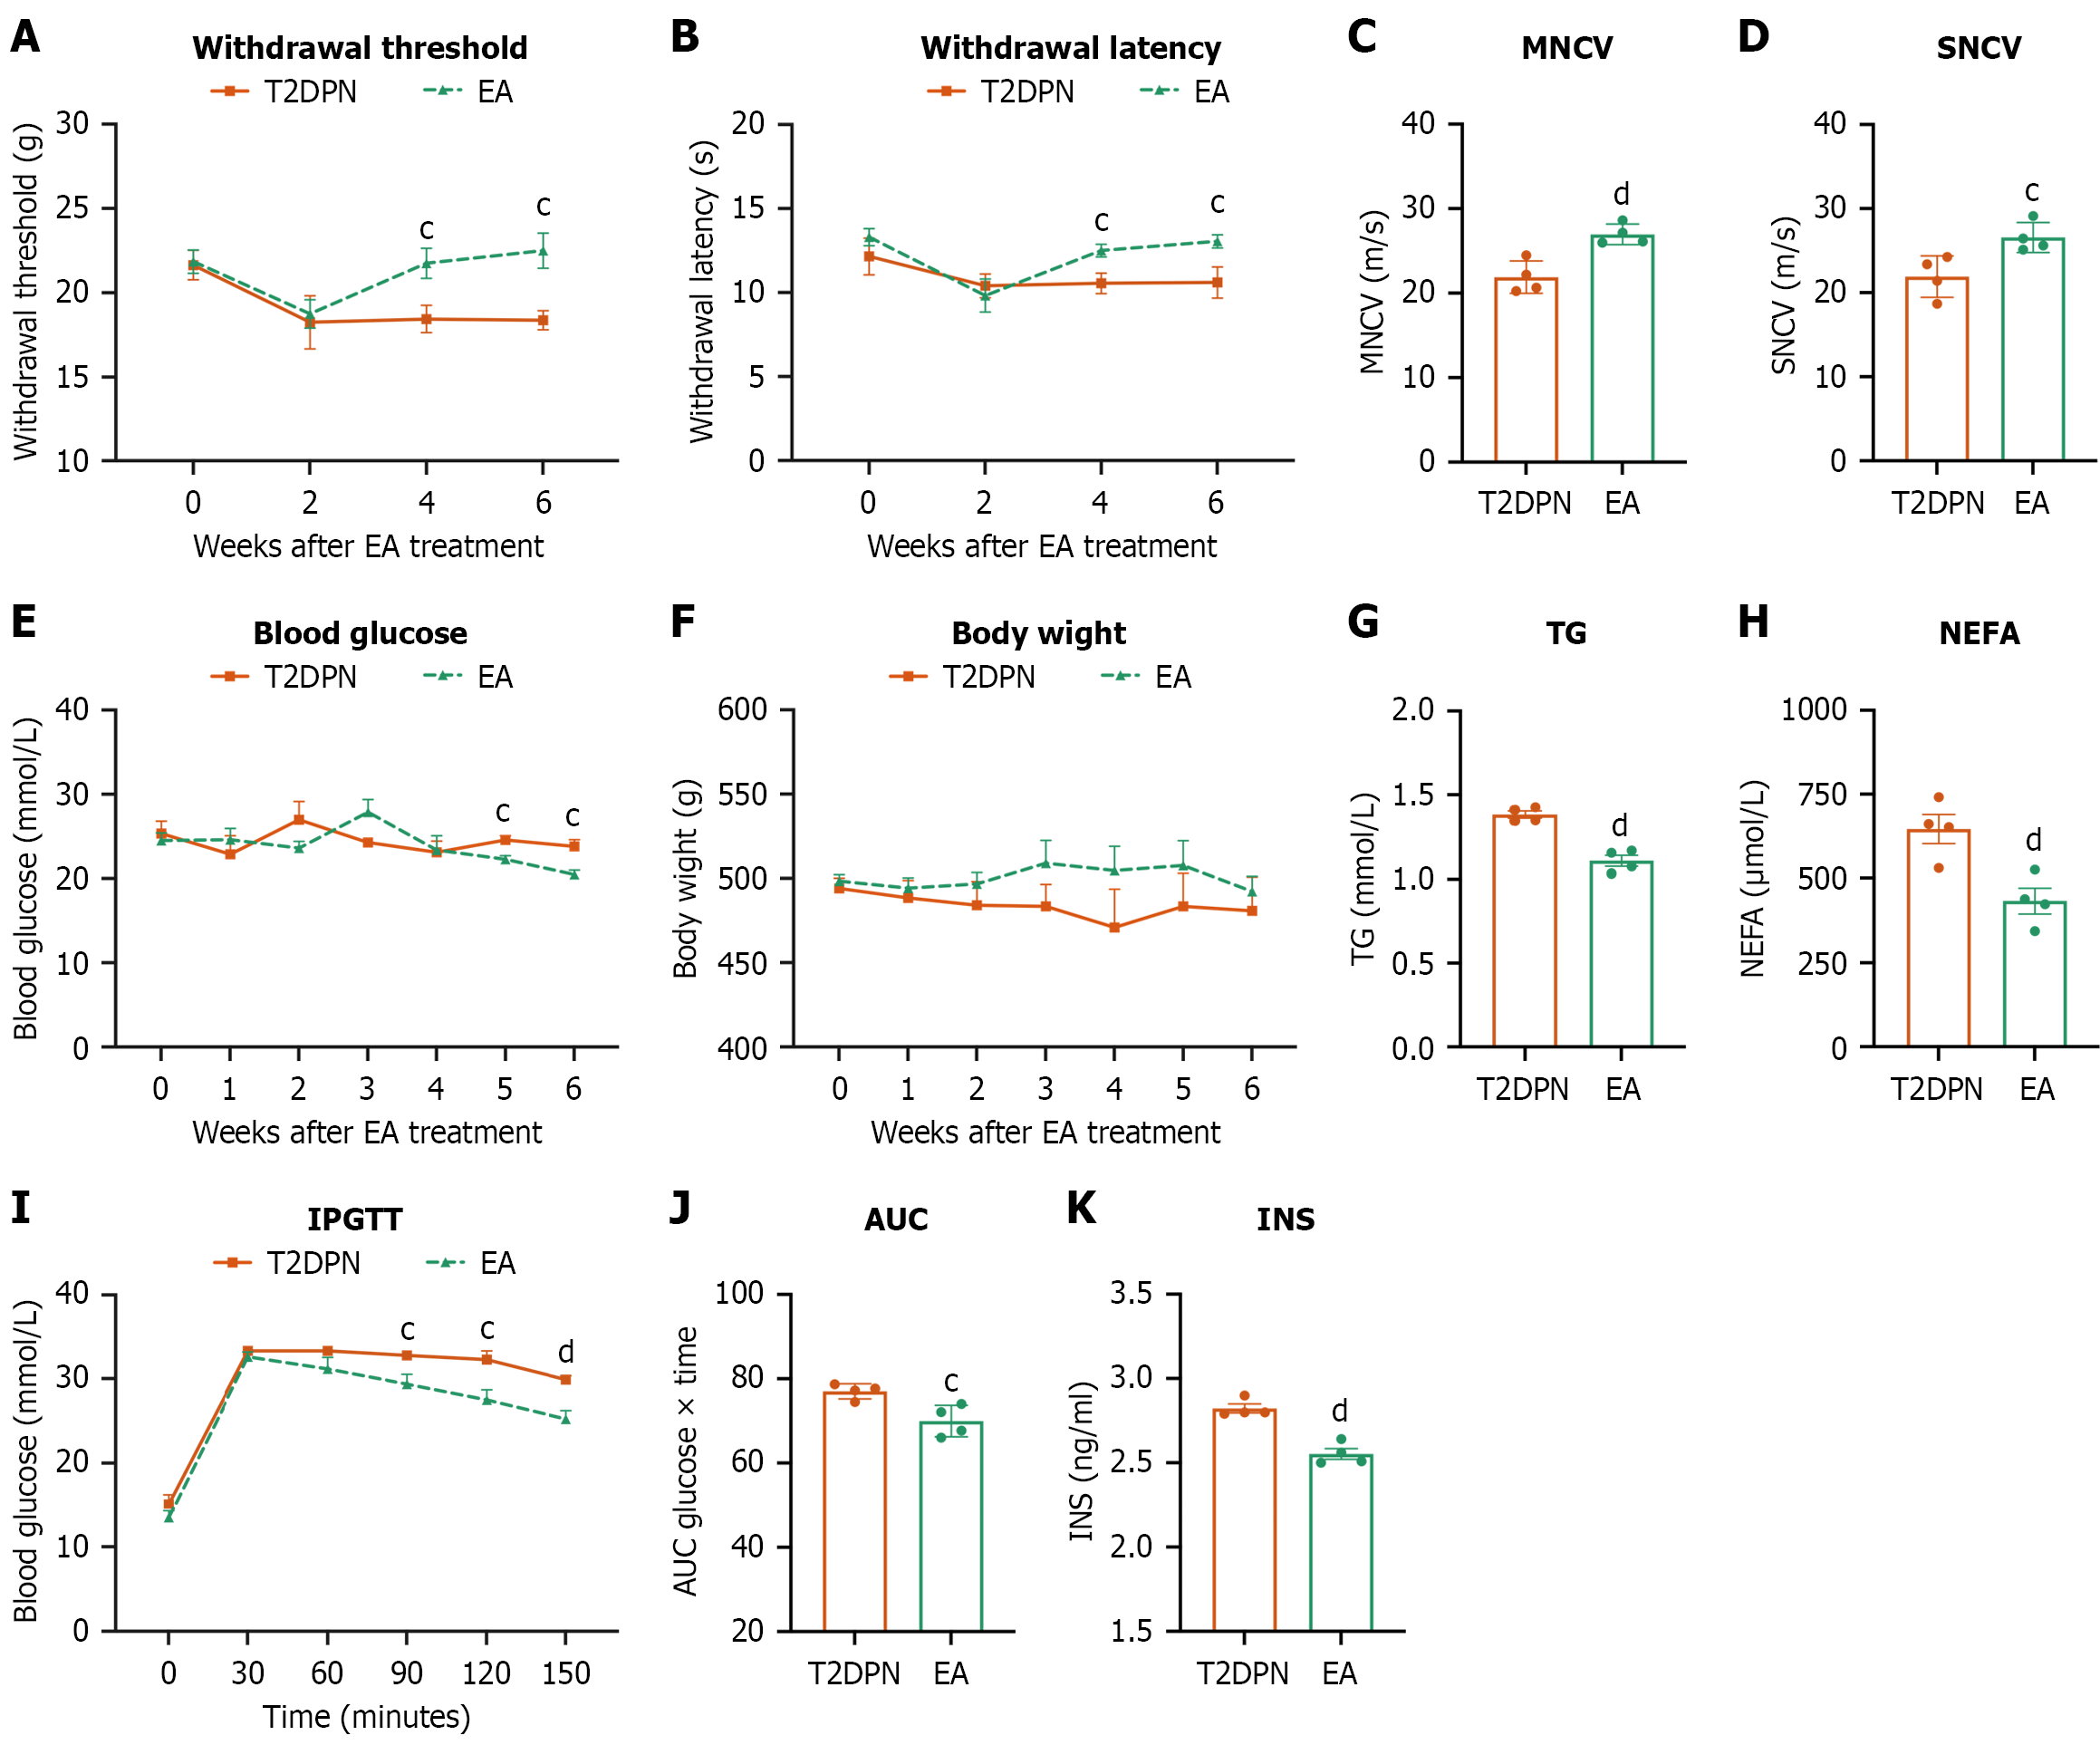
Figure 2 Electroacupuncture treatment has regulatory effect on peripheral neuropathy and metabolic disorders in streptozotocin-high-fat diet-induced rats.
A-D: Behavioral and neurological function was assessed by withdrawal threshold (A), withdrawal latency (B), motor nerve conduction velocities (C), and sensory nerve conduction velocities (D) in different groups after electroacupuncture (EA) treatment; E-K: Basic metabolic indices included blood glucose (E), body weight (F), triglyceride (G), non-esterified fatty acid (H), intraperitoneal glucose tolerance test (I) and area under the curve (J), and insulin (K) in different groups after EA treatment. Data are presented as mean ± SEM (n = 4). cP < 0.05. dP < 0.01. P indicated electroacupuncture group vs type 2 diabetic peripheral neuropathy group. T2DPN: Type 2 diabetic peripheral neuropathy; EA: Electroacupuncture; MNCV: Motor nerve conduction velocities; SNCV: Sensory nerve conduction velocities; TG: Triglyceride; NEFA: Non-esterified fatty acid; IPGTT: Intraperitoneal glucose tolerance test; AUC: Area under the curve; INS: Insulin.
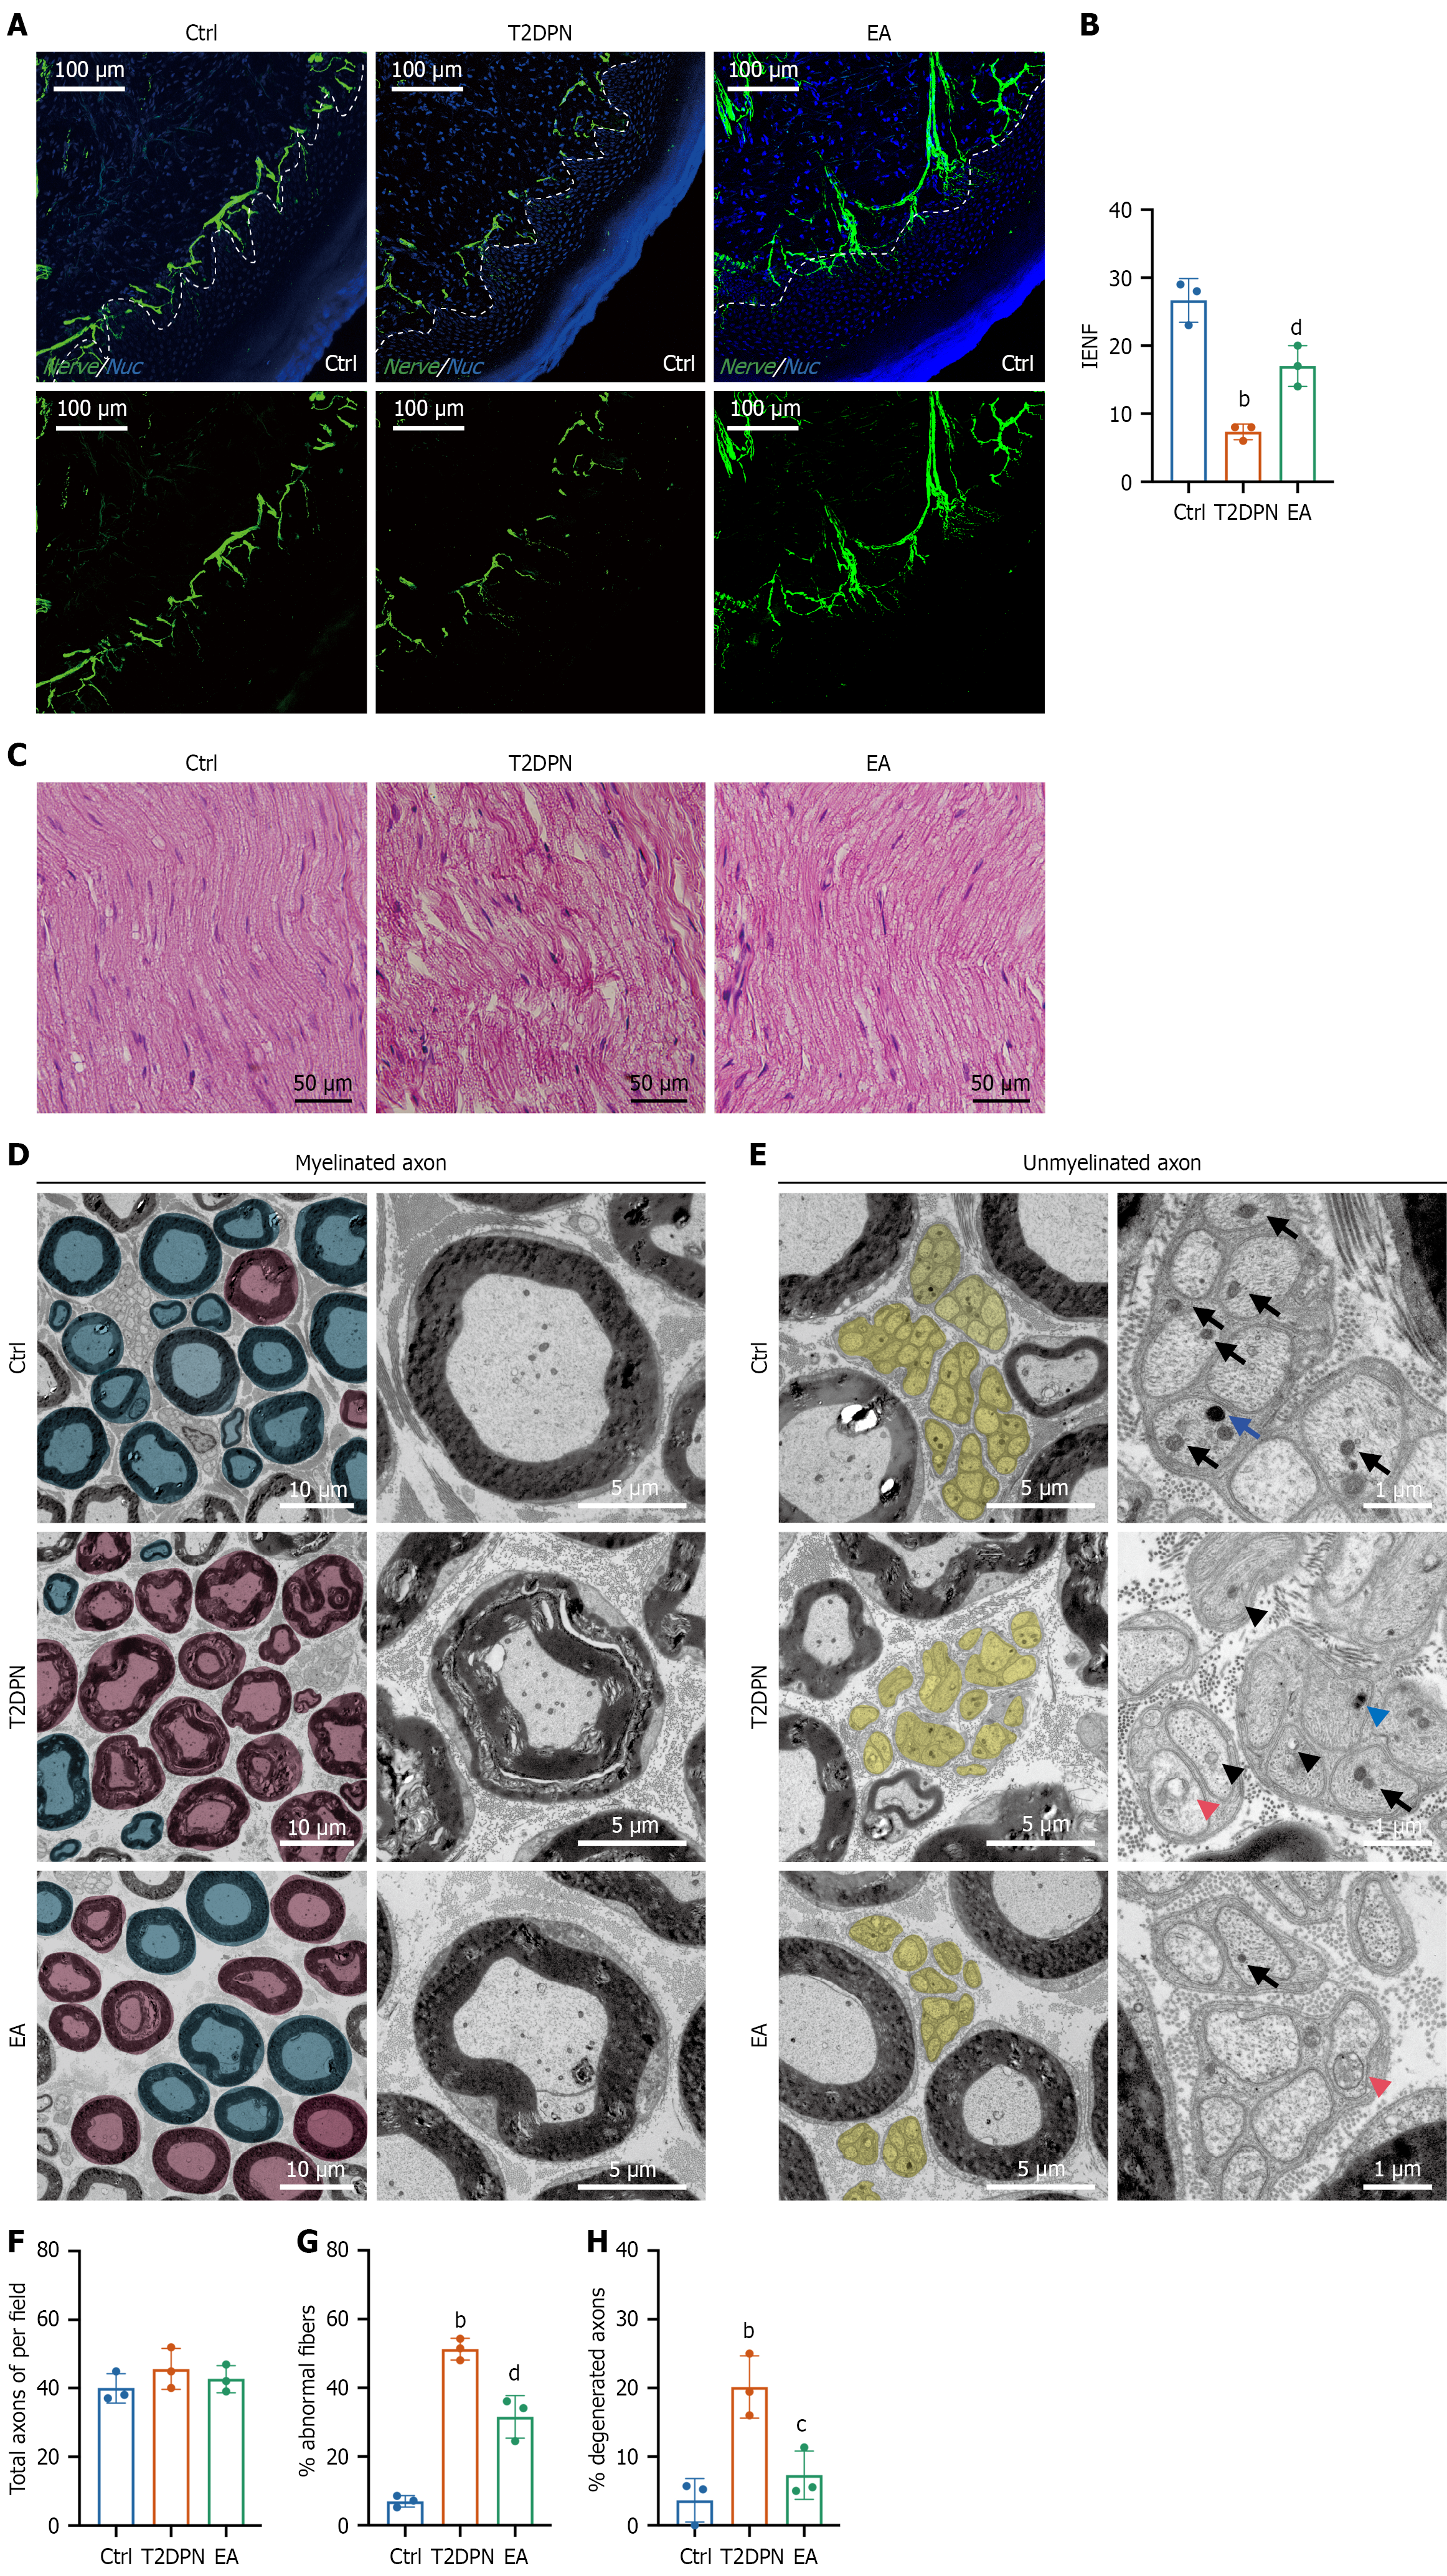
Figure 3 Electroacupuncture treatment increases intraepidermal nerve fiber density and ameliorates degeneration of sciatic nerve fibers in type 2 diabetic peripheral neuropathy rats.
A: Representative images of protein gene product 9.5-positive intraepidermal nerve fibers (green) and 4’,6-diamidino-2-phenylindole staining (blue) in hind paw skin; B: Quantification of intraepidermal nerve fiber density in different groups. Data are presented as mean ± SEM (n = 3); C: Longitudinal hematoxylin-eosin-stained sections of the sciatic nerve in different groups; D: Representative transmission electron microscopy images of myelinated axons with pseudo-coloring of intact axons (blue mask) and degenerated axons (pink mask) (left), and magnified individual axons (right) in sciatic nerve sections from different groups; E: Representative images of unmyelinated axons (yellow mask) (left) and magnified Remak bundles (right) in sciatic nerve sections from different groups. Normal and damaged mitochondria are indicated by black arrows and arrowheads, respectively. Normal and increased lysosomes are indicated by blue arrows and arrowheads, respectively. Autophagosomes are indicated by magenta arrowheads; F: Related morphological analyses of axons per field; G: Percentage of abnormal fibers; H: Percentage of degenerated axons in different groups based on myelinated axons. Data are presented as mean ± SEM (n = 3). bP < 0.01 type 2 diabetic peripheral neuropathy group vs control group. cP < 0.05 electroacupuncture group vs type 2 diabetic peripheral neuropathy group. dP < 0.01 electroacupuncture group vs type 2 diabetic peripheral neuropathy group. T2DPN: Type 2 diabetic peripheral neuropathy; EA: Electroacupuncture; Ctrl: Control; IENF: Intraepidermal nerve fibers.
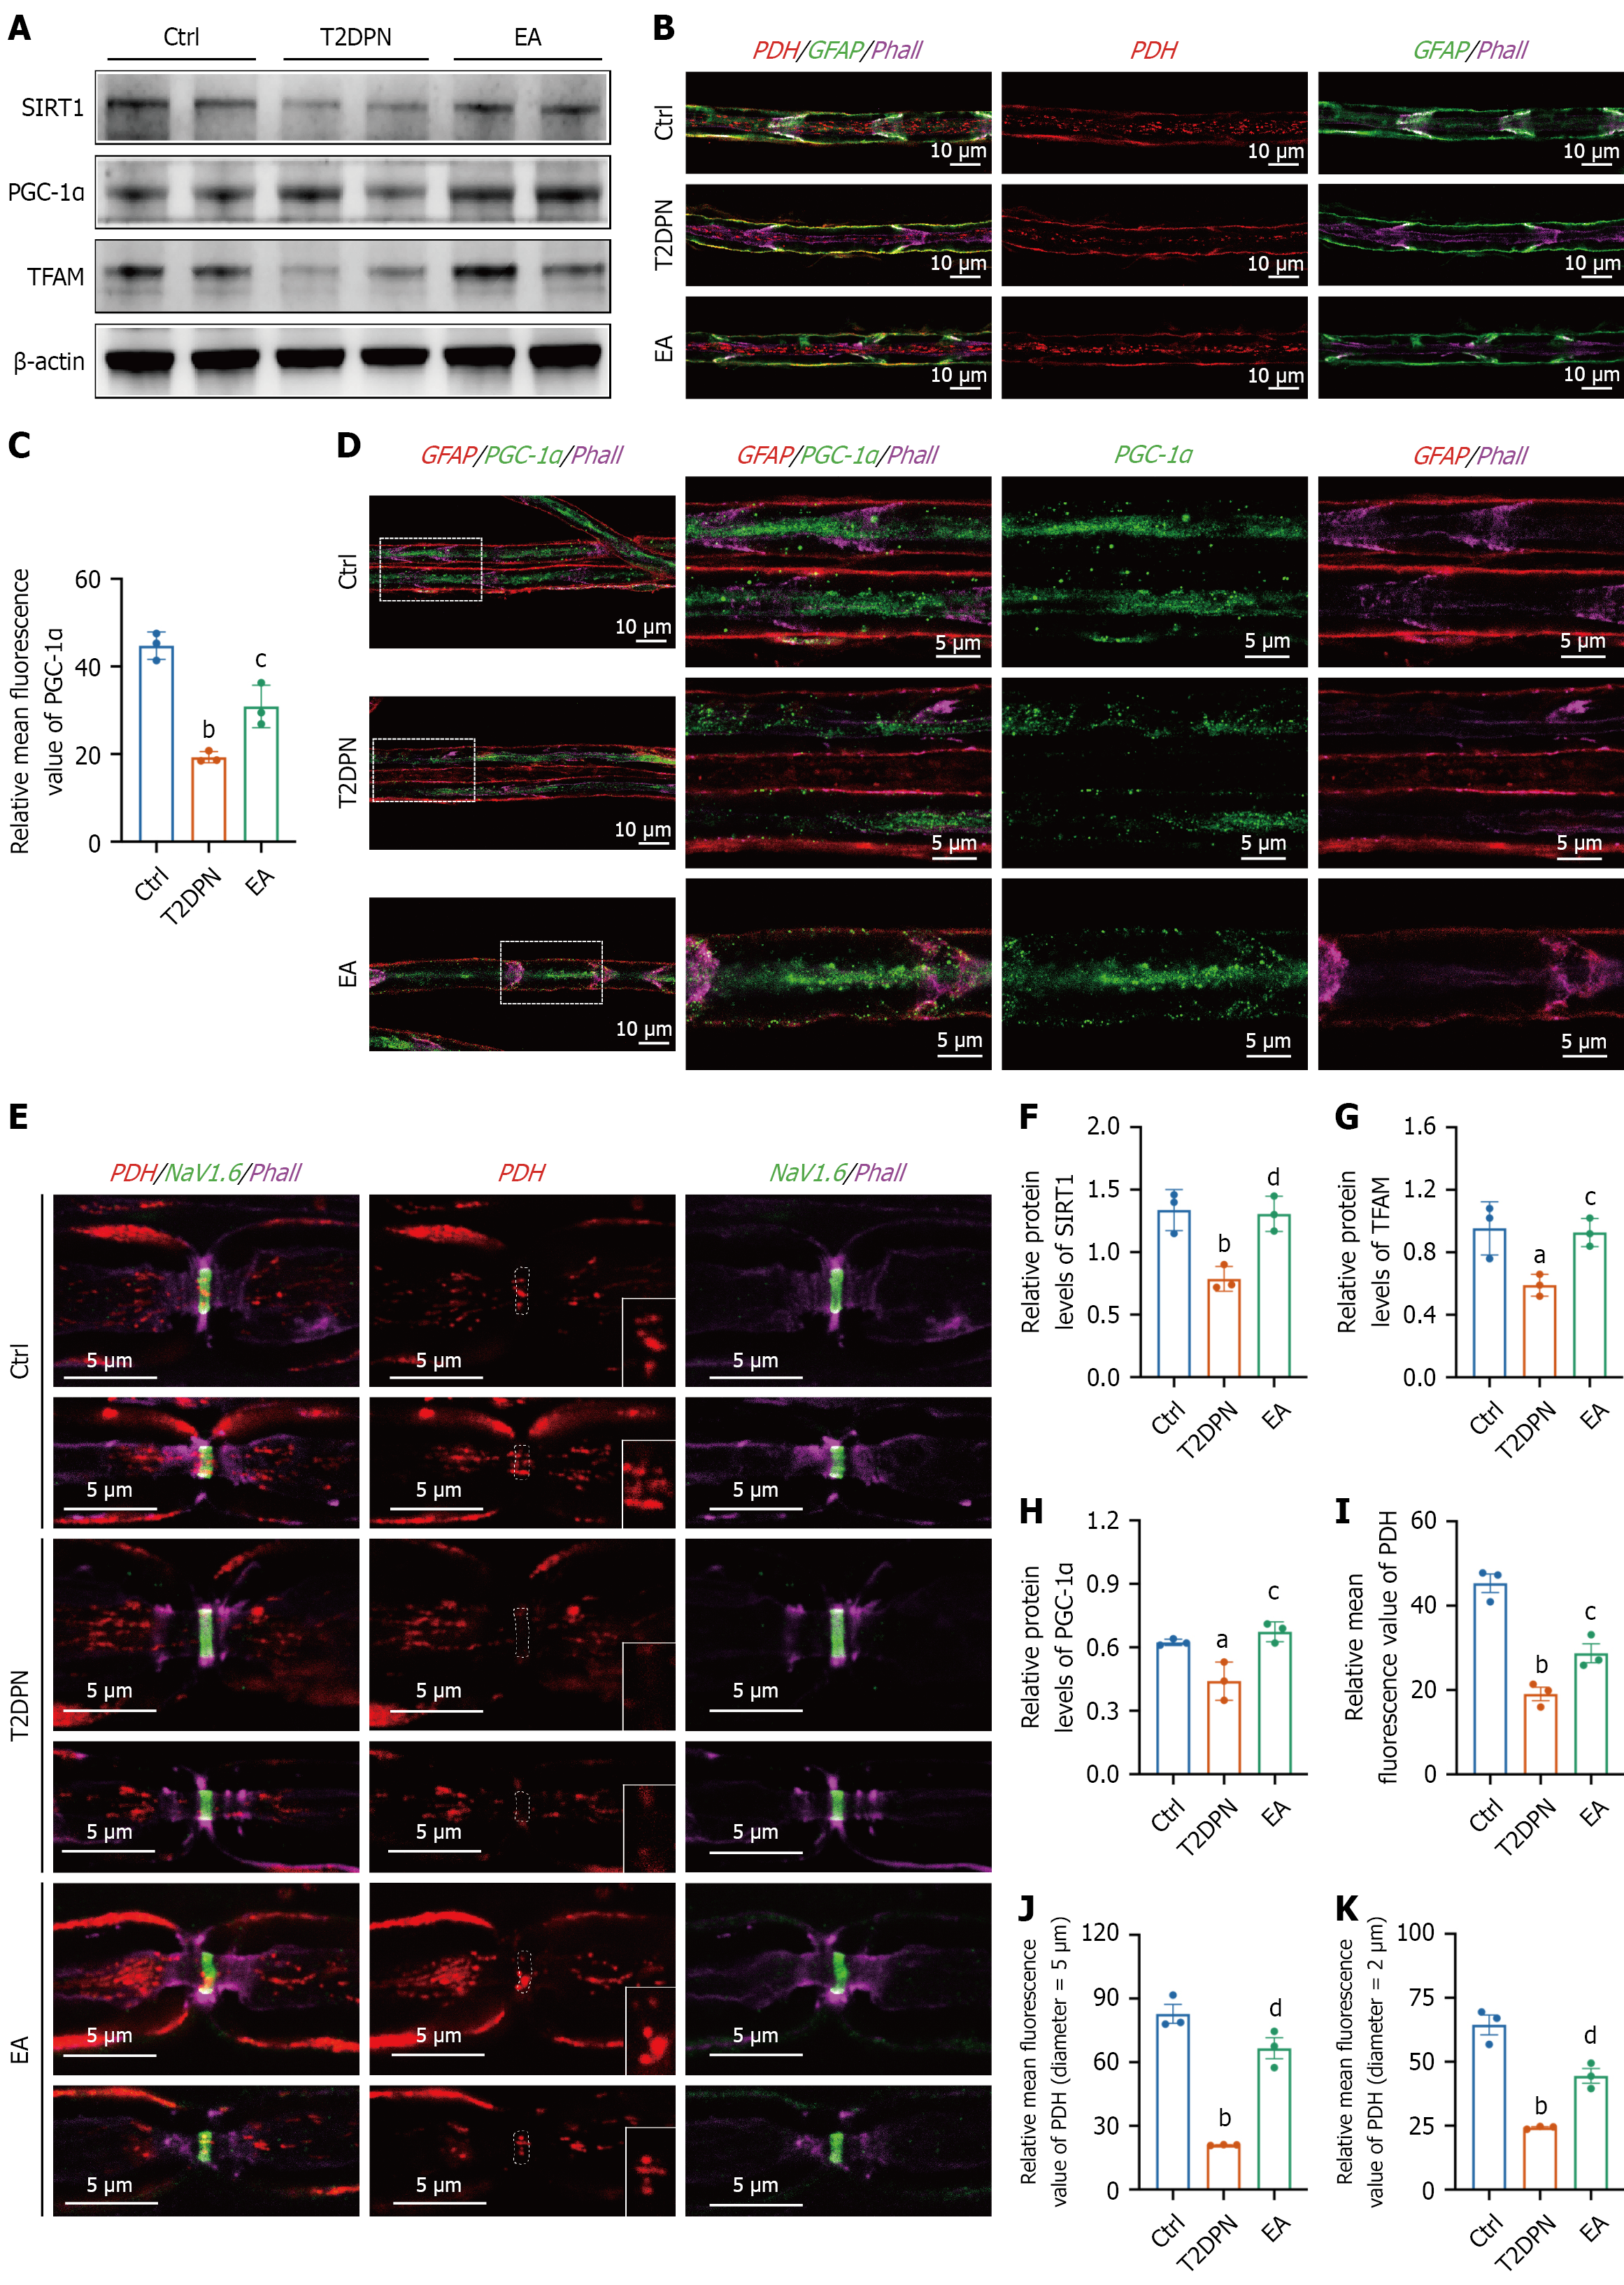
Figure 4 Electroacupuncture treatment upregulated the silent information regulator 1/peroxisome proliferator-activated receptor-γ coactivator-1α pathway in the sciatic nerve of type 2 diabetic peripheral neuropathy rats.
A: Western blot analysis of silent information regulator 1 (SIRT1), peroxisome proliferator-activated receptor-γ coactivator-1α (PGC-1α), and mitochondrial transcription factor A (TFAM) in sciatic nerve tissue; B: Representative immunofluorescence images of pyruvate dehydrogenase (PDH)-stained mitochondria (red) in sciatic nerve fibers; C: Quantification of the mean fluorescence intensity of PGC-1α staining in sciatic nerve fibers; D: Representative immunofluorescence images of PGC-1α staining (green) in sciatic nerve fibers; E: Representative immunofluorescence images of PDH-stained mitochondria (red) at nodes of Ranvier marked by voltage-gated sodium channel 1.6 (NaV1.6) (green) in sciatic nerve fibers with axonal diameters of 5 μm and 2 μm. The white dotted frames indicate the positions of nodes of Ranvier, and the 2 × magnified images show mitochondria at the nodes of Ranvier; F-H: Quantitative analysis of SIRT1 (F), TFAM (G), and PGC-1α (H) protein expression in sciatic nerve tissue; I: Quantification of the mean fluorescence intensity of PDH-stained mitochondria in sciatic nerve fibers; J and K: Quantification of the relative mean fluorescence intensity of mitochondria at nodes of Ranvier in axons with diameters of 5 μm (J) and 2 μm (K). Glial fibrillary acidic protein was stained for glial cells (green in B and red in D), phalloidin was stained for axons (magenta in B, D, and E), and NaV1.6 was stained for nodes of Ranvier (green in E). Data are presented as mean ± SEM (n = 3). aP < 0.05 type 2 diabetic peripheral neuropathy group vs control group. bP < 0.01 type 2 diabetic peripheral neuropathy group vs control group. cP < 0.05 electroacupuncture group vs type 2 diabetic peripheral neuropathy group. dP < 0.01 electroacupuncture group vs type 2 diabetic peripheral neuropathy group. T2DPN: Type 2 diabetic peripheral neuropathy; EA: Electroacupuncture; Ctrl: Control; SIRT1: Silent information regulator 1; PGC-1α: Peroxisome proliferator-activated receptor-γ coactivator-1α; TFAM: Mitochondrial transcription factor A; Phall: Phalloidin; PDH: Pyruvate dehydrogenase; GFAP: Glial fibrillary acidic protein; NaV1.6: Voltage-gated sodium channel 1.6.
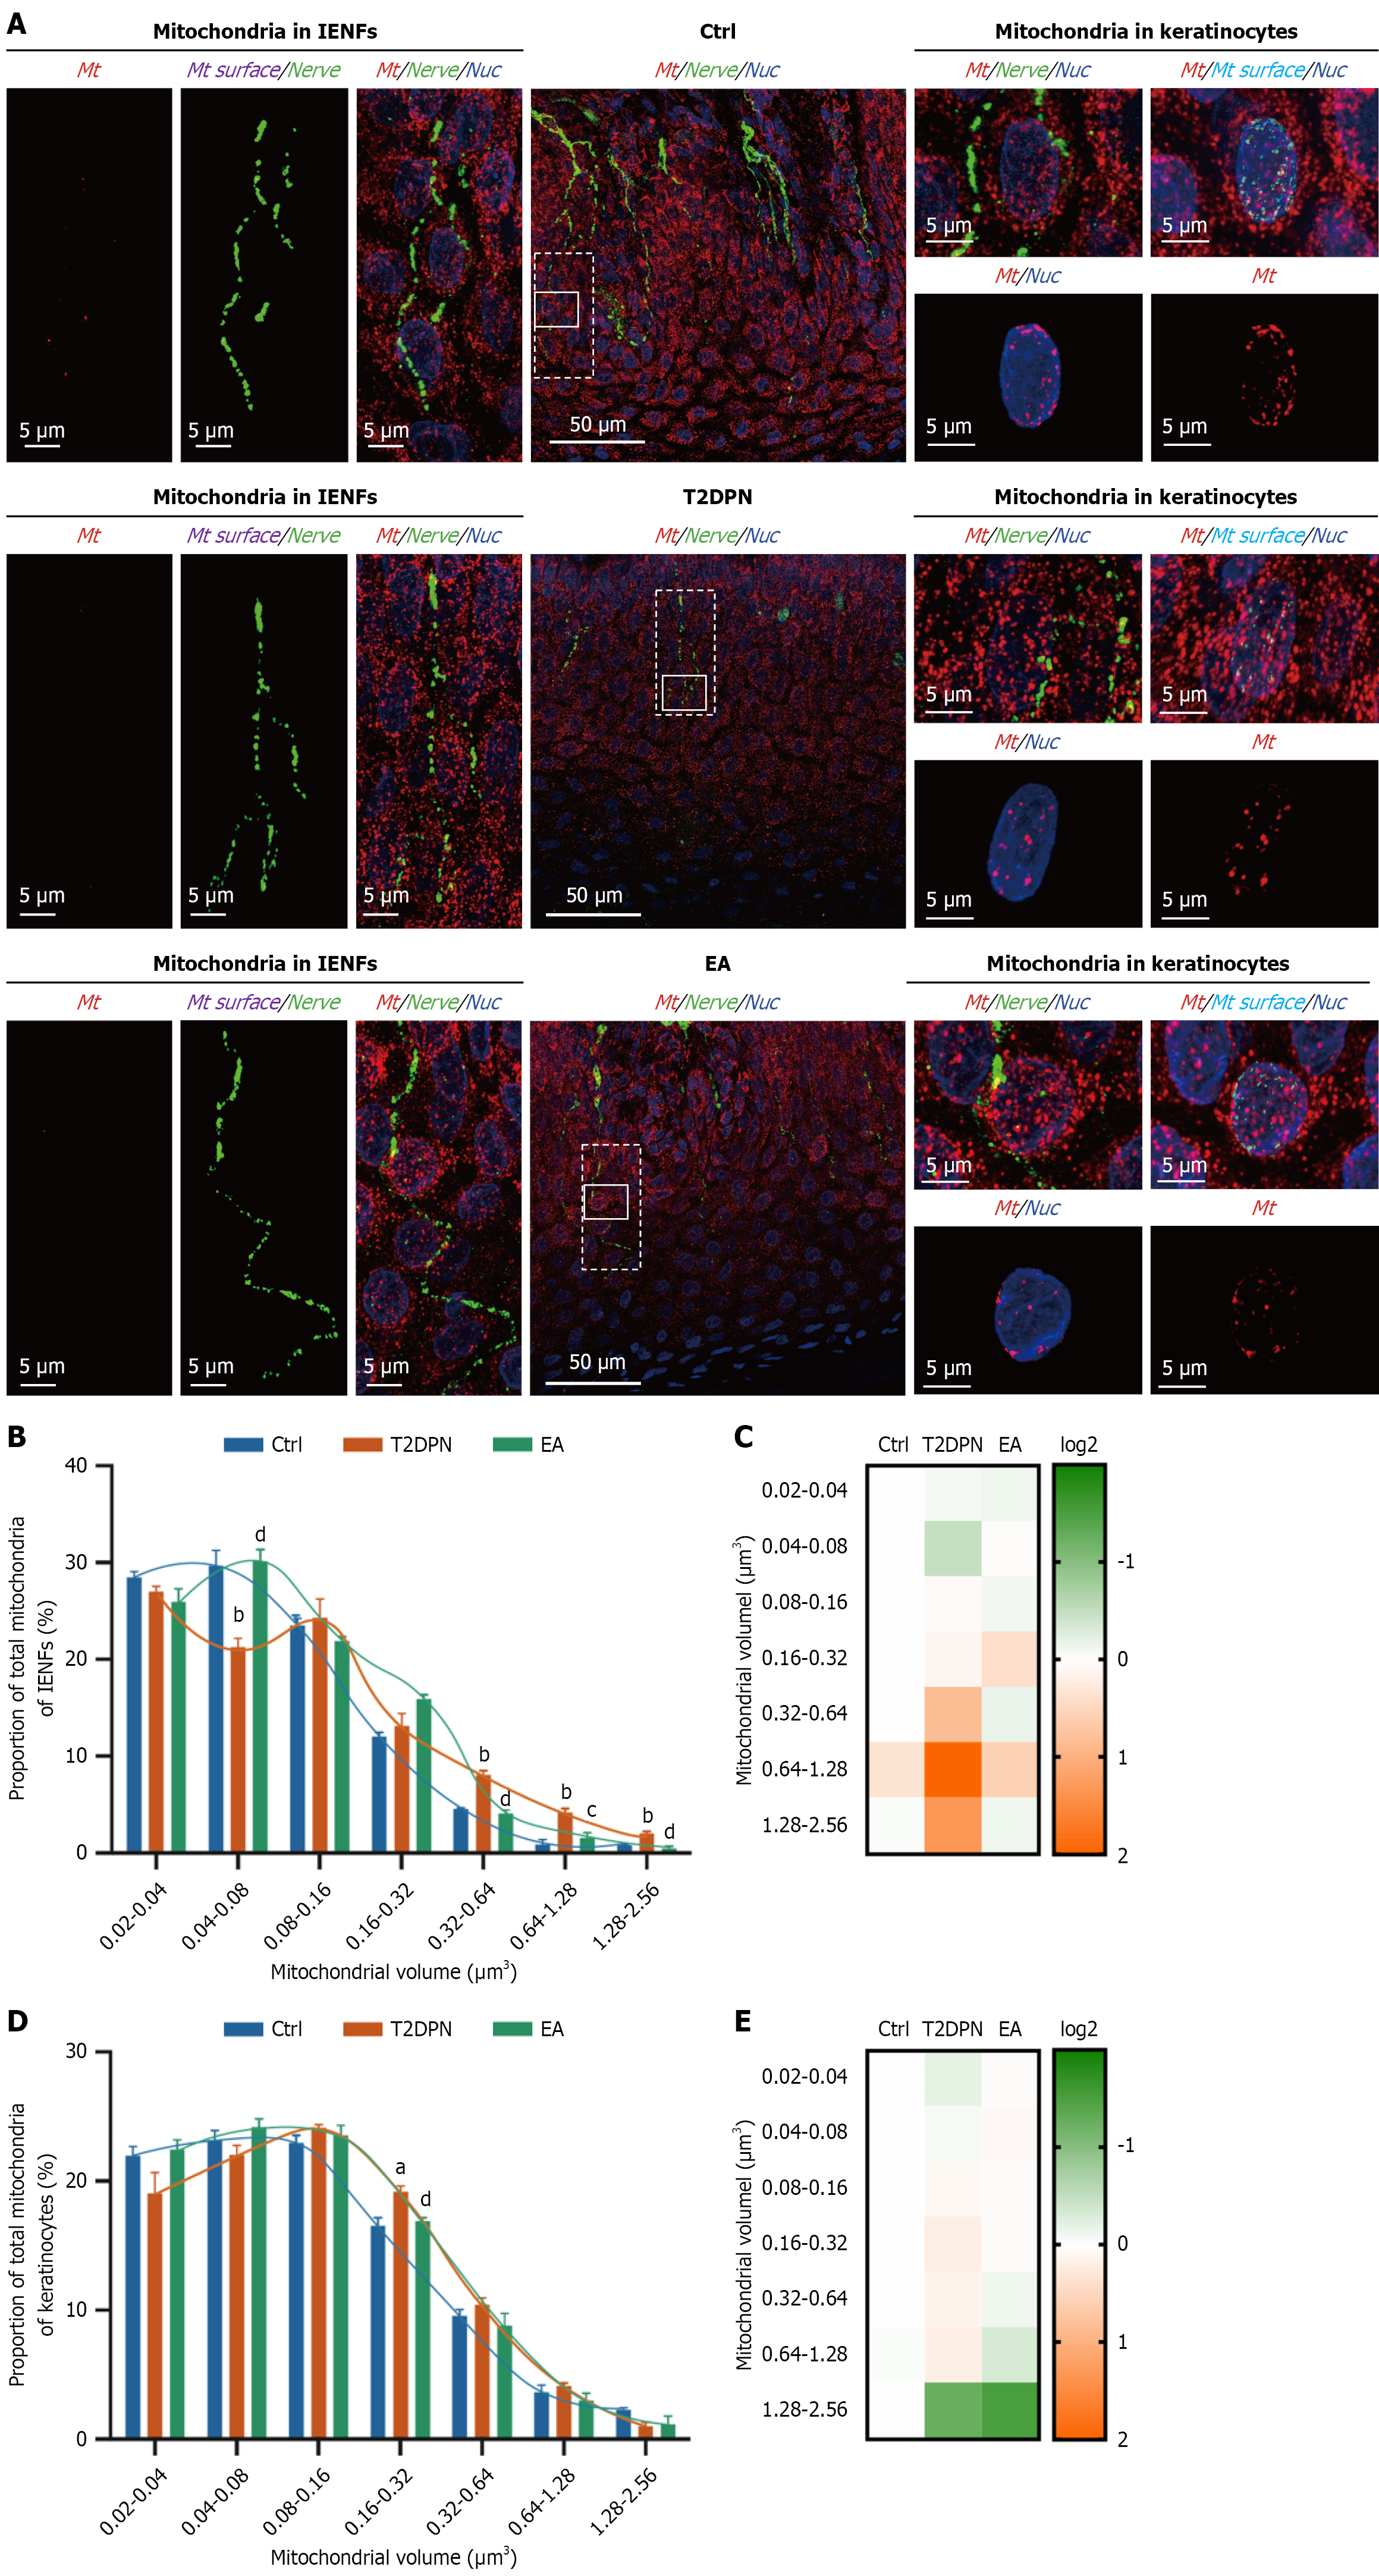
Figure 5 Electroacupuncture has a greater effect on mitochondrial size distribution in intraepidermal nerve fibers than in keratinocytes.
A: Representative immunofluorescence images showing protein gene product 9.5-positive intraepidermal nerve fibers (green), pyruvate dehydrogenase-stained mitochondria (red), and 4’,6-diamidino-2-phenylindole-stained nuclei (blue) in hind paw skin sections from rats in different groups. Micrographs of intraepidermal nerve fibers, keratinocytes, and their corresponding mitochondria outlined by white dotted and solid boxes are shown in the left and right panels, respectively. Nerve-specific mitochondrial surfaces (magenta) and keratinocyte-specific mitochondrial surfaces (turquoise) are shown in the left and right panels, respectively; B and C: Mitochondrial size distribution in intraepidermal nerve fibers was assessed by frequency histograms of the percentage distribution of nerve-specific mitochondrial volume, with fitted curves based on the mean value of each frequency (B), and heatmap of the percentage distribution of nerve-specific mitochondrial volume based on the control group data and plotted on a log2 scale (C). A total of 473-509 mitochondria from 3 rats in each group were included; D and E: Mitochondrial size distribution in keratinocytes was assessed by frequency histograms of the percentage distribution of keratinocyte-specific mitochondrial volume, with fitted curves based on the mean value of each frequency (D), and heatmap of the percentage distribution of keratinocyte-specific mitochondrial volume based on the control group data and plotted on a log2 scale (E). A total of 1486-1752 mitochondria from 3 rats in each group were included. Data are presented as mean ± SEM (n = 3). aP < 0.05 type 2 diabetic peripheral neuropathy group vs control group. bP < 0.01 type 2 diabetic peripheral neuropathy group vs control group. cP < 0.05 electroacupuncture group vs type 2 diabetic peripheral neuropathy group. dP < 0.01 electroacupuncture group vs type 2 diabetic peripheral neuropathy group. T2DPN: Type 2 diabetic peripheral neuropathy; EA: Electroacupuncture; Ctrl: Control; IENFs: Intraepidermal nerve fibers; Nuc: 4’,6-diamidino-2-phenylindole-stained nuclei; Mt: Mitochondrial.
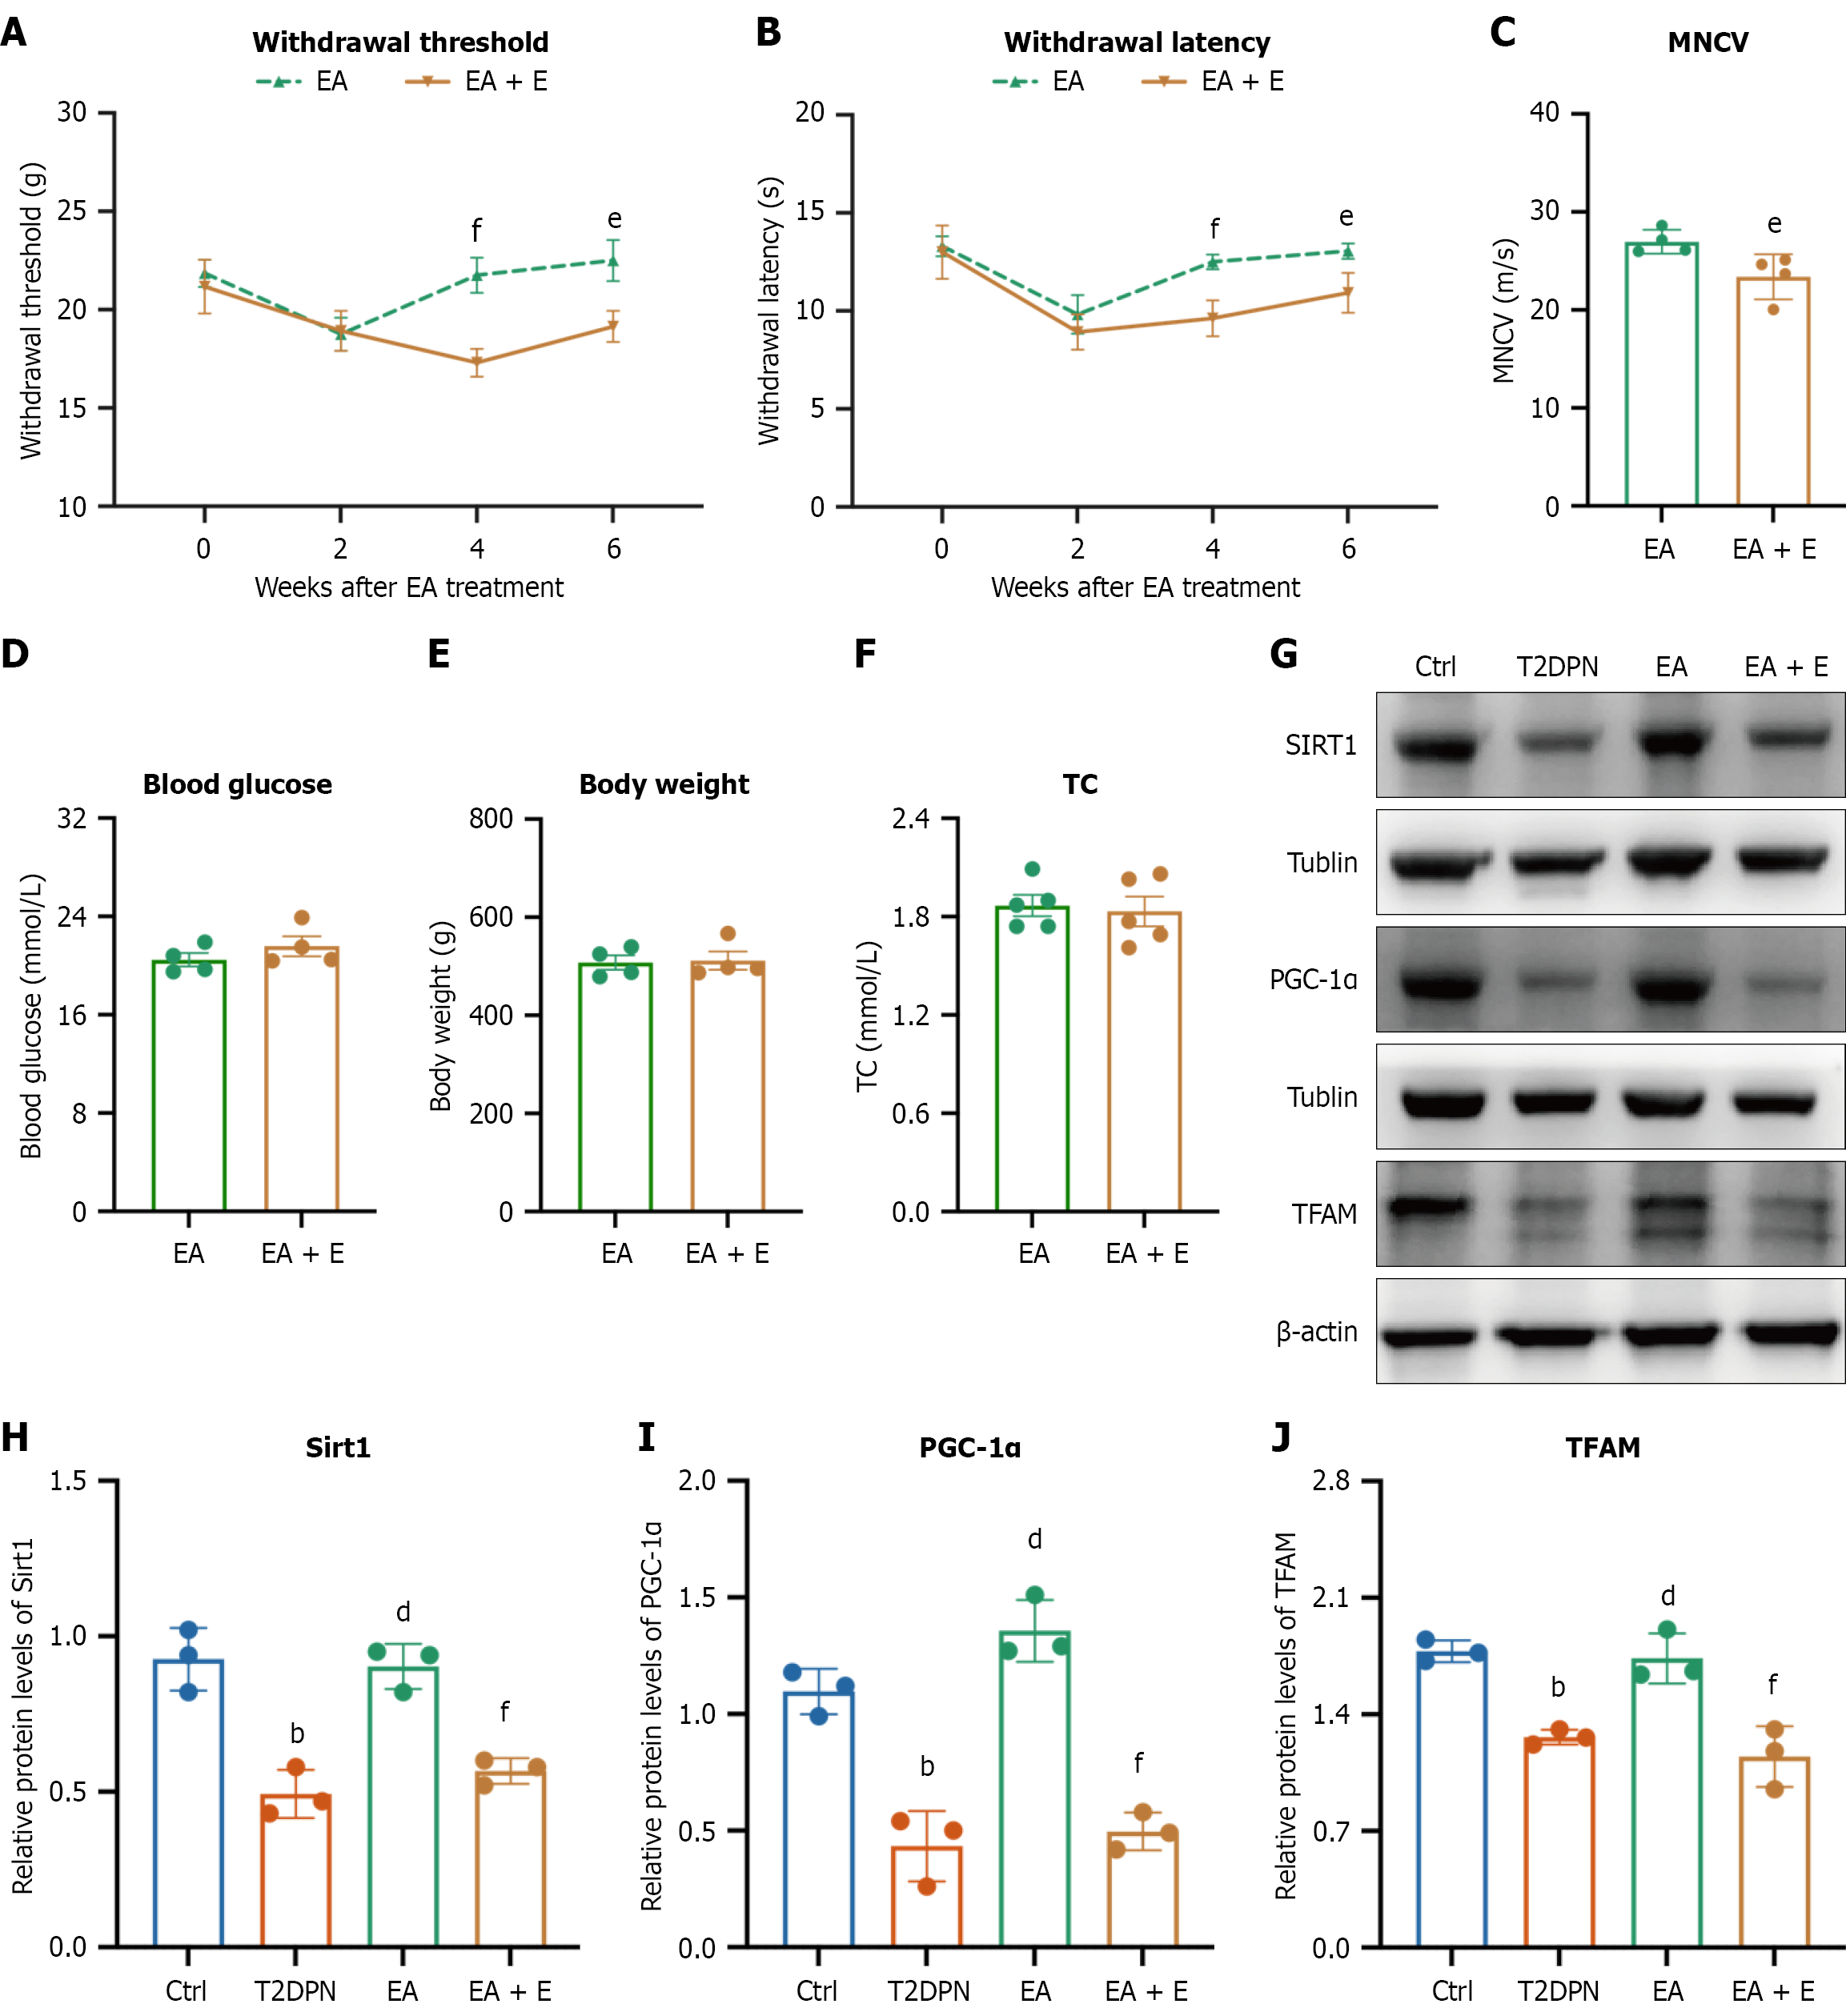
Figure 6 Selisistat injection attenuated the regulatory effects of electroacupuncture on nerve function and inhibited mitochondrial biogenesis in the sciatic nerve.
A-C: Behavioral and neurological function was assessed by withdrawal threshold (A), withdrawal latency (B), and motor nerve conduction velocity (C) after electroacupuncture treatment and selisistat (EX-527) injection; D-F: Basic metabolic indices, including blood glucose (D), body weight (E), and total cholesterol (TC) (F), in different groups after electroacupuncture treatment and EX-527 injection; G: Representative Western blot images of silent information regulator 1 (SIRT1), peroxisome proliferator-activated receptor-γ coactivator-1α (PGC-1α), and mitochondrial transcription factor A (TFAM) in the sciatic nerve; H-J: Quantitative analysis of the relative protein levels of SIRT1 (H), PGC-1α (I), and TFAM (J) in the sciatic nerve. Data are presented as mean ± SEM (n = 3-5). ᵇP < 0.01, type 2 diabetic peripheral neuropathy group vs control group; ᵈP < 0.01, electroacupuncture group vs type 2 diabetic peripheral neuropathy group; ᵉP < 0.05, electroacupuncture plus selisistat group vs electroacupuncture group; ᶠP < 0.01, electroacupuncture plus selisistat group vs electroacupuncture group. EA: Electroacupuncture; EA + E: Electroacupuncture plus selisistat; MNCV: Motor nerve conduction velocity; T2DPN: Type 2 diabetic peripheral neuropathy; Ctrl: Control; TC: Total cholesterol; SIRT1: Silent information regulator 1; PGC-1α: Peroxisome proliferator-activated receptor-γ coactivator-1α; TFAM: Mitochondrial transcription factor A.
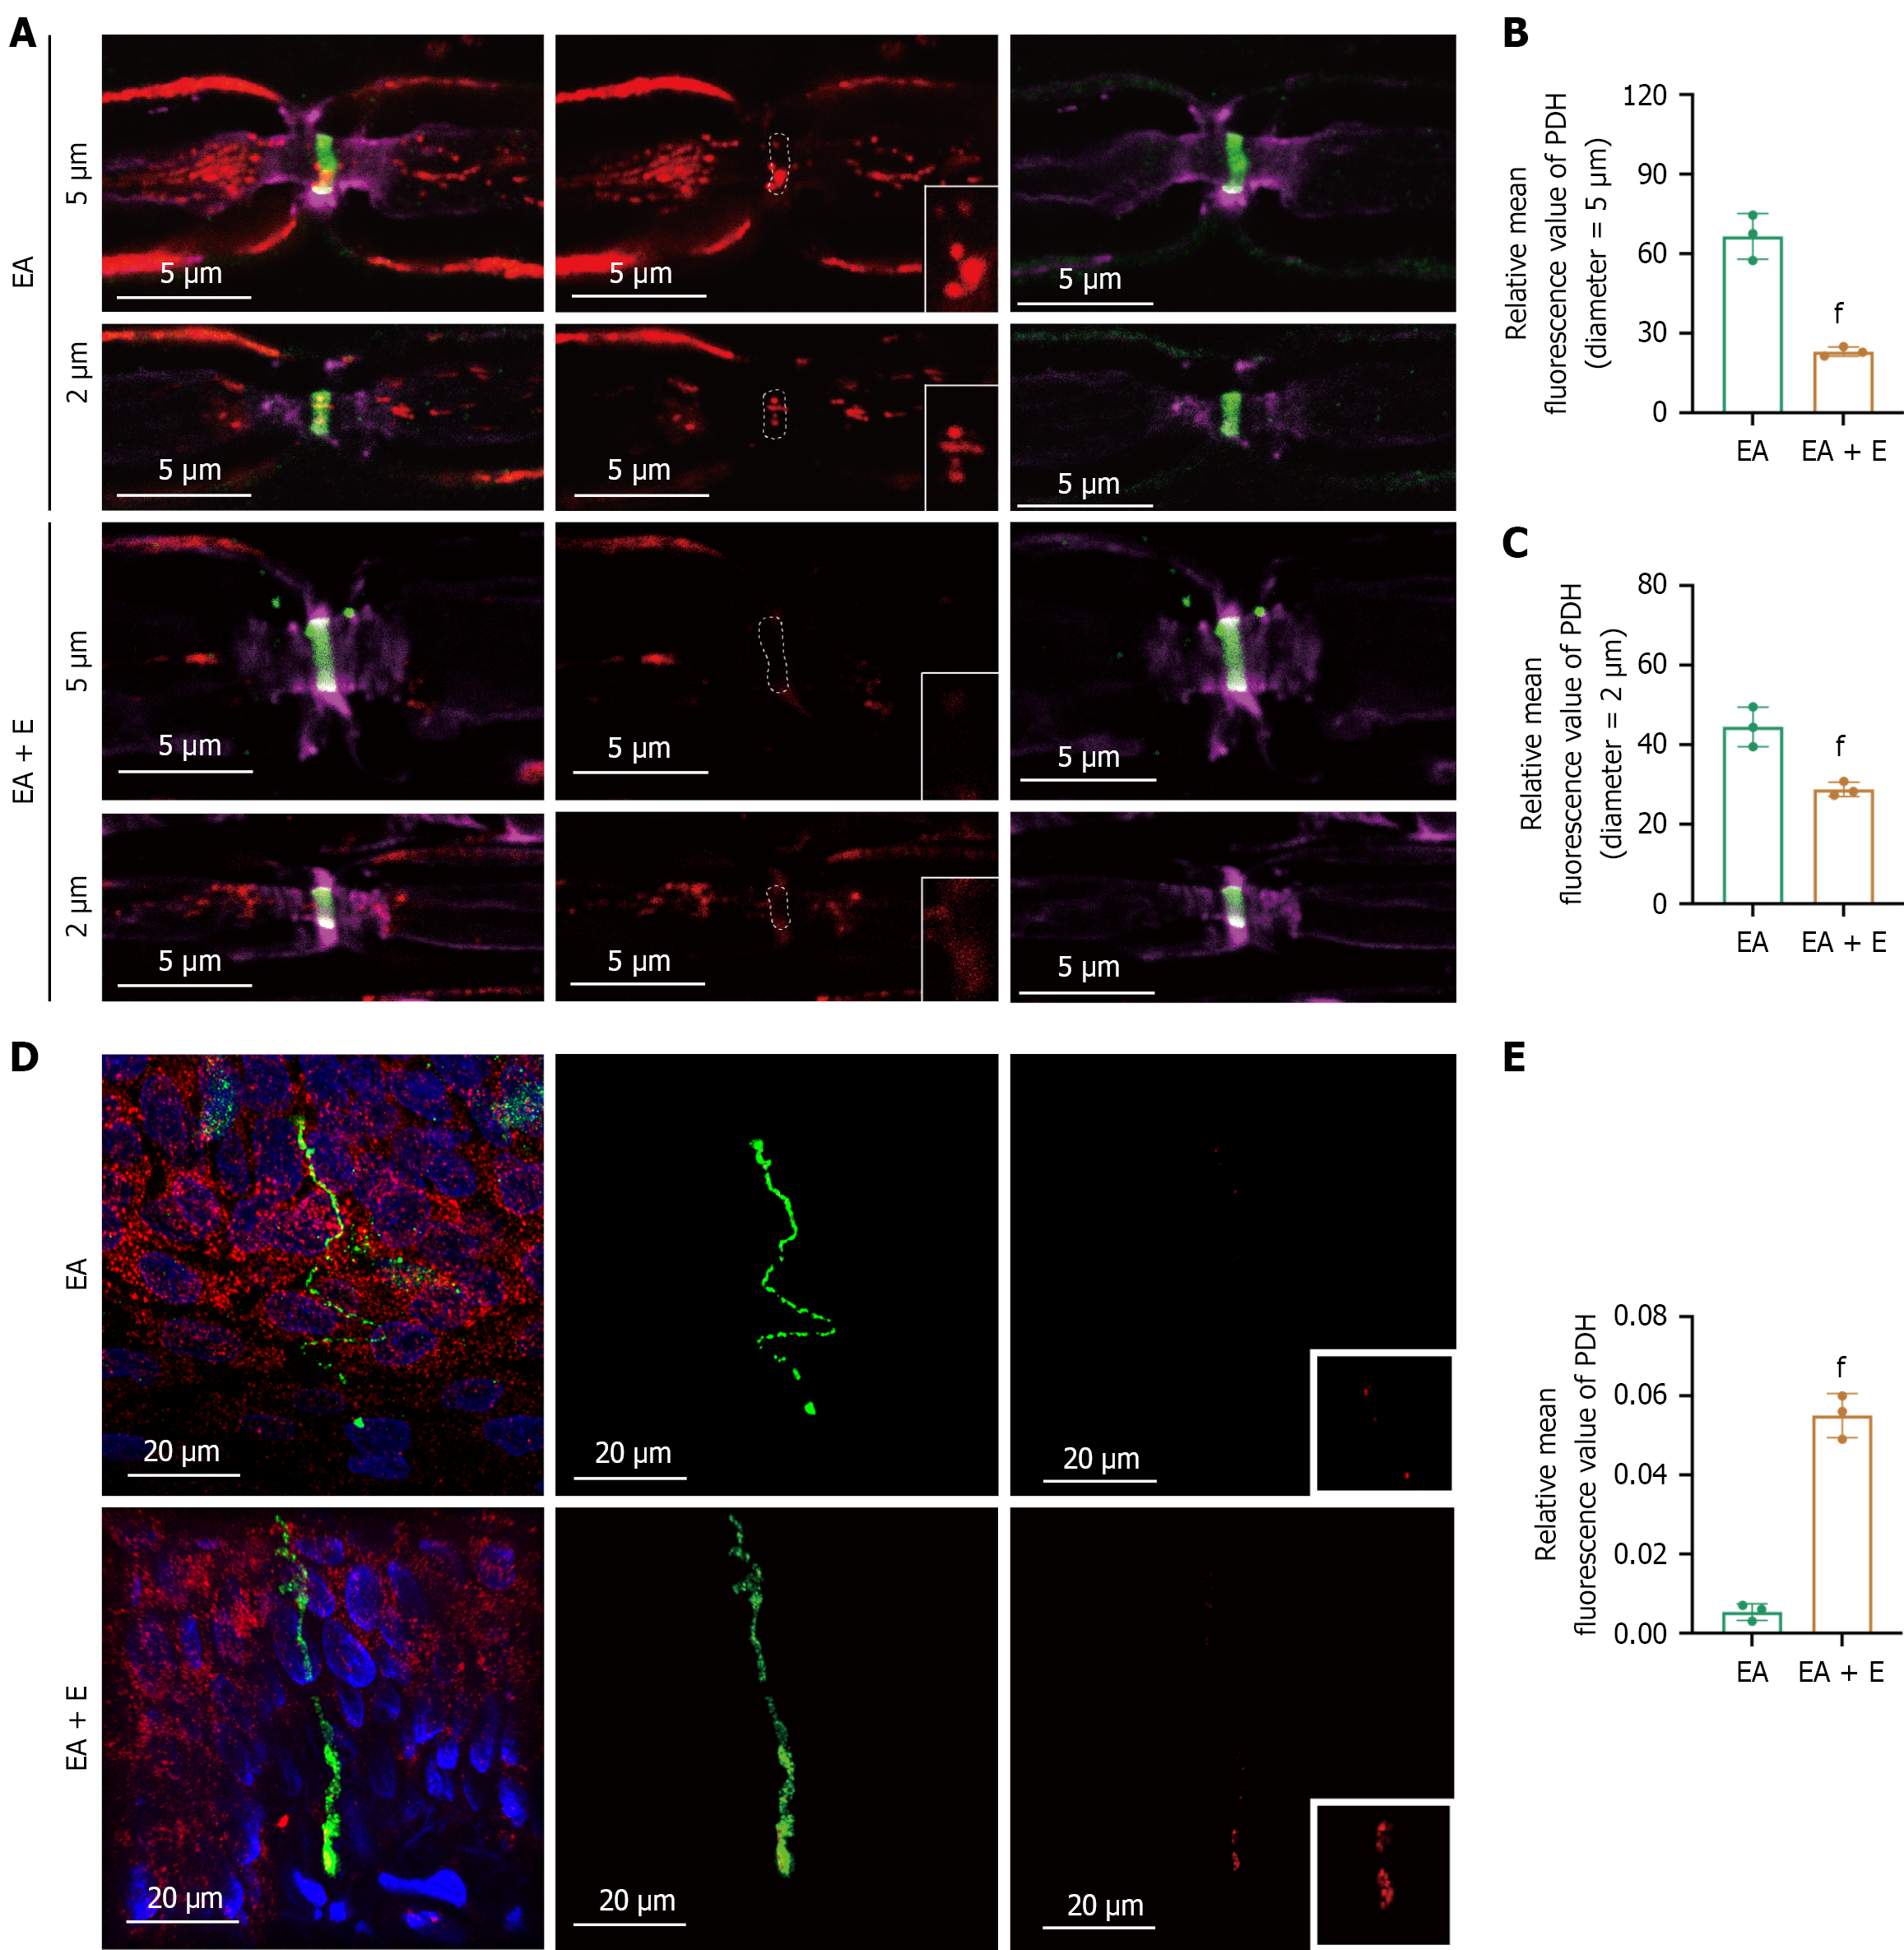
Figure 7 Selisistat injection decreased mitochondrial levels at nodes of Ranvier but increased mitochondrial levels in intraepidermal nerve fibers.
A-C: Mitochondrial levels at nodes of Ranvier were assessed by representative immunofluorescence images of pyruvate dehydrogenase (PDH)-stained mitochondria (red) at nodes of Ranvier marked by voltage-gated sodium channel 1.6 (green) in sciatic nerve fibers with axonal diameters of 5 μm (A) and 2 μm (B), and quantification of relative mean fluorescence intensity (C). The white dotted frames indicate the positions of nodes of Ranvier; D and E: Mitochondrial levels in intraepidermal nerve fibers were assessed by representative immunofluorescence images of PDH-stained mitochondria (red) in intraepidermal nerve fibers marked by protein gene product 9.5 (green) (D), and quantification of relative mean fluorescence intensity (E). fP < 0.01 electroacupuncture plus selisistat group vs electroacupuncture group. EA: Electroacupuncture; EA + E: Electroacupuncture plus selisistat; PDH: Pyruvate dehydrogenase.
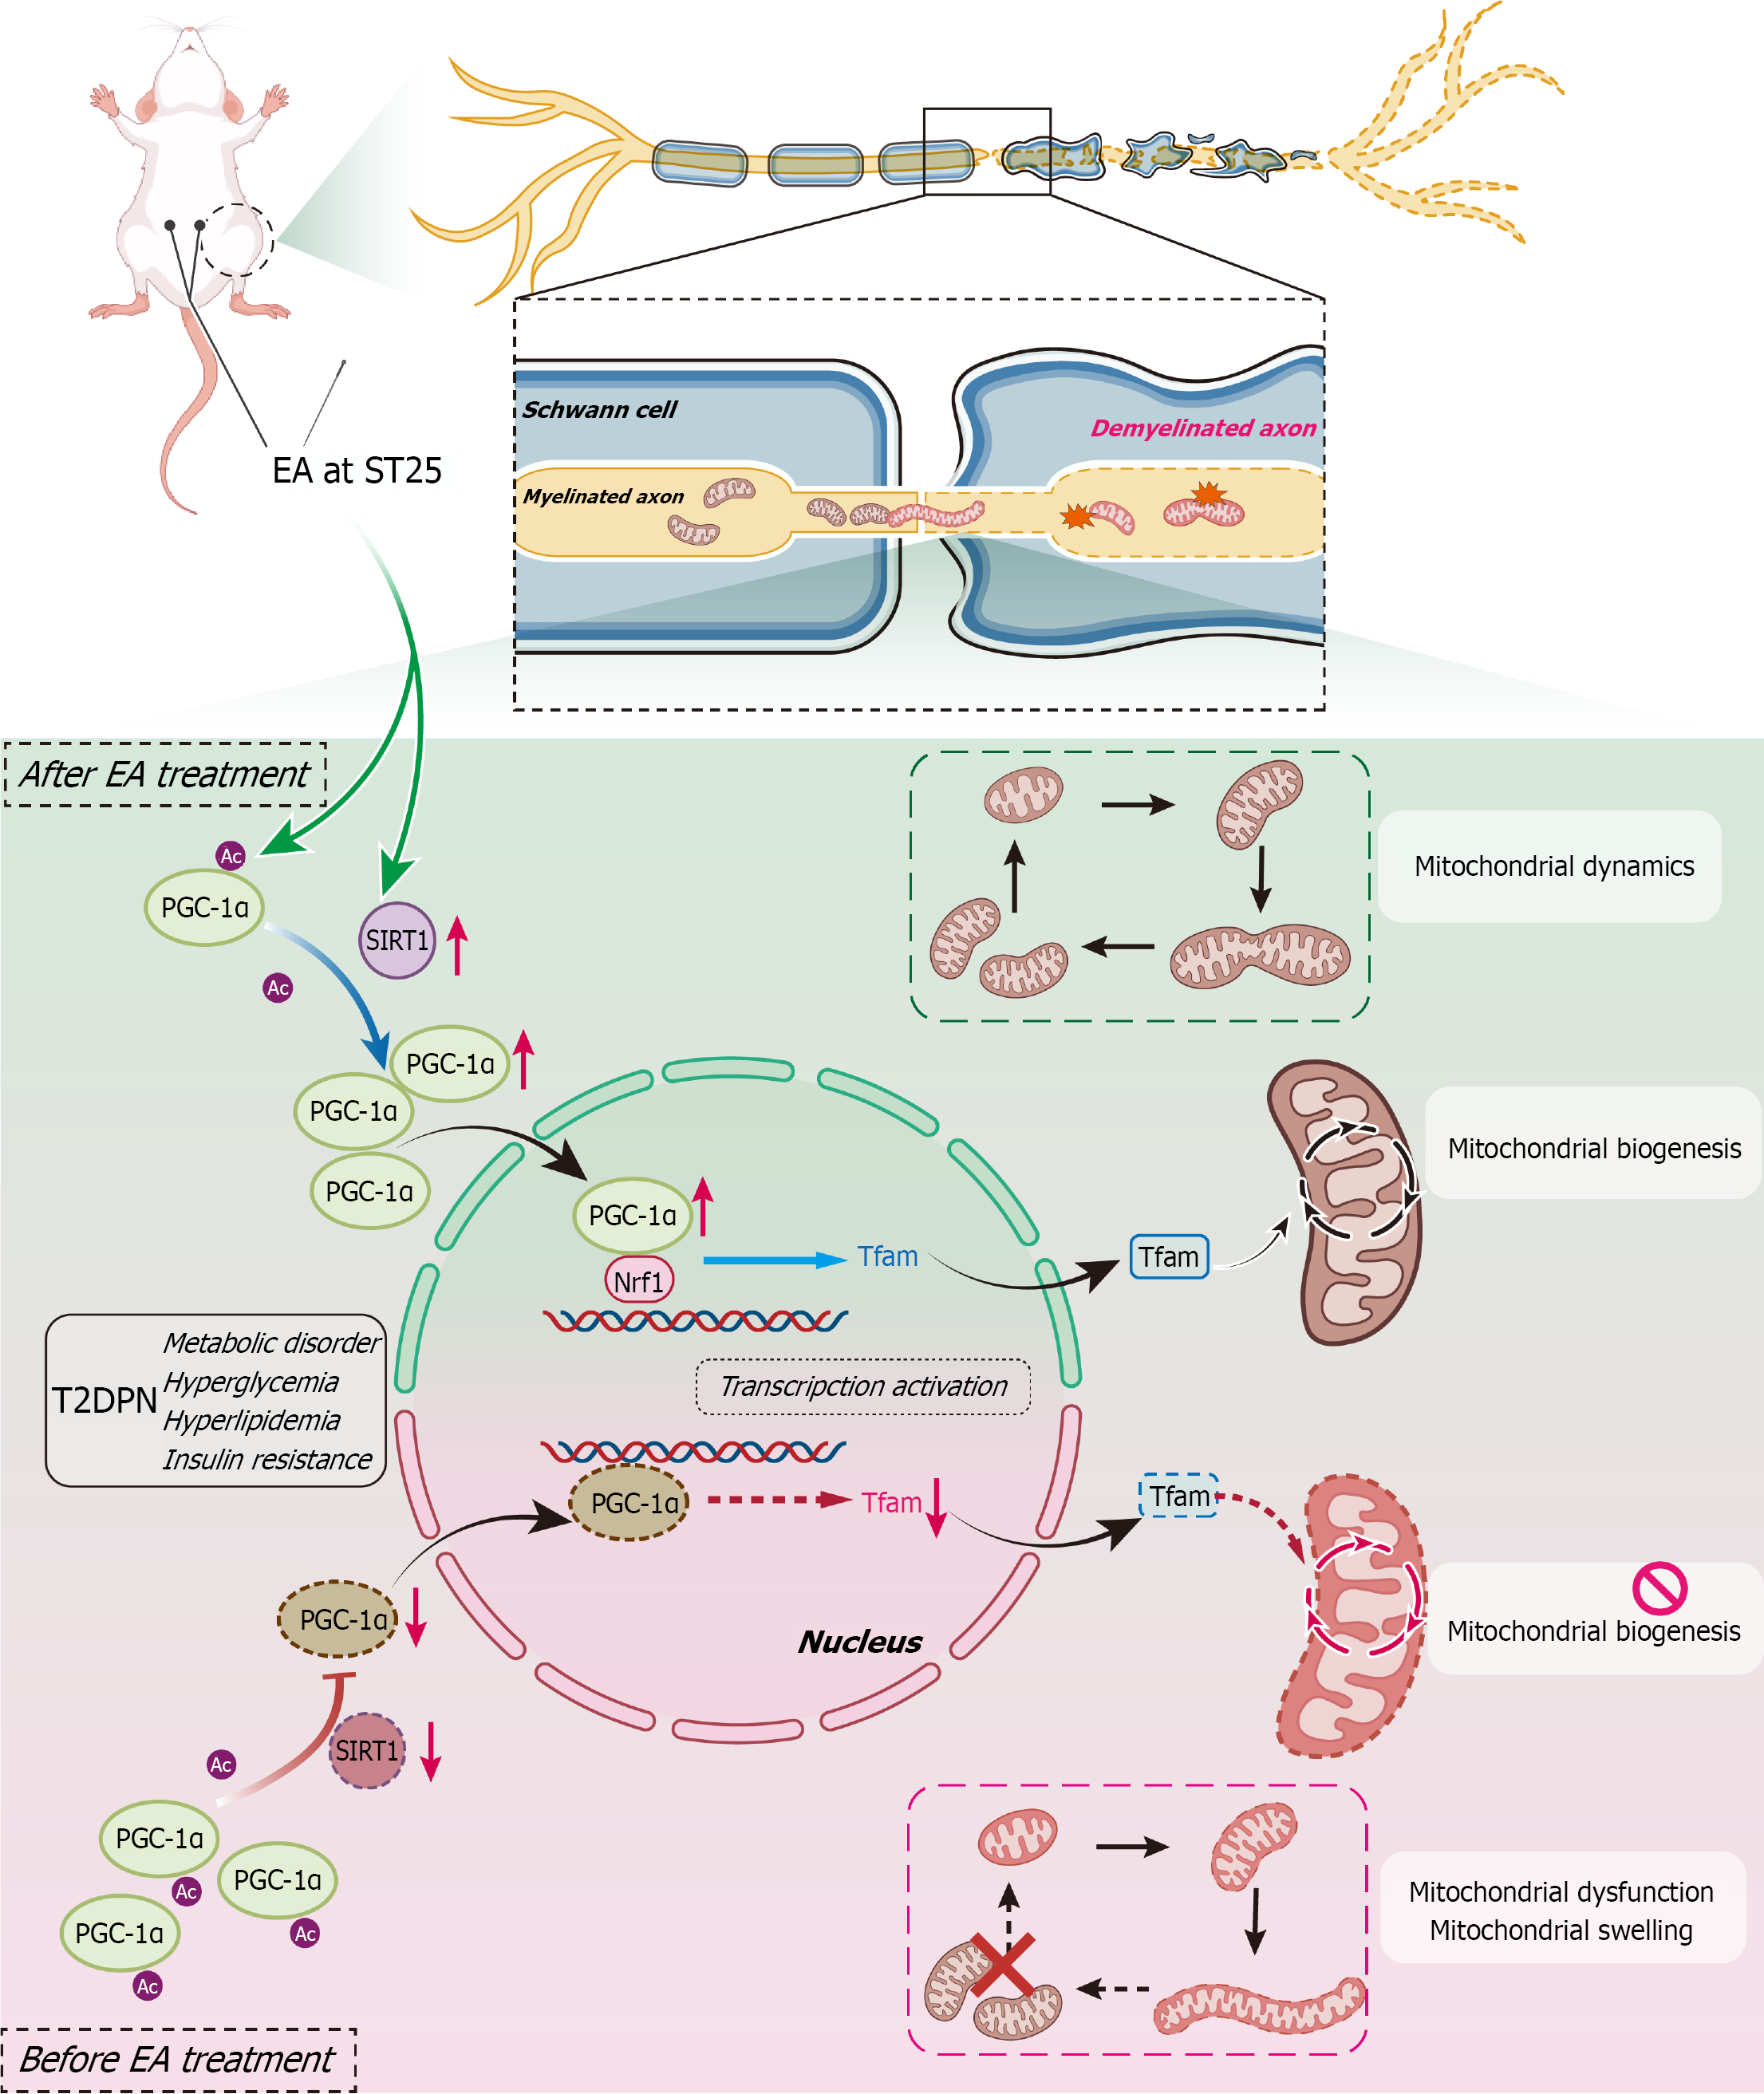
Figure 8 Electroacupuncture regulates axonal mitochondrial distribution via silent information regulator 1/peroxisome proliferator-activated receptor-γ coactivator-1α-mediated mitochondrial biogenesis to improve type 2 diabetic peripheral neuropathy.
Under type 2 diabetes mellitus conditions characterized by hyperglycemia, hyperlipidemia, and insulin resistance, peripheral nerve axons undergo mitochondrial dysfunction and structural damage, thereby contributing to demyelination. Electroacupuncture at ST25 alleviates peripheral neuropathy by activating the silent information regulator 1/peroxisome proliferator-activated receptor-γ coactivator-1α pathway, which promotes mitochondrial biogenesis and improves mitochondrial distribution in peripheral nerve axons and nodes of Ranvier. EA: Electroacupuncture; SIRT1: Silent information regulator 1; PGC-1α: Peroxisome proliferator-activated receptor-γ coactivator-1α; T2DPN: Type 2 diabetic peripheral neuropathy; Nrf1: Nuclear respiratory factor 1; TFAM: Mitochondrial transcription factor A; Ac: Acetyl.
- Citation: Wang X, Yuan CX, Liu Y, Li WF, Lu MJ, Xu TC, Yu Z, Xu B. Electroacupuncture alleviates diabetic peripheral neuropathy: Regulates mitochondrial biogenesis and redistribution in peripheral nerve fibers. World J Diabetes 2026; 17(9): 120935
- URL: https://www.wjgnet.com/1948-9358/full/v17/i9/120935.htm
- DOI: https://dx.doi.org/10.4239/wjd.120935