
















Copyright: ©Author(s) 2026.
World J Diabetes. Aug 15, 2026; 17(8): 122101
Published online Aug 15, 2026. doi: 10.4239/wjd.122101
Published online Aug 15, 2026. doi: 10.4239/wjd.122101
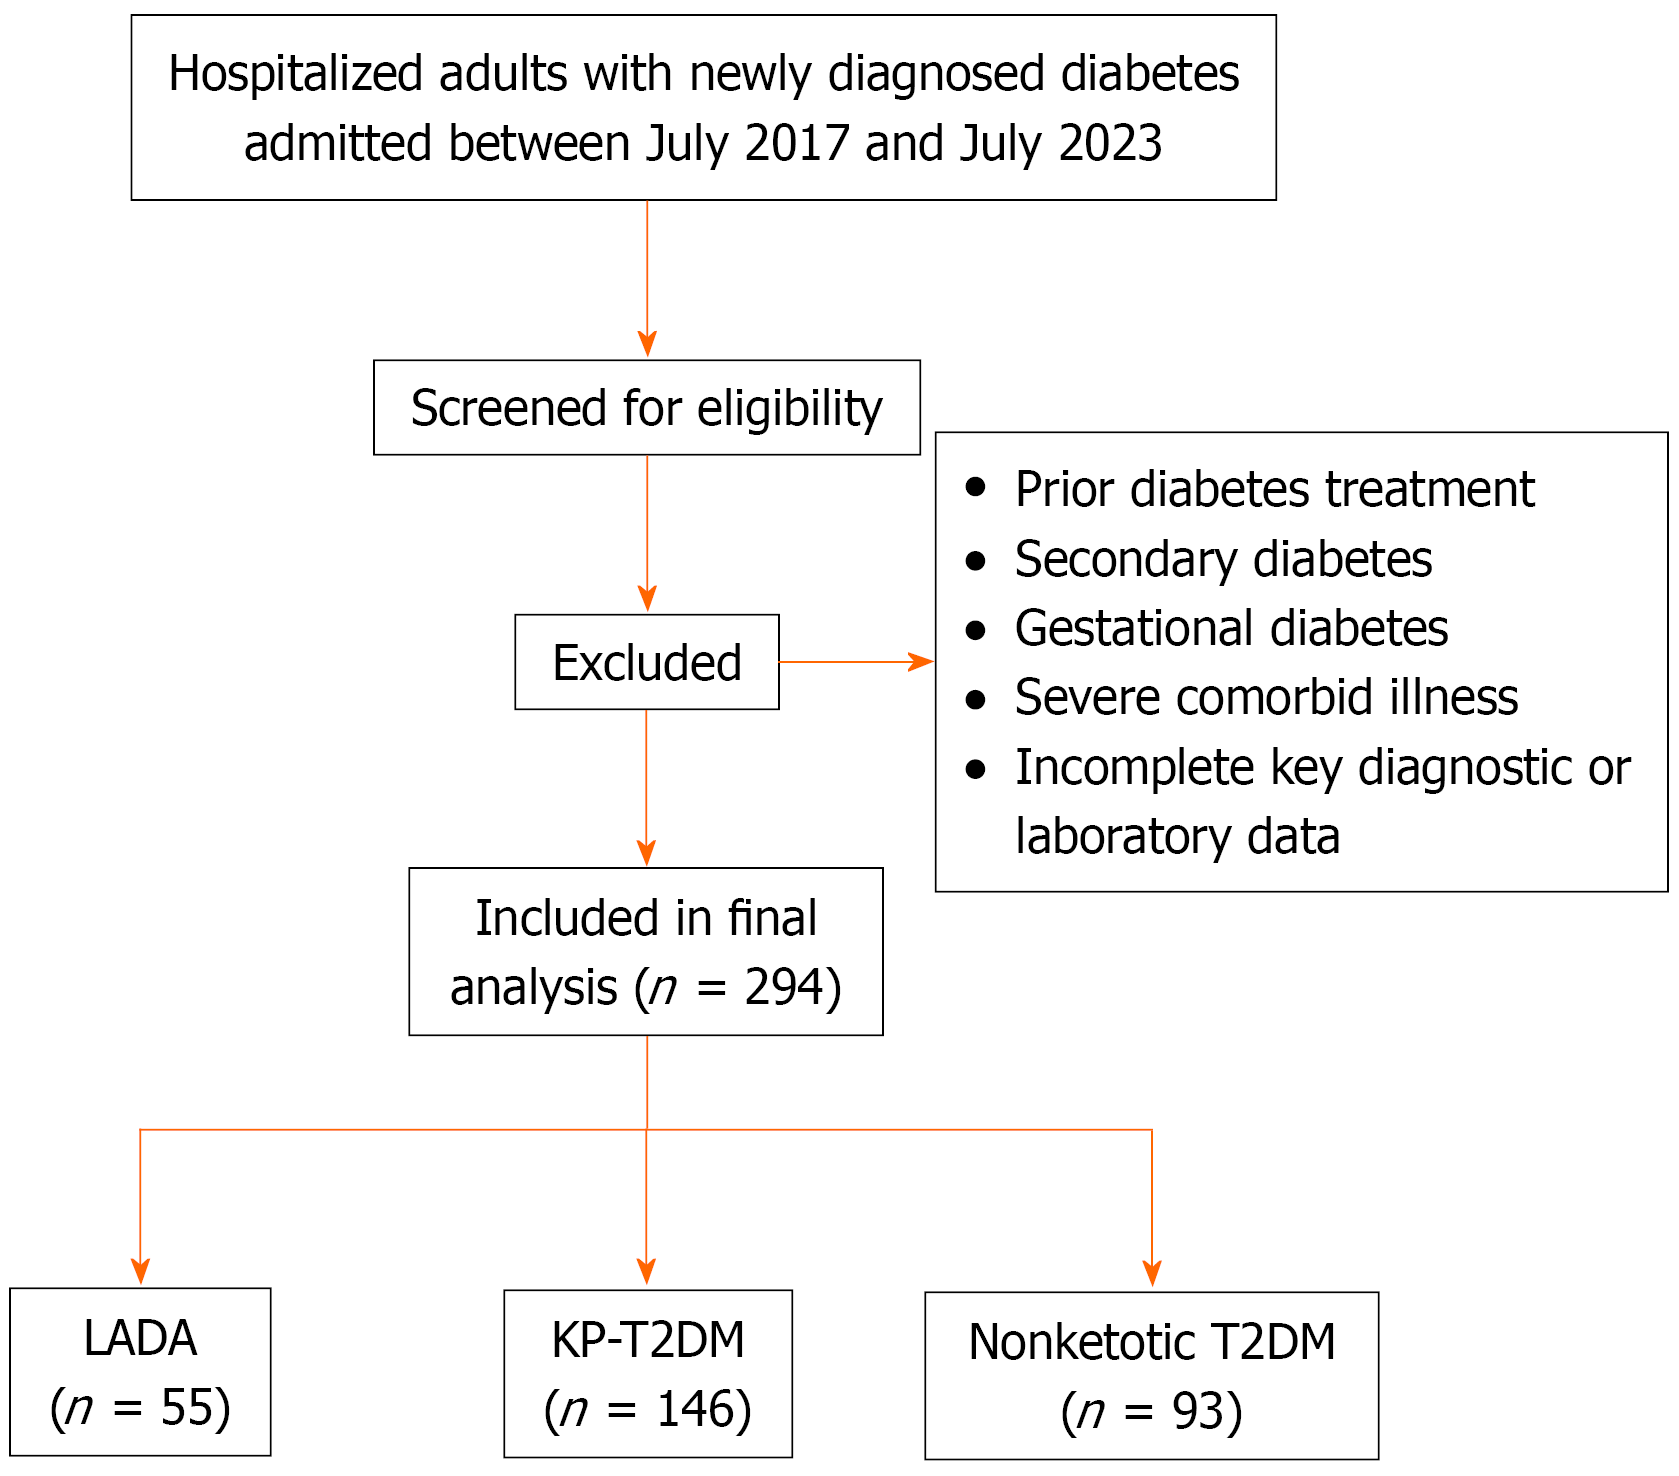
Figure 1 Flowchart of patient selection and grouping.
Adult patients with newly diagnosed diabetes admitted between July 2017 and July 2023 were screened. Patients with secondary diabetes, prior treatment, severe comorbidities, or missing key diagnostic or laboratory data were excluded. A total of 294 patients were included and classified into latent autoimmune diabetes in adults (n = 55), ketosis-prone type 2 mellitus (n = 146), and nonketotic type 2 mellitus (n = 93) groups. LADA: Latent autoimmune diabetes in adult; KP: Ketosis-prone; T2DM: Type 2 diabetes mellitus.
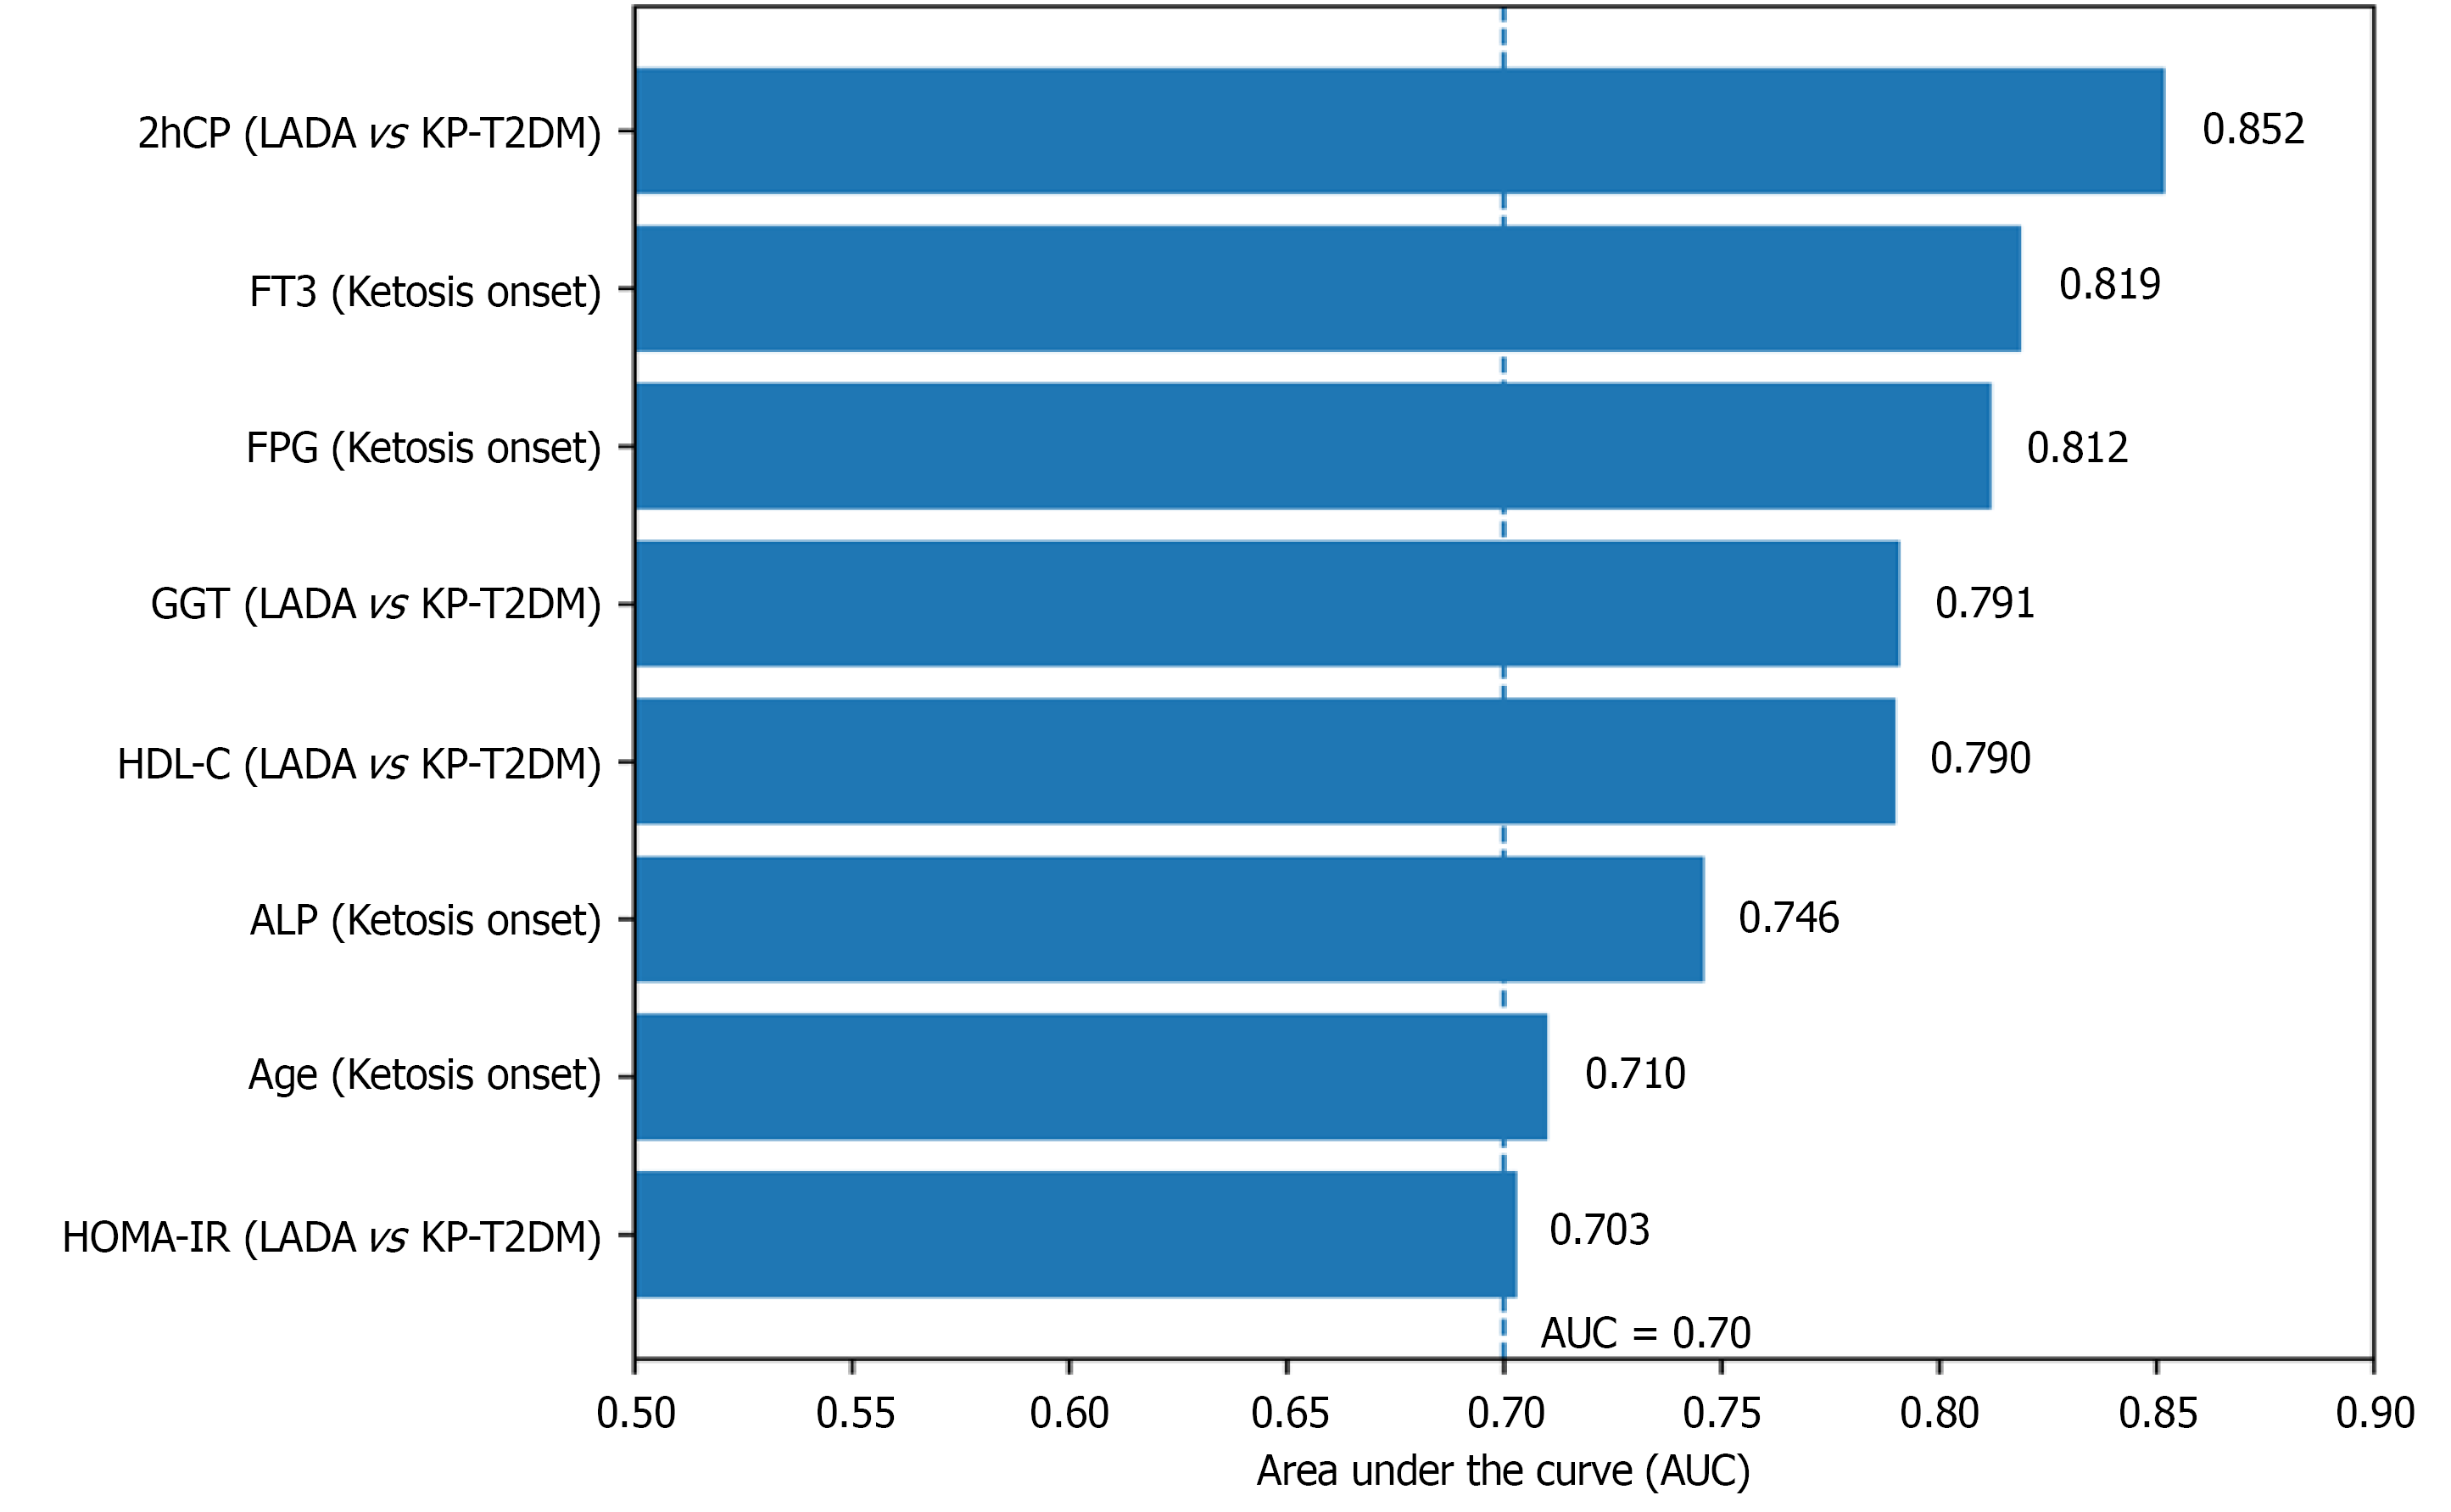
Figure 2 Diagnostic performance of key biomarkers for predicting ketosis onset.
Receiver operating characteristic analysis based on summary statistics from Table 3 free triiodothyronine and fasting plasma glucose showed relatively strong diagnostic performance, followed by alkaline phosphatase and age. The dashed line indicates an area under the curve of 0.70. 2hCP: 2 hours C-peptide; FT3: Free triiodothyronine; FPG: Fasting plasma glucose; GGT: Gamma-glutamyl transferase; LADA: Latent autoimmune diabetes in adult; KP: Ketosis-prone; T2DM: Type 2 diabetes mellitus; HDL-C: High-density lipoprotein cholesterol; ALP: Alkaline phosphatase; HOMA-IR: Homeostasis model assessment-insulin resistance; AUC: Area under the curve.
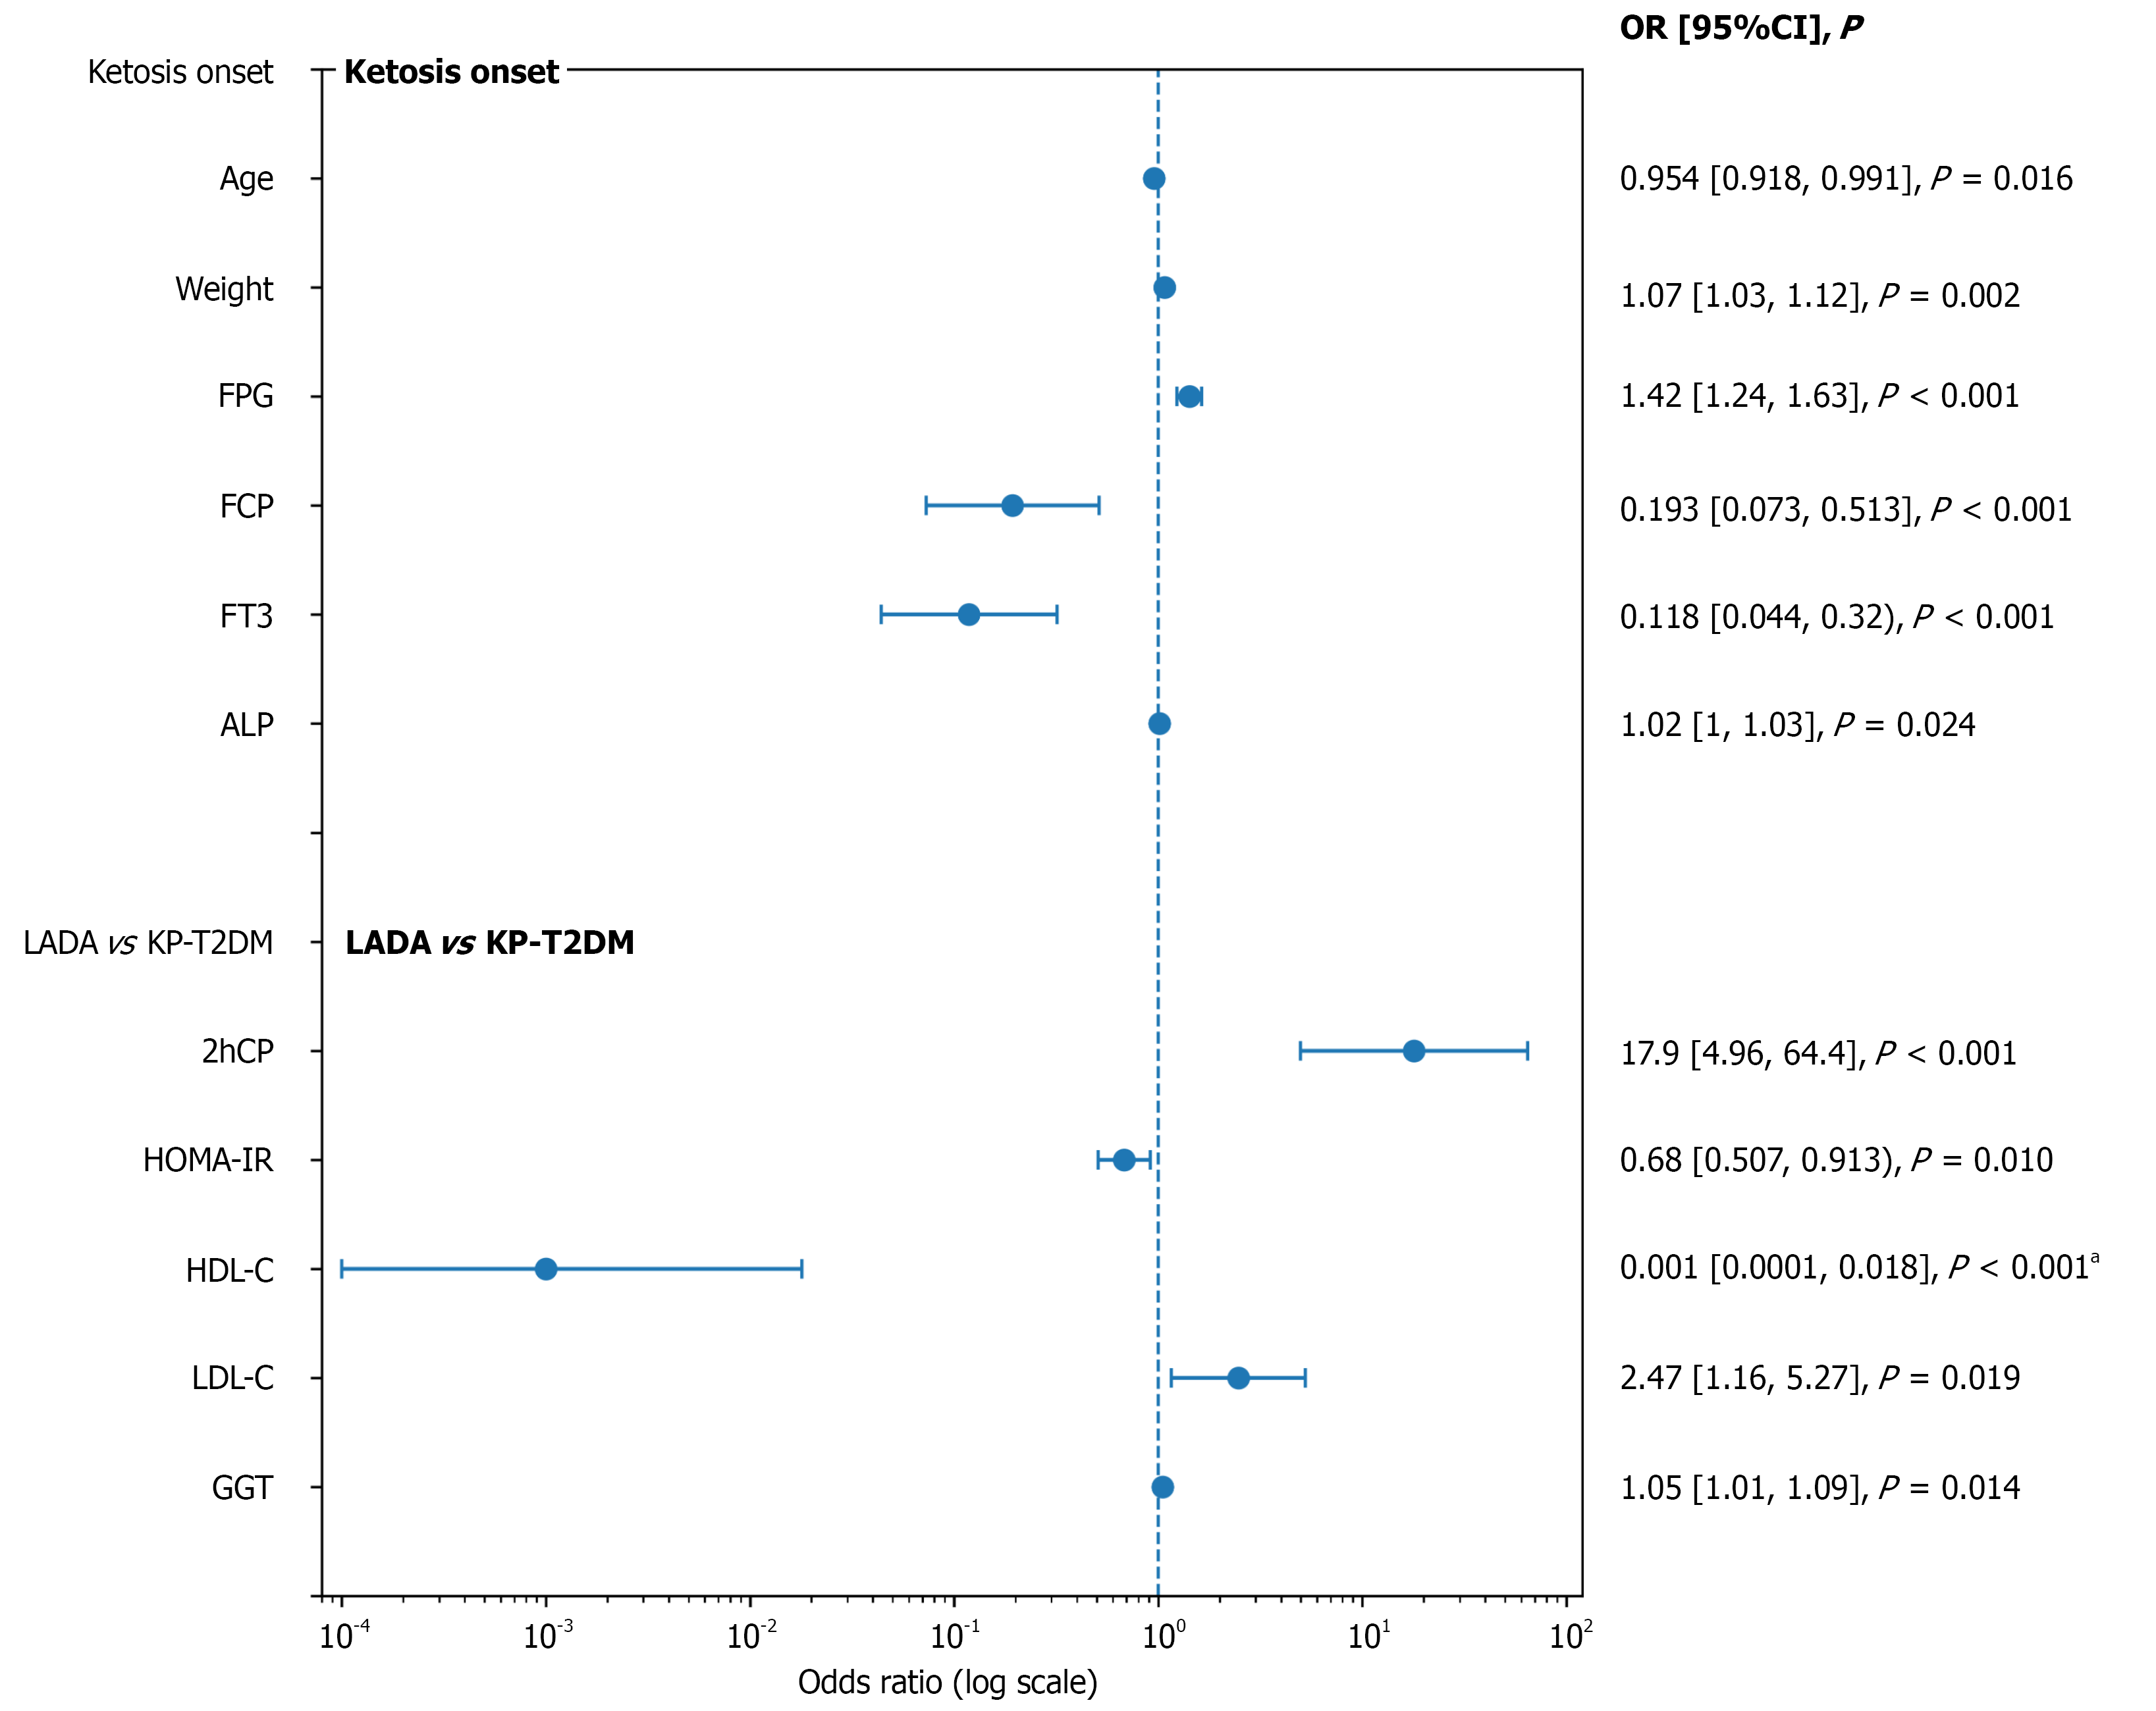
Figure 3 Multivariate logistic regression analysis for predictors of ketosis onset and latent autoimmune diabetes in adult classification.
Odds ratios (ORs) and 95% confidence intervals are shown on a logarithmic scale. Variables with OR < 1 are inversely associated, whereas variables with OR > 1 are positively associated with the outcome. aFor HDL-C, the lower CI was reported as 0.000 in the manuscript and was plotted as 0.0001 for log-scale display. FPG: Fasting plasma glucose; FCP: Fasting C-peptide; FT3: Free triiodothyronine; ALP: Alkaline phosphatase; LADA: Latent autoimmune diabetes in adult; KP: Ketosis-prone; T2DM: Type 2 diabetes mellitus; 2hCP: 2 hours C-peptide; HOMA-IR: Homeostasis model assessment-insulin resistance; HDL-C: High-density lipoprotein cholesterol; LDL-C: Low-density lipoprotein cholesterol; GGT: Gamma-glutamyl transferase; OR: Odds ratio; CI: Confidence interval.
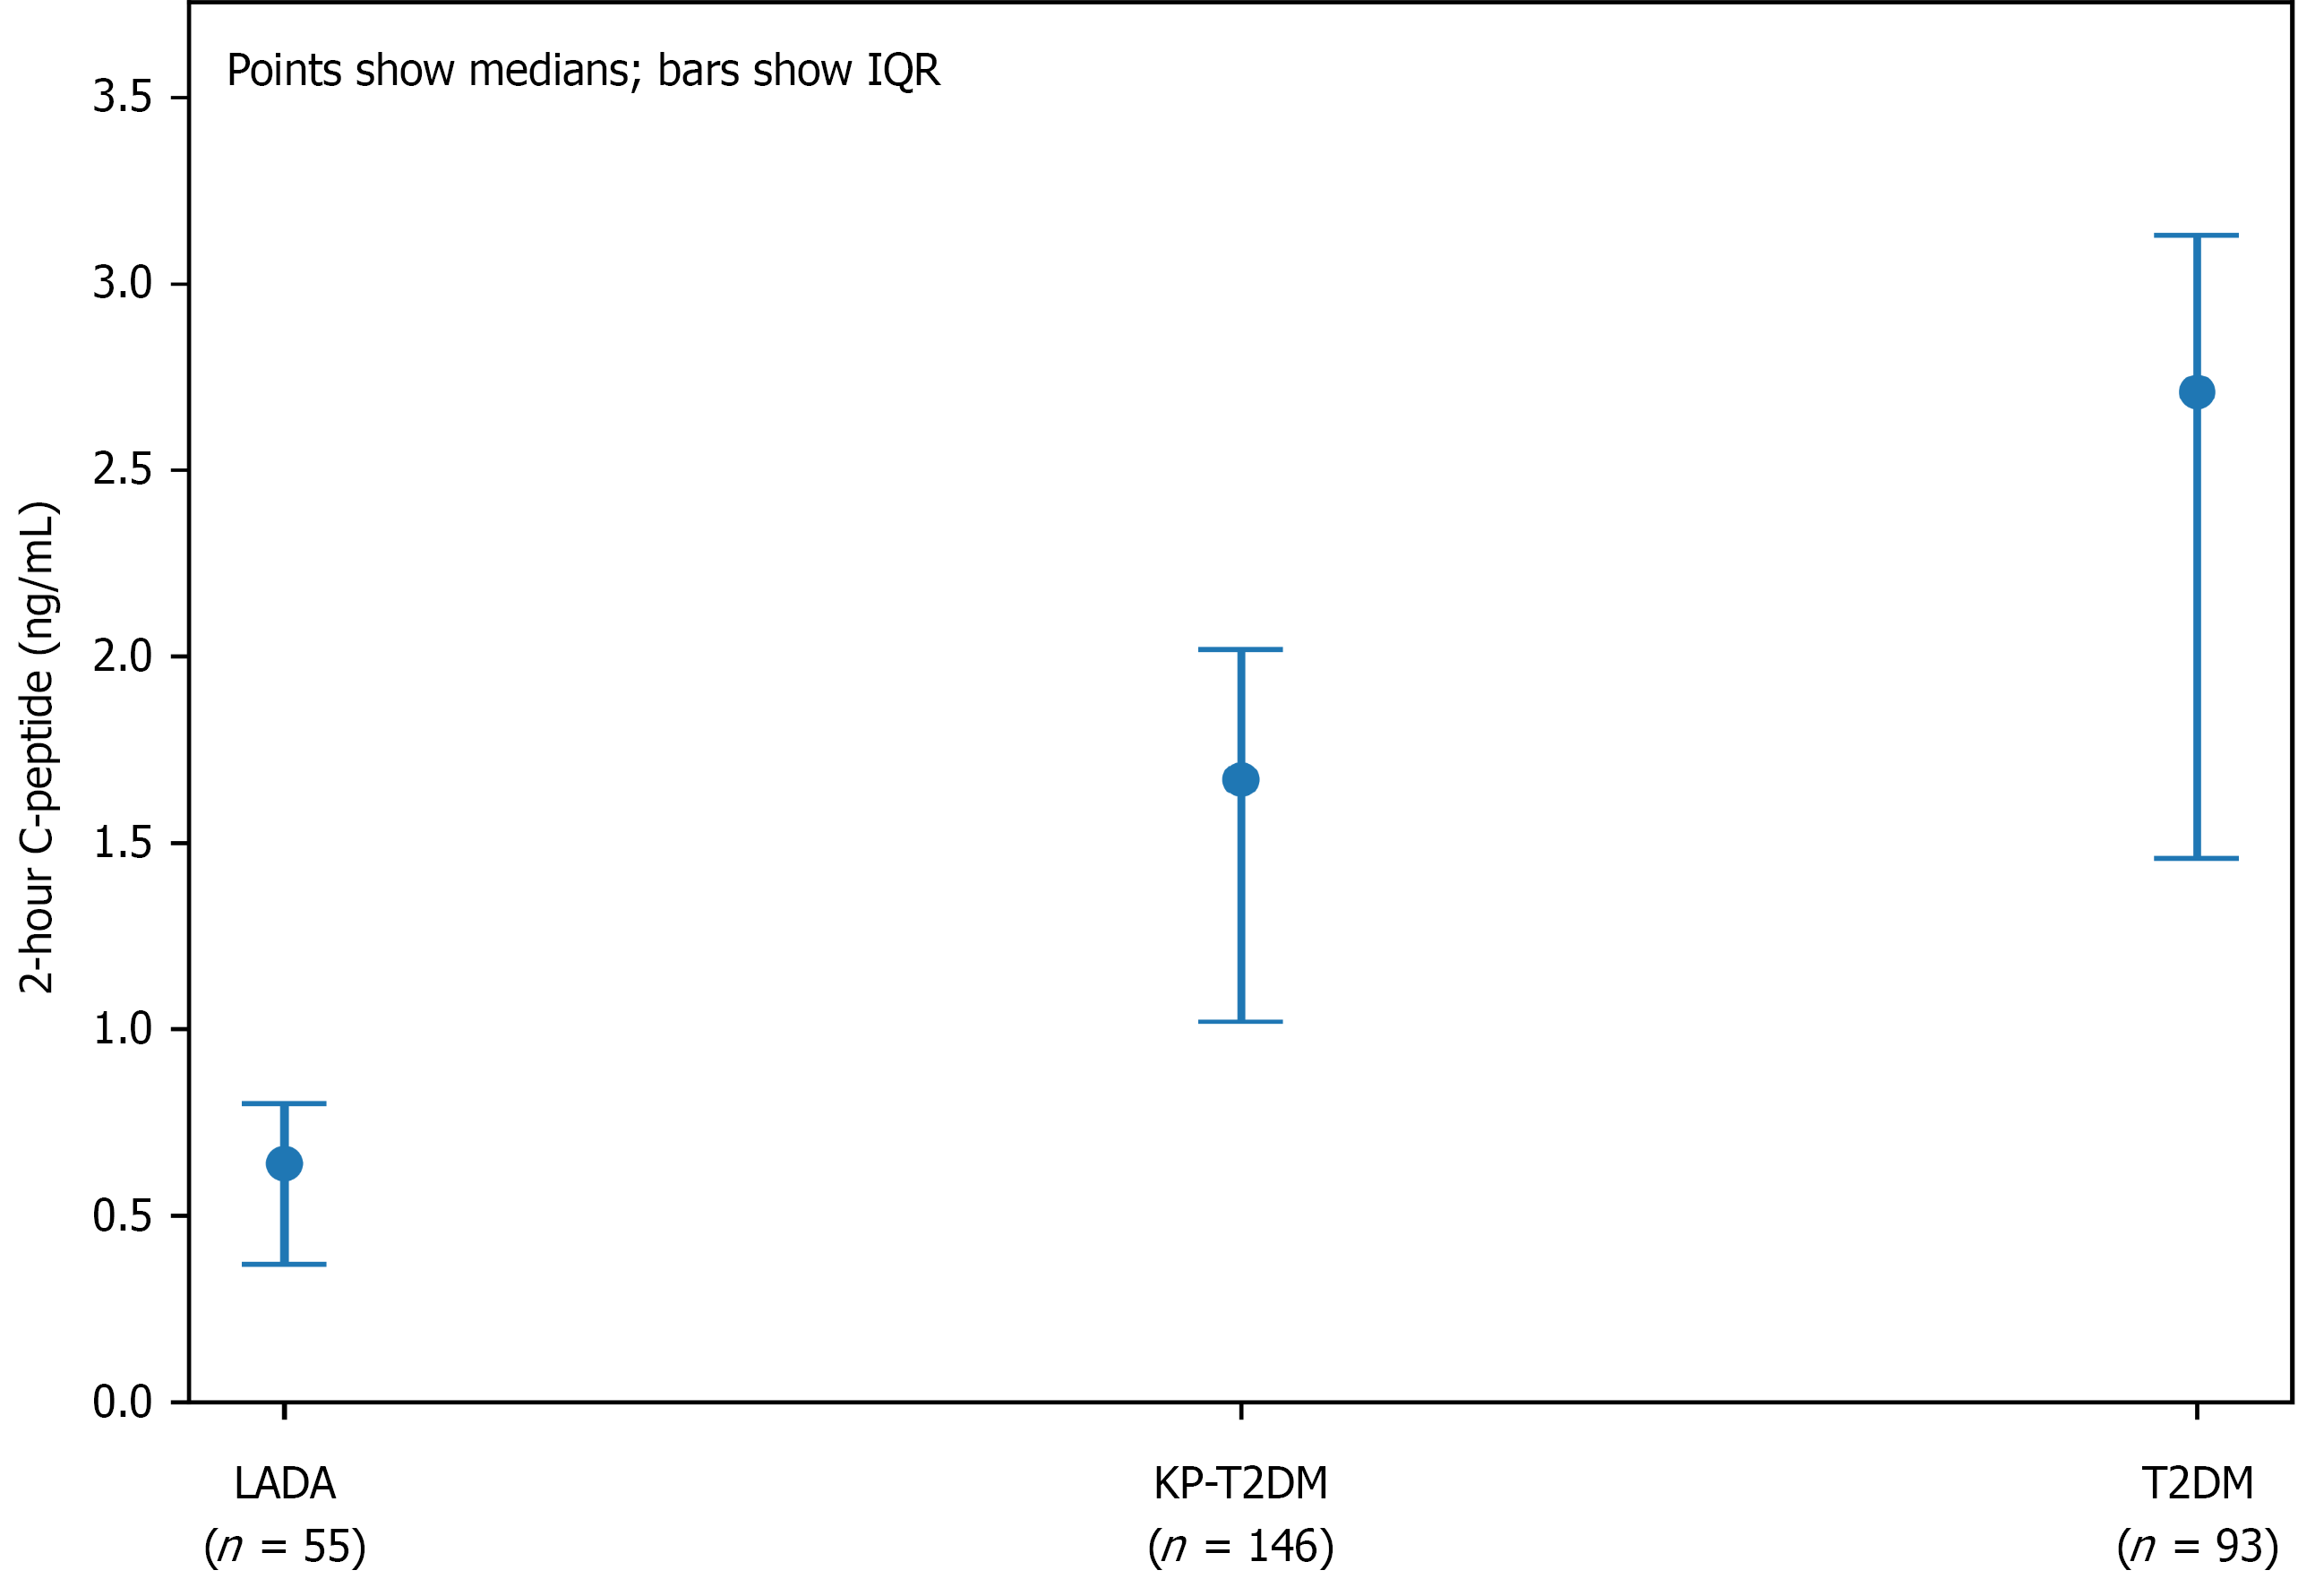
Figure 4 Distribution of 2 hours C-peptide across study groups.
Median and interquartile range values are shown for latent autoimmune diabetes in adult, ketosis-prone type 2 diabetes mellitus (T2DM), and nonketotic T2DM groups. Postprandial C-peptide levels were markedly lower in latent autoimmune diabetes in adult compared with ketosis-prone T2DM and T2DM. LADA: Latent autoimmune diabetes in adult; KP: Ketosis-prone; T2DM: Type 2 diabetes mellitus; IQR: Interquartile rage.
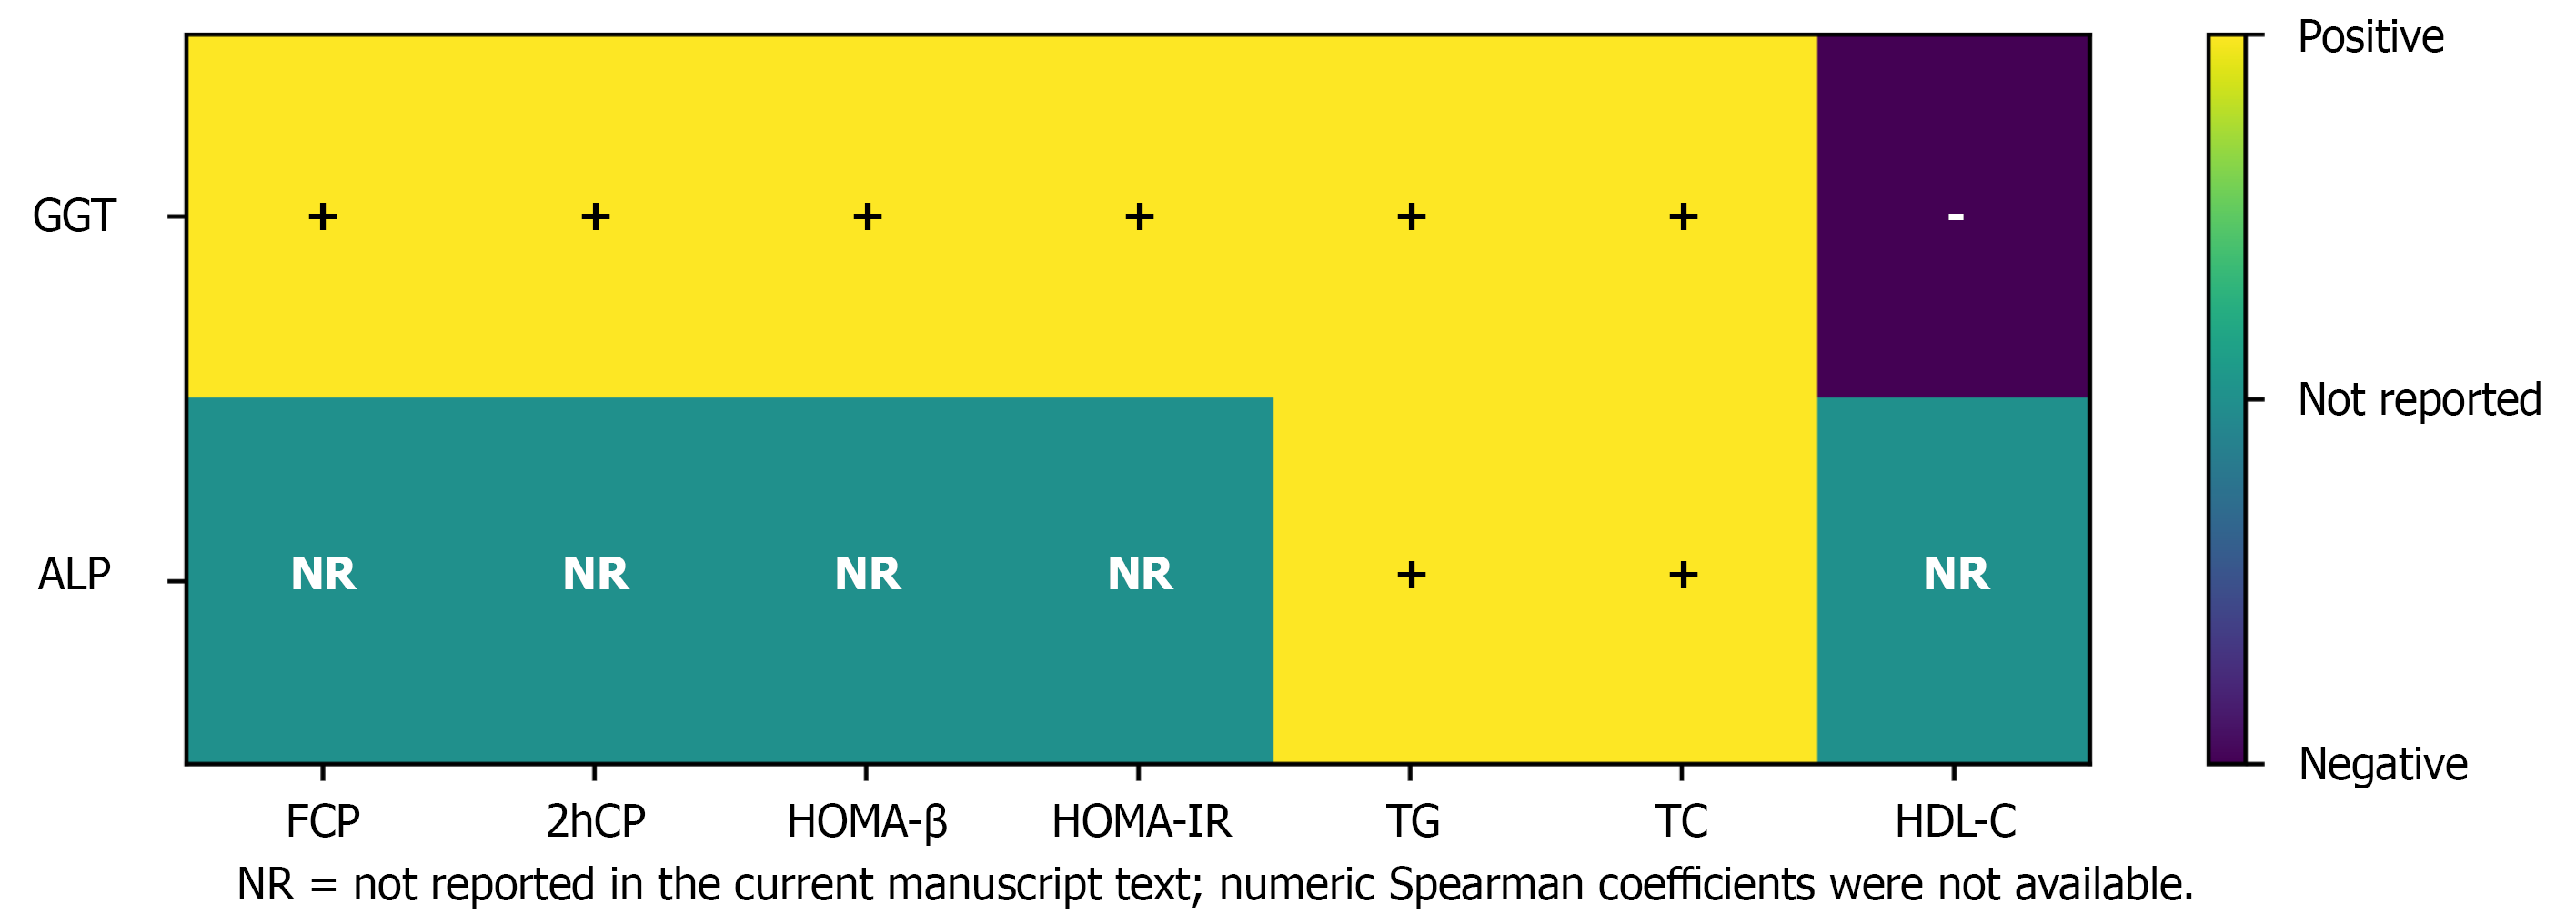
Figure 5 Summary of reported correlations between liver enzymes and metabolic parameters.
The heatmap illustrates the direction of associations between gamma-glutamyl transferase, alkaline phosphatase, and selected metabolic indices. Positive correlations are indicated by “+”, negative correlations by “-”, and “NR” indicates not reported in the current manuscript text. This figure summarizes reported trends rather than quantitative correlation coefficients. GGT: Gamma-glutamyl transferase; ALP: Alkaline phosphatase; FCP: Fasting C-peptide; 2hCP: 2 hours C-peptide; HOMA: Homeostasis model assessment; IR: Insulin resistance; TG: Triglycerides; TC: Total cholesterol; HDL-C: High-density lipoprotein cholesterol; NR: Not reported.
- Citation: Pei SQ, Ren JL, Zhang L, Gao YX, Yang X, Liu X, Li SN, Liu P, Xu XY. Non-antibody biomarkers for differentiating ketosis-onset diabetes: A retrospective study. World J Diabetes 2026; 17(8): 122101
- URL: https://www.wjgnet.com/1948-9358/full/v17/i8/122101.htm
- DOI: https://dx.doi.org/10.4239/wjd.122101