
















Copyright: ©Author(s) 2026.
World J Diabetes. Aug 15, 2026; 17(8): 121923
Published online Aug 15, 2026. doi: 10.4239/wjd.121923
Published online Aug 15, 2026. doi: 10.4239/wjd.121923
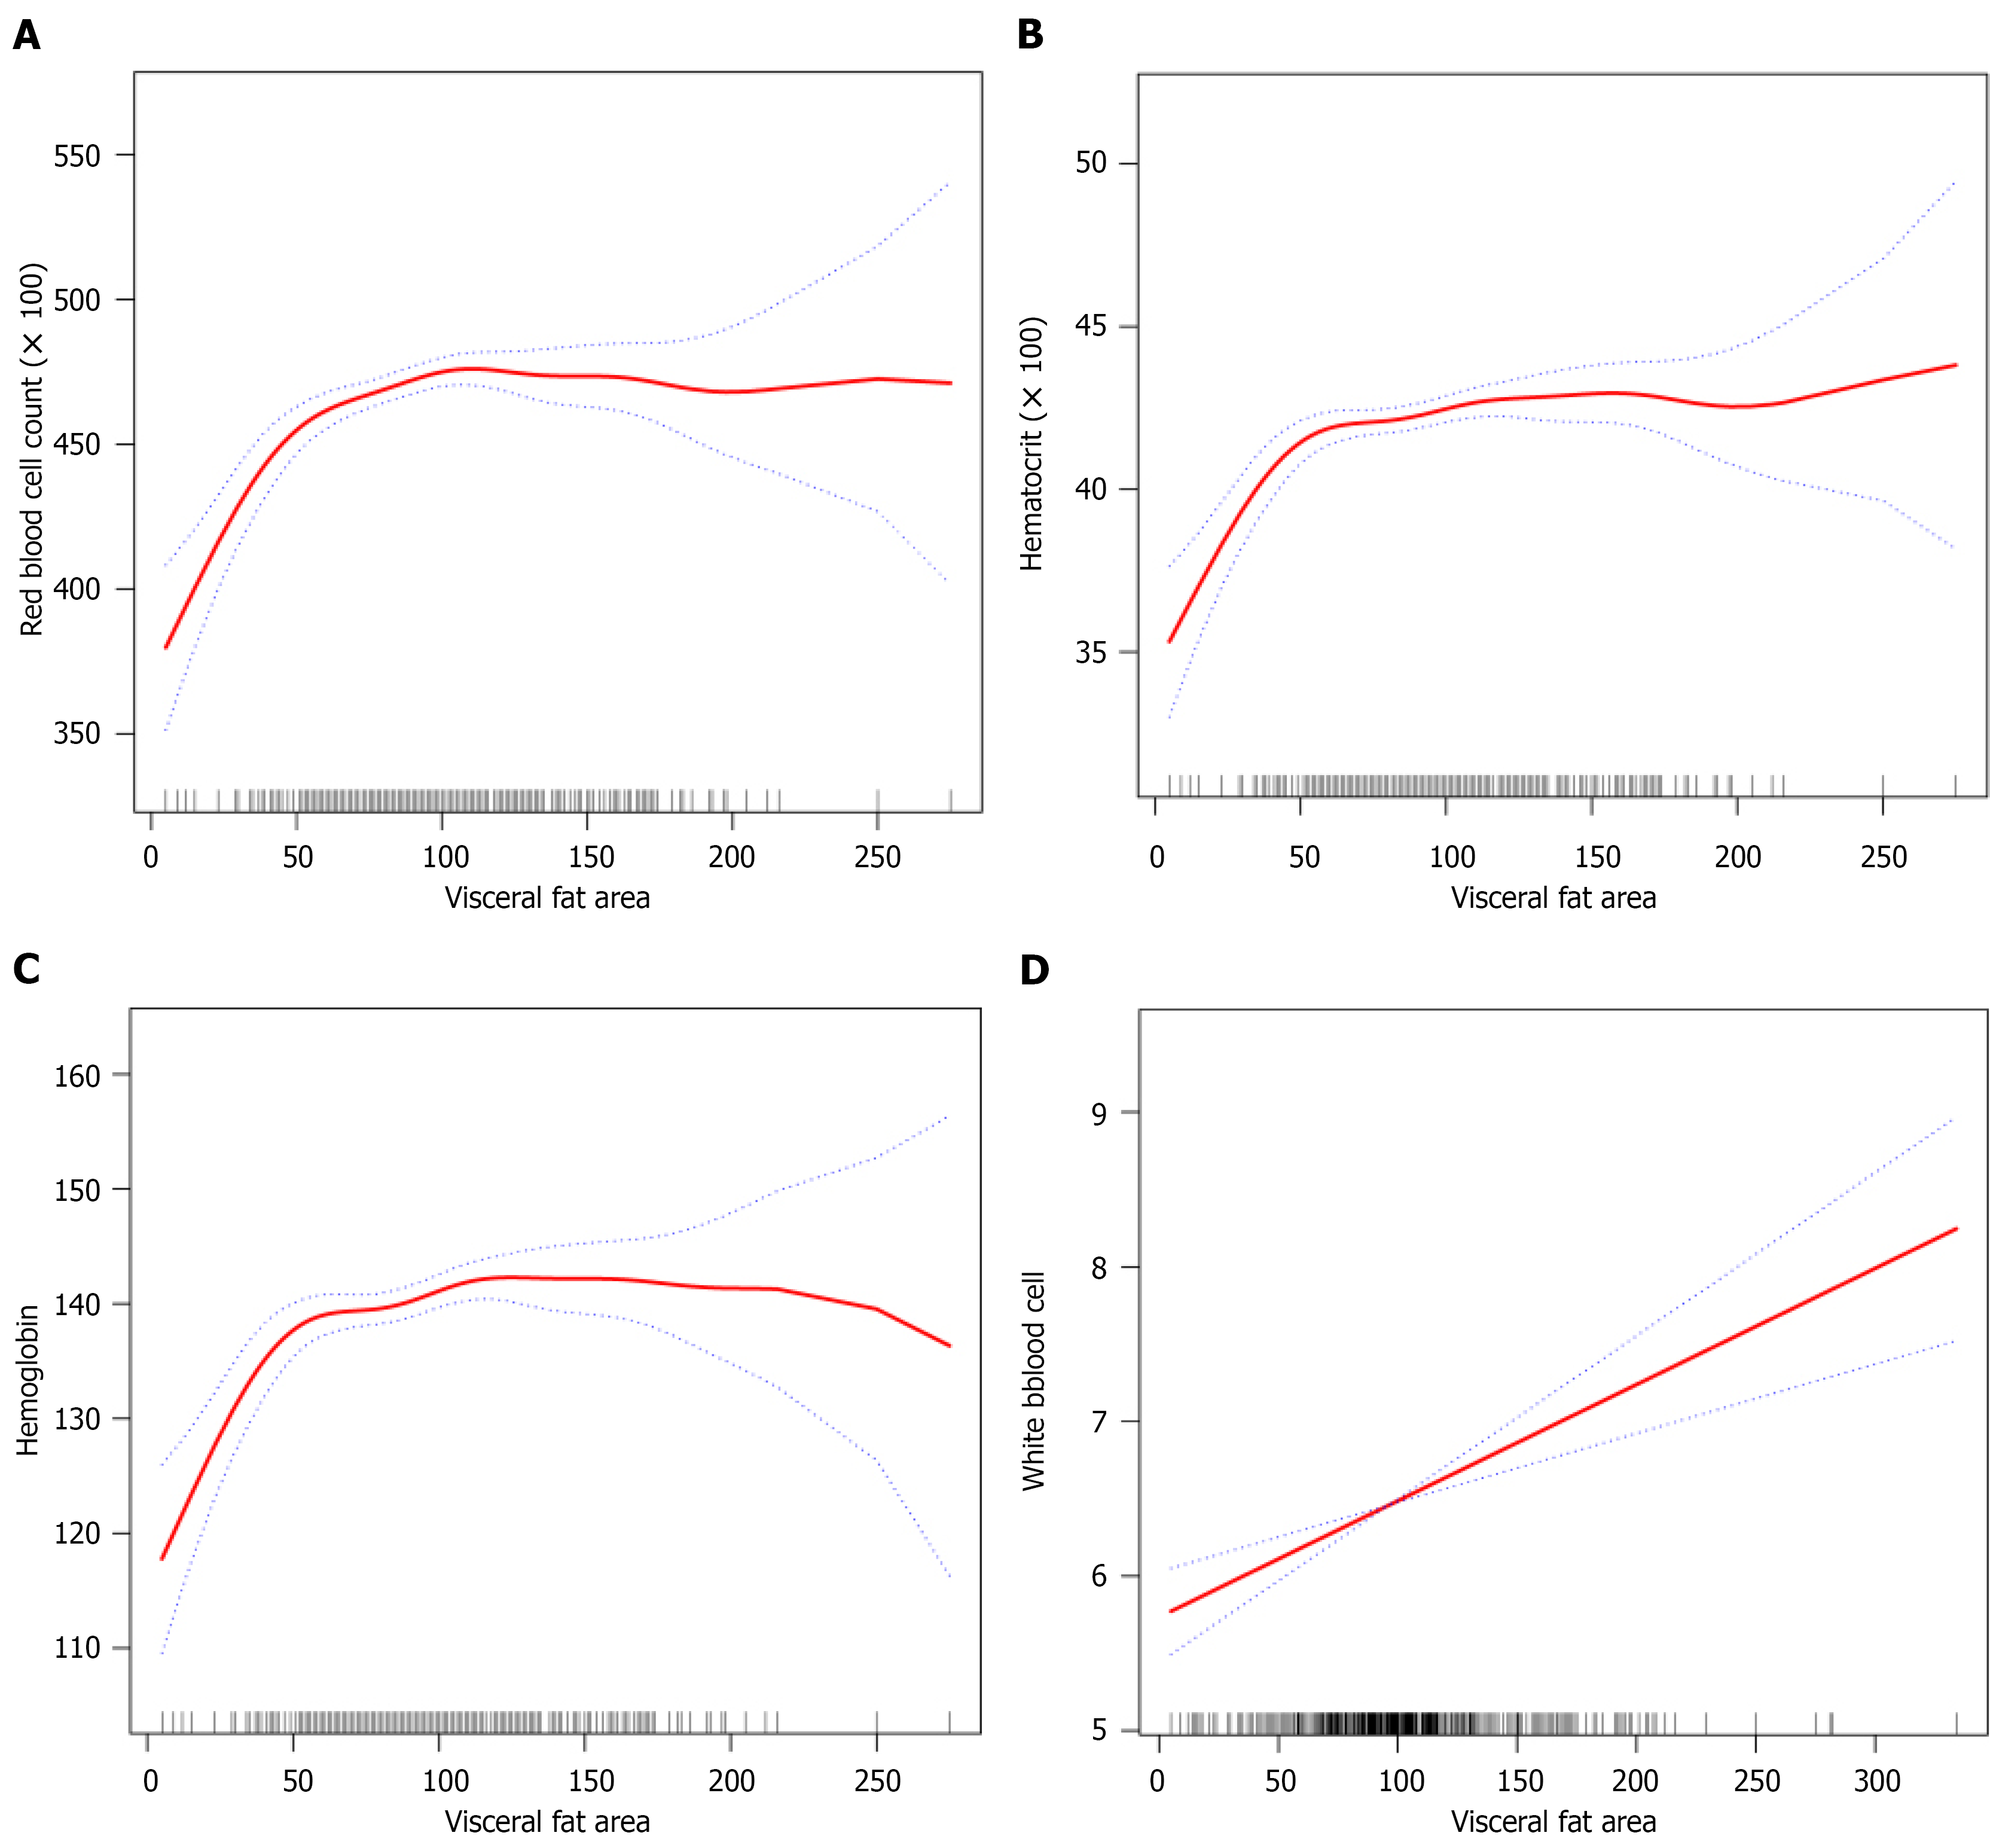
Figure 1 Smoothed dose-response relationships between visceral fat area and hematologic indices.
A: Red blood cell count (× 100); B: Hematocrit (× 100); C: Hemoglobin; D: White blood cell. The solid red lines represent the estimated smooth functions, and the dashed blue lines indicate 95% confidence intervals. Rug plots along the X-axis denote the distribution of visceral fat area (VFA). While red blood cell, hematocrit, and hemoglobin (Figure 1A-C) exhibit a rapid initial increase followed by a plateau at higher VFA levels (suggesting non-linear associations), the white blood cell count (Figure 1D) shows a consistent linear increase across the entire observed range of visceral adiposity.
- Citation: Rao ZC, Xu CY, Hua LY, Fang ZR, Zhu CY, Zhang YM. Visceral fat area and red-blood-cell-related indices in adults with type 2 diabetes: Cross-sectional evidence of nonlinear associations. World J Diabetes 2026; 17(8): 121923
- URL: https://www.wjgnet.com/1948-9358/full/v17/i8/121923.htm
- DOI: https://dx.doi.org/10.4239/wjd.121923