
















Copyright: ©Author(s) 2026.
World J Diabetes. Aug 15, 2026; 17(8): 121422
Published online Aug 15, 2026. doi: 10.4239/wjd.121422
Published online Aug 15, 2026. doi: 10.4239/wjd.121422
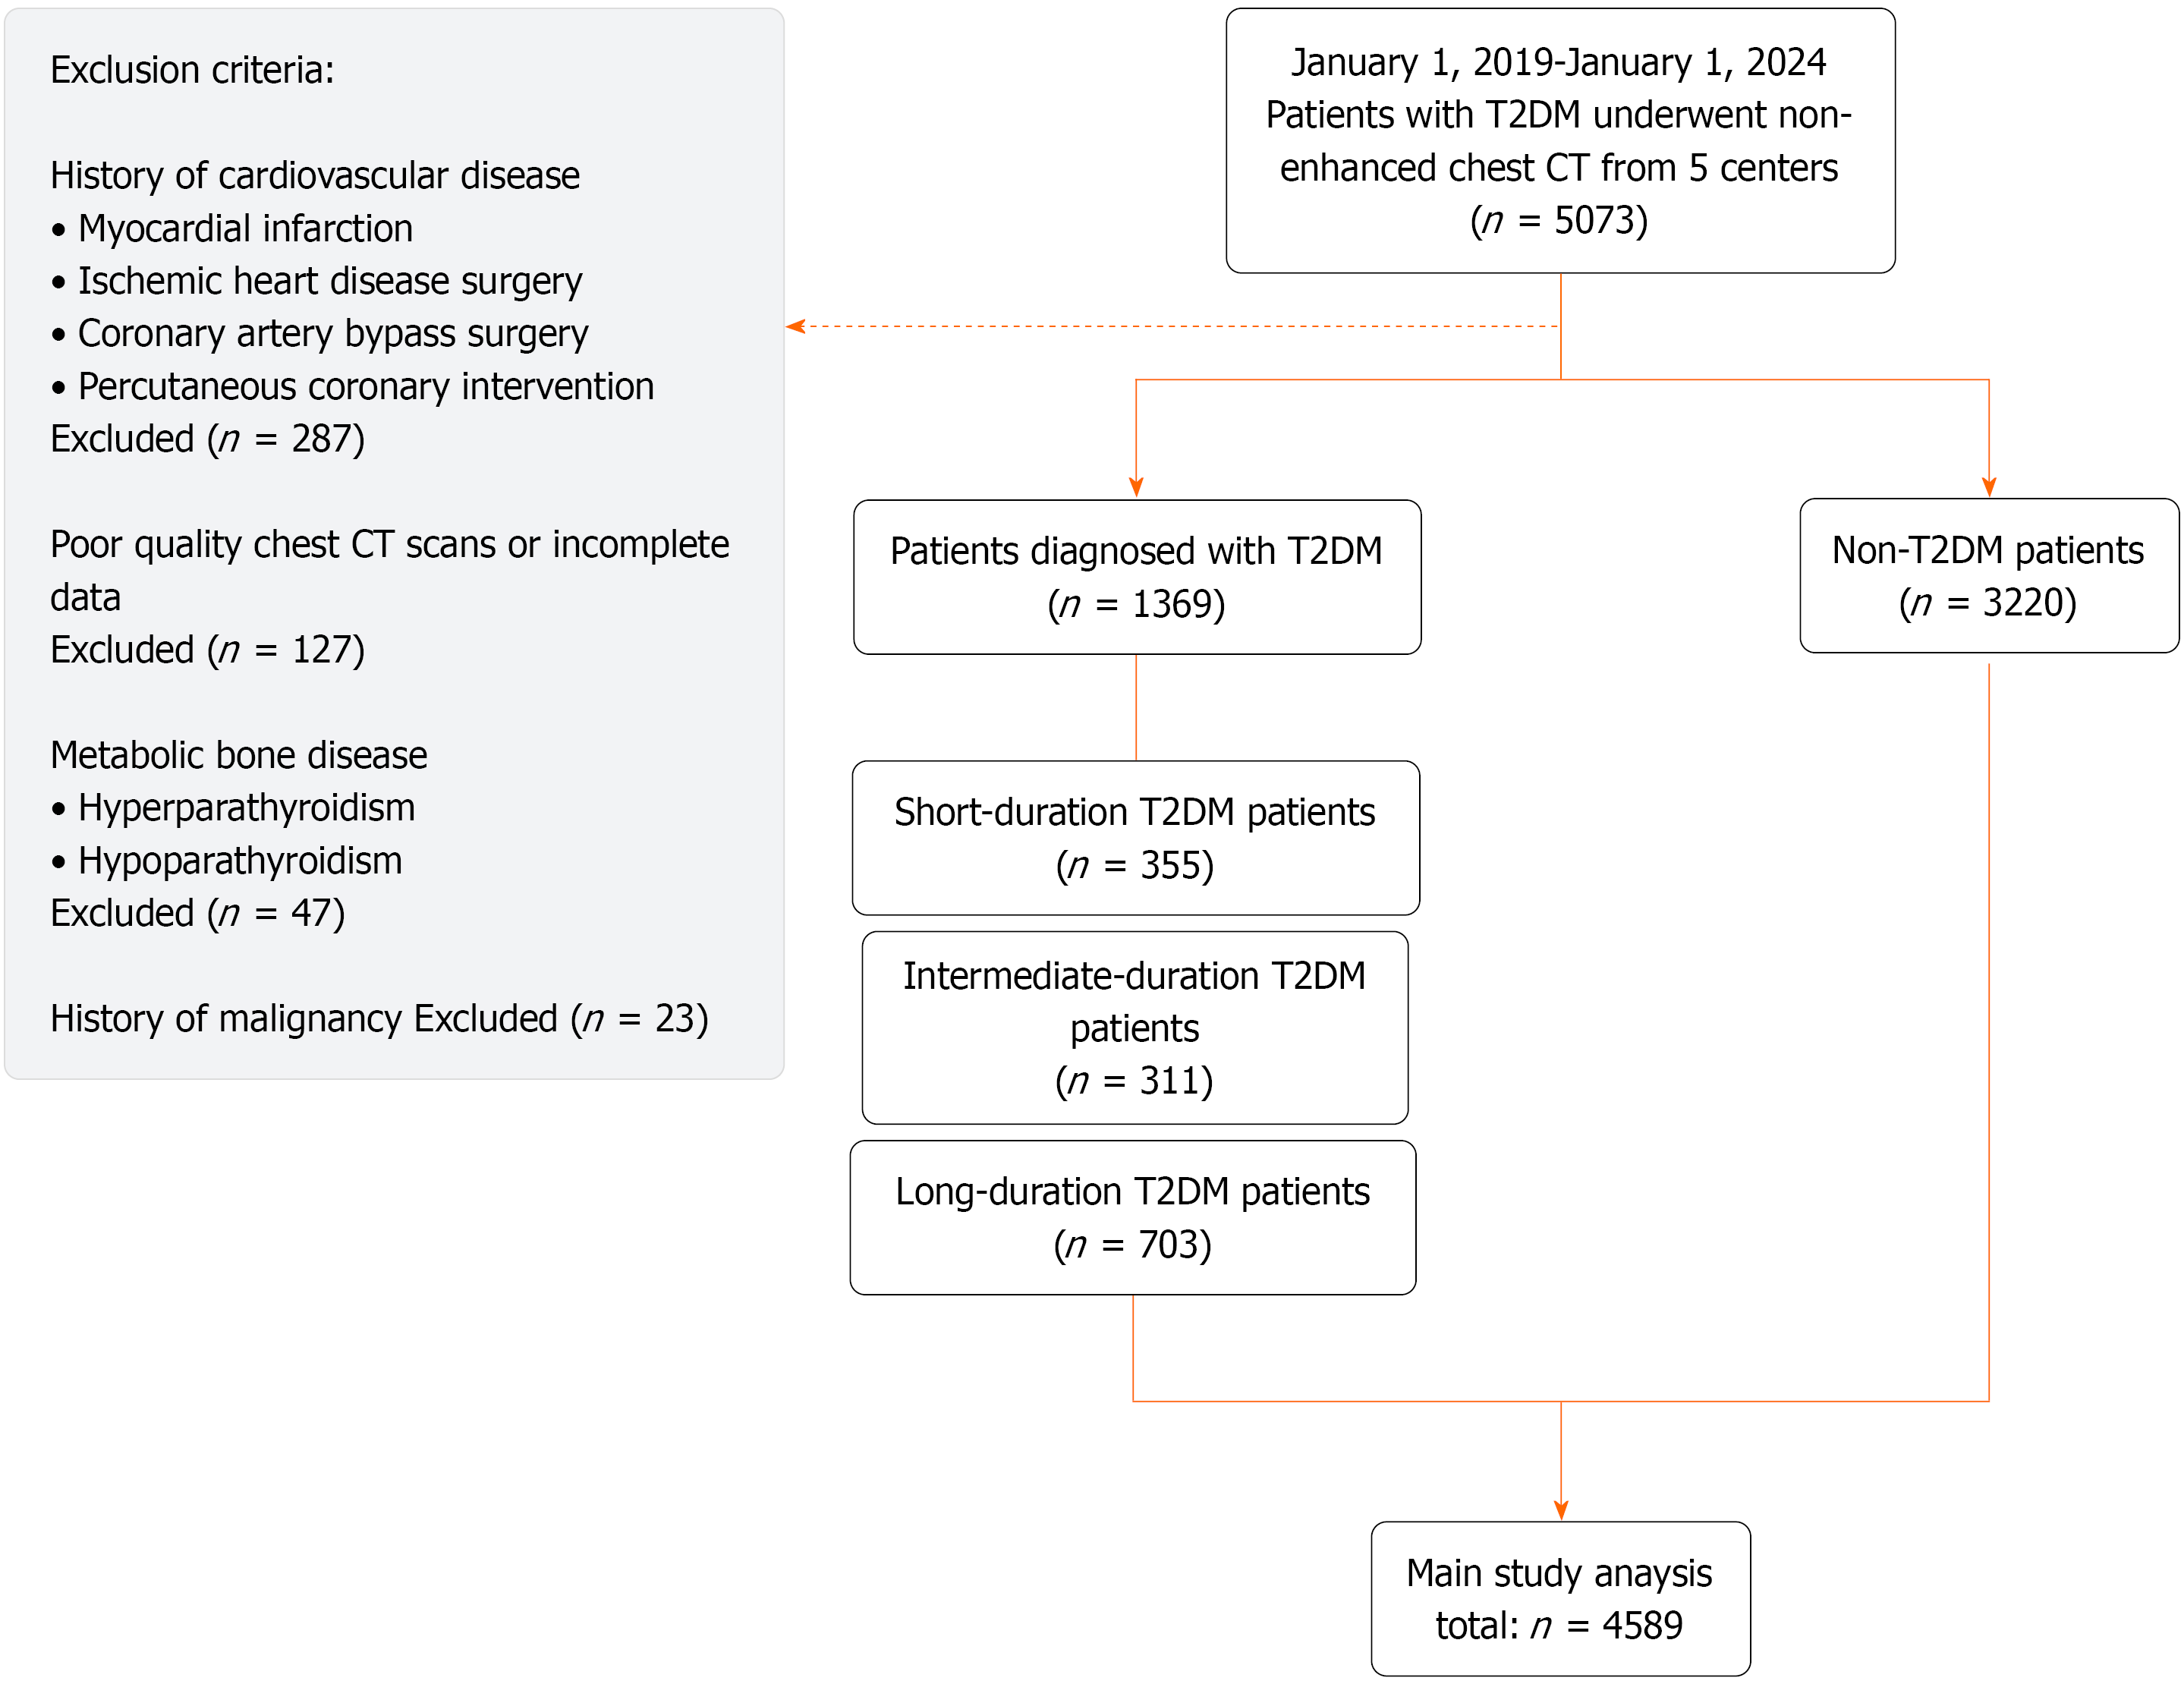
Figure 1 Flowchart showing the study design.
T2DM: Type 2 diabetes mellitus; CT: Computed tomography.
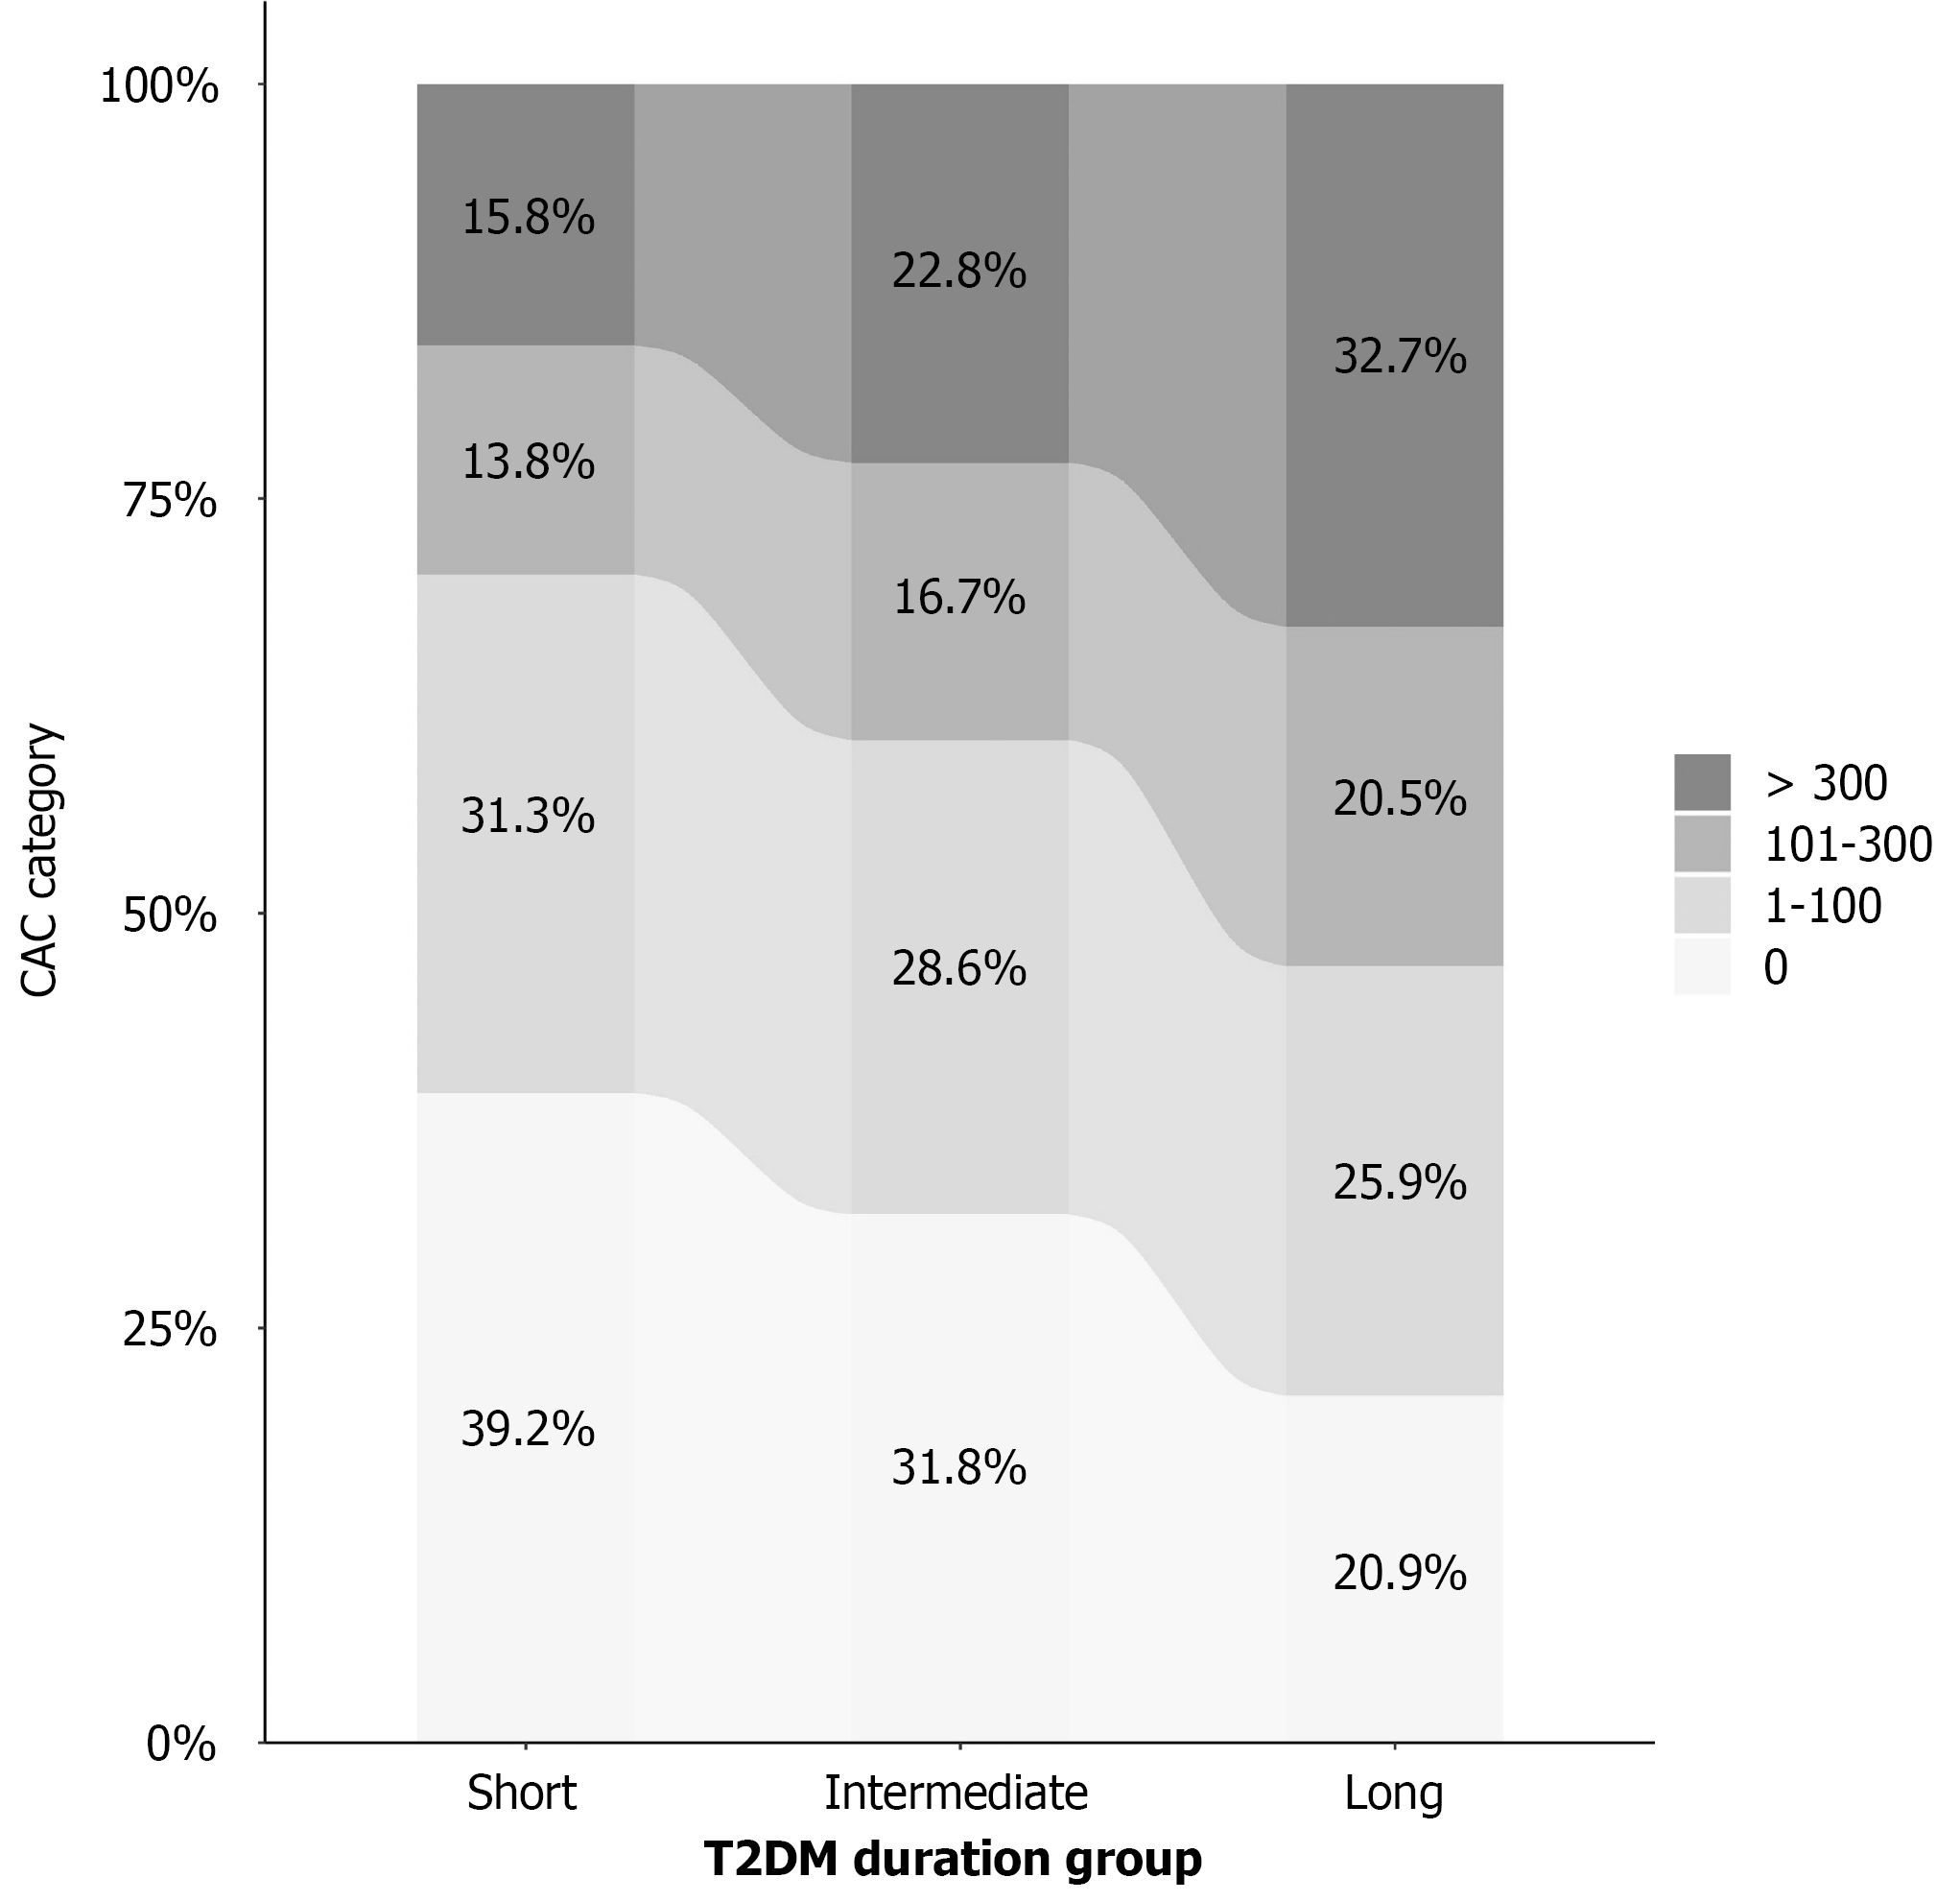
Figure 2 Distribution of coronary artery calcification severity across type 2 diabetes mellitus duration groups.
CAC: Coronary artery calcification; T2DM: Type 2 diabetes mellitus.
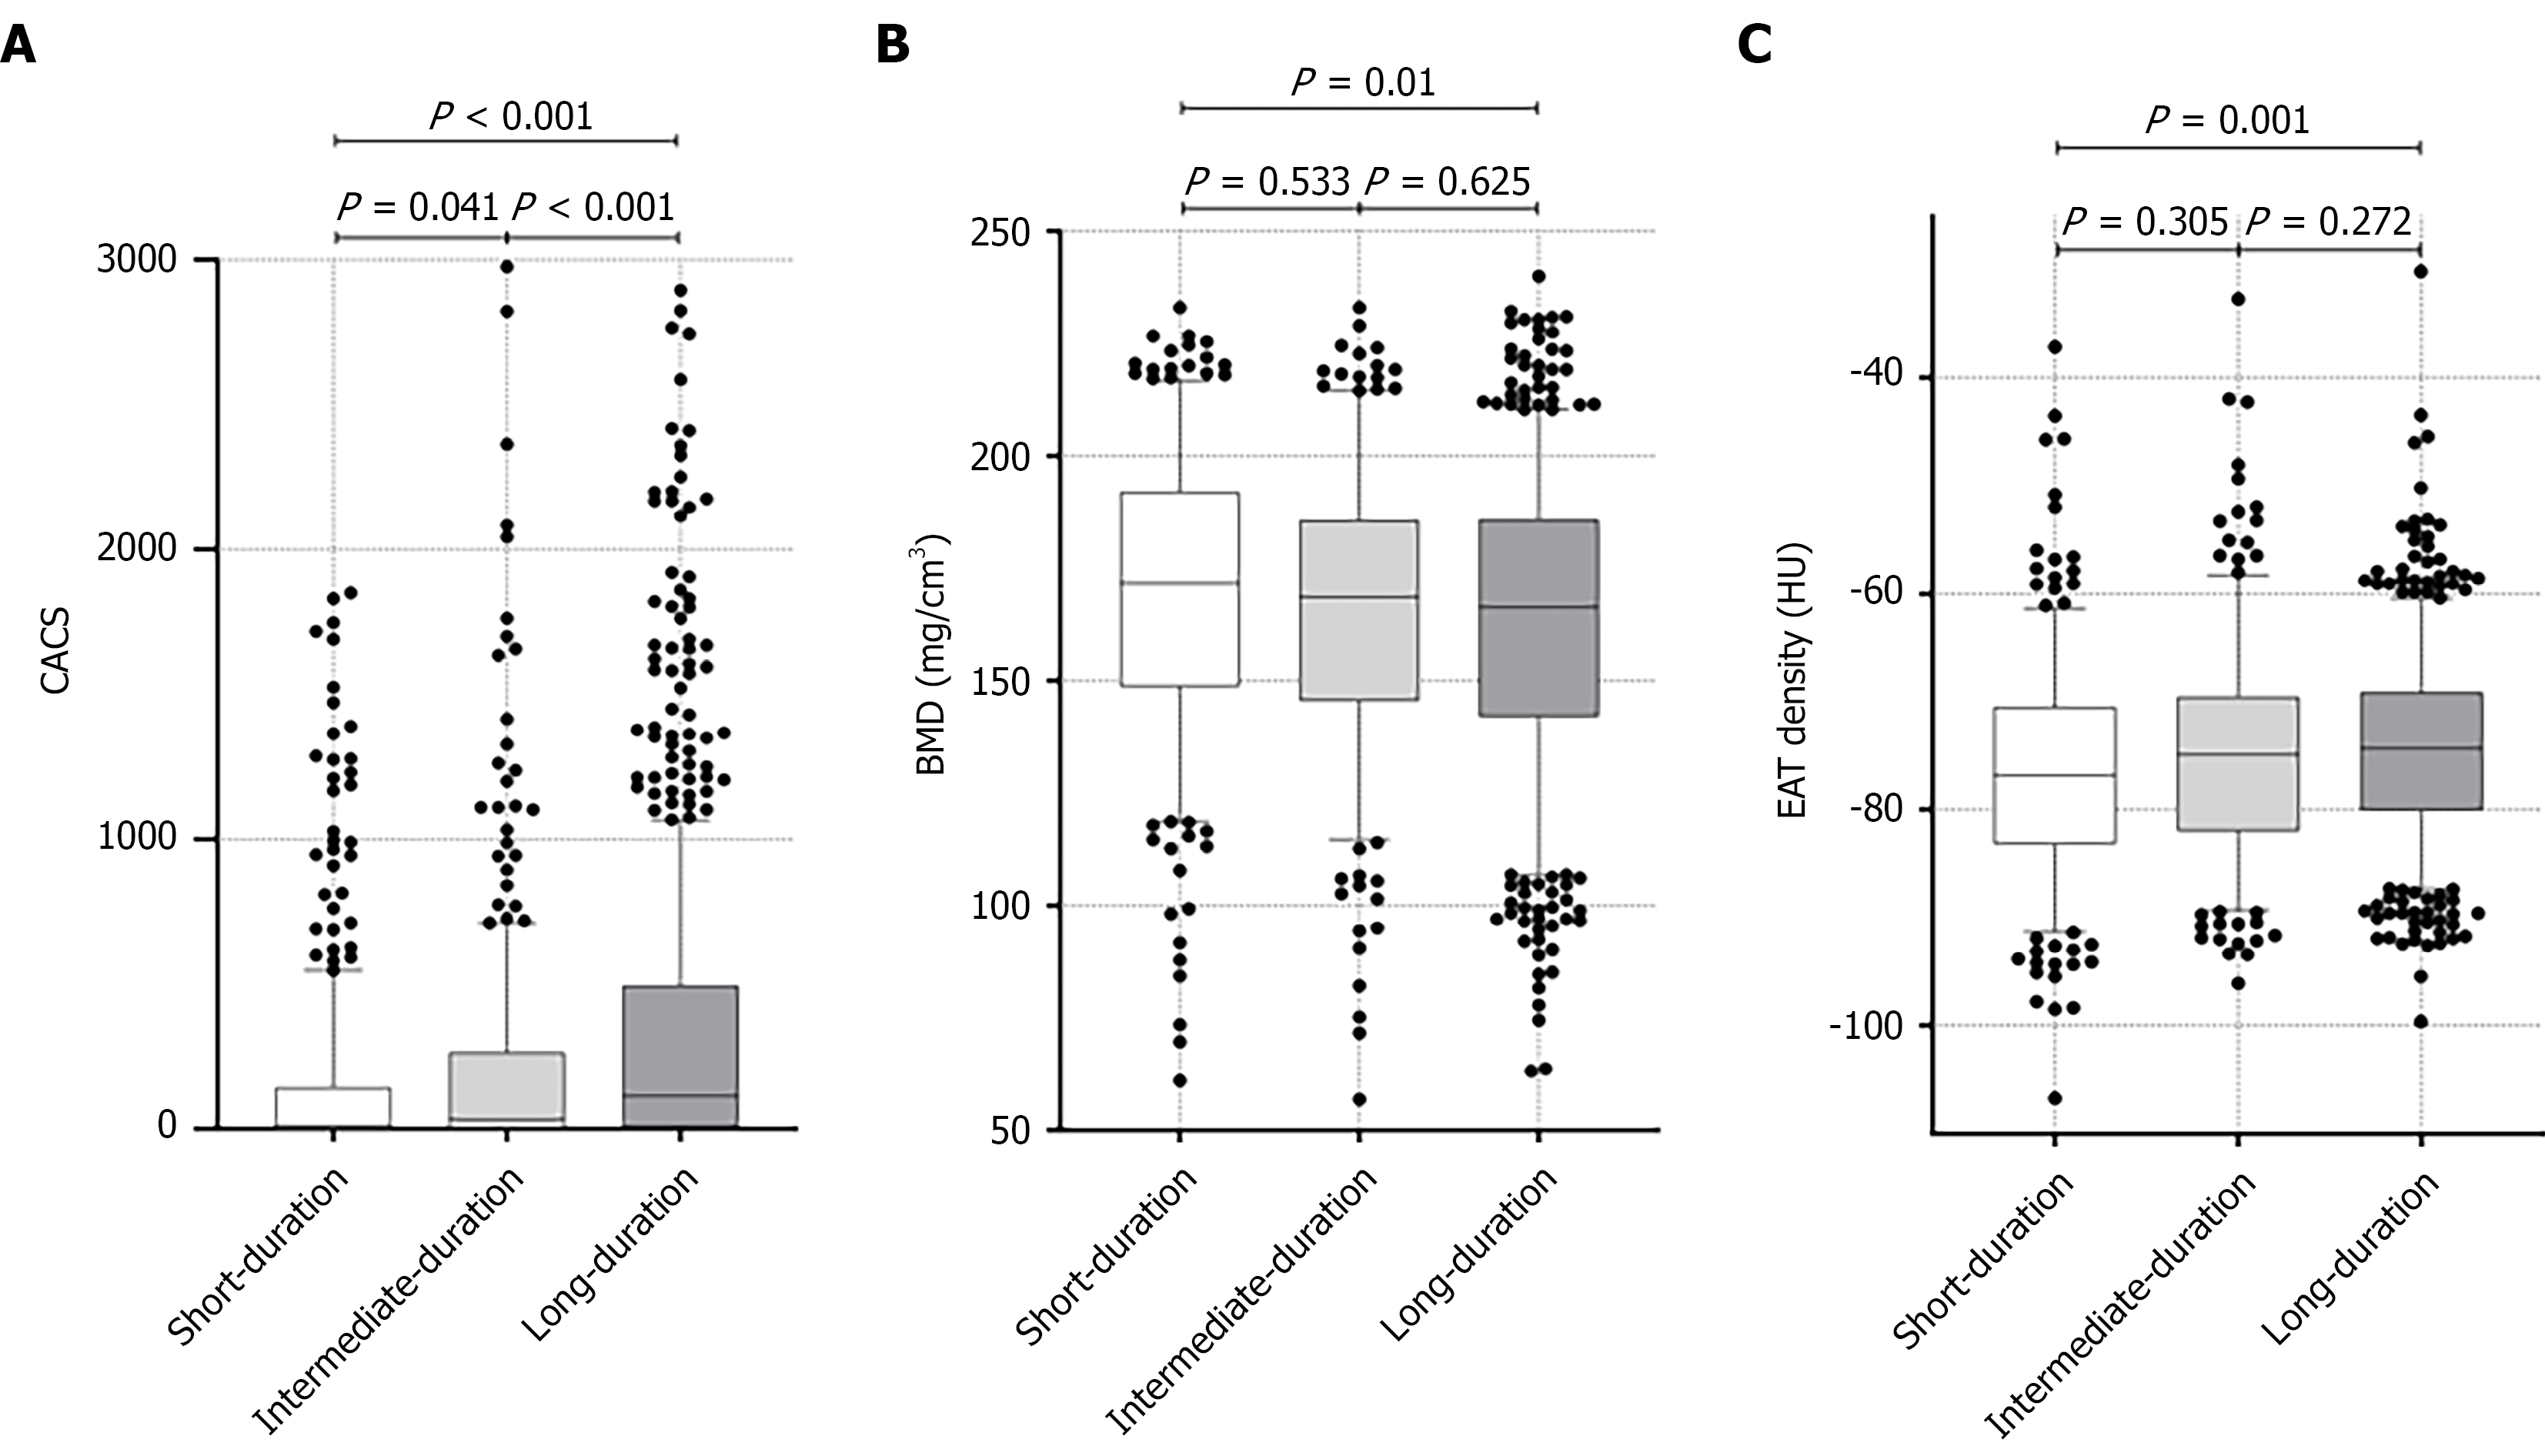
Figure 3 Comparison of bone mineral density, severe coronary artery calcification, and epicardial adipose tissue density among type 2 diabetes mellitus patients with different durations.
A: Severe coronary artery calcification; B: Bone mineral density; C: Epicardial adipose tissue. Data are presented as the median (interquartile range). Comparisons among the three groups were performed using one-way analysis of variance, with P values indicated at the top of each panel. SCAC: Severe coronary artery calcification; BMD: Bone mineral density; EAT: Epicardial adipose tissue; HU: Hounsfield unit.
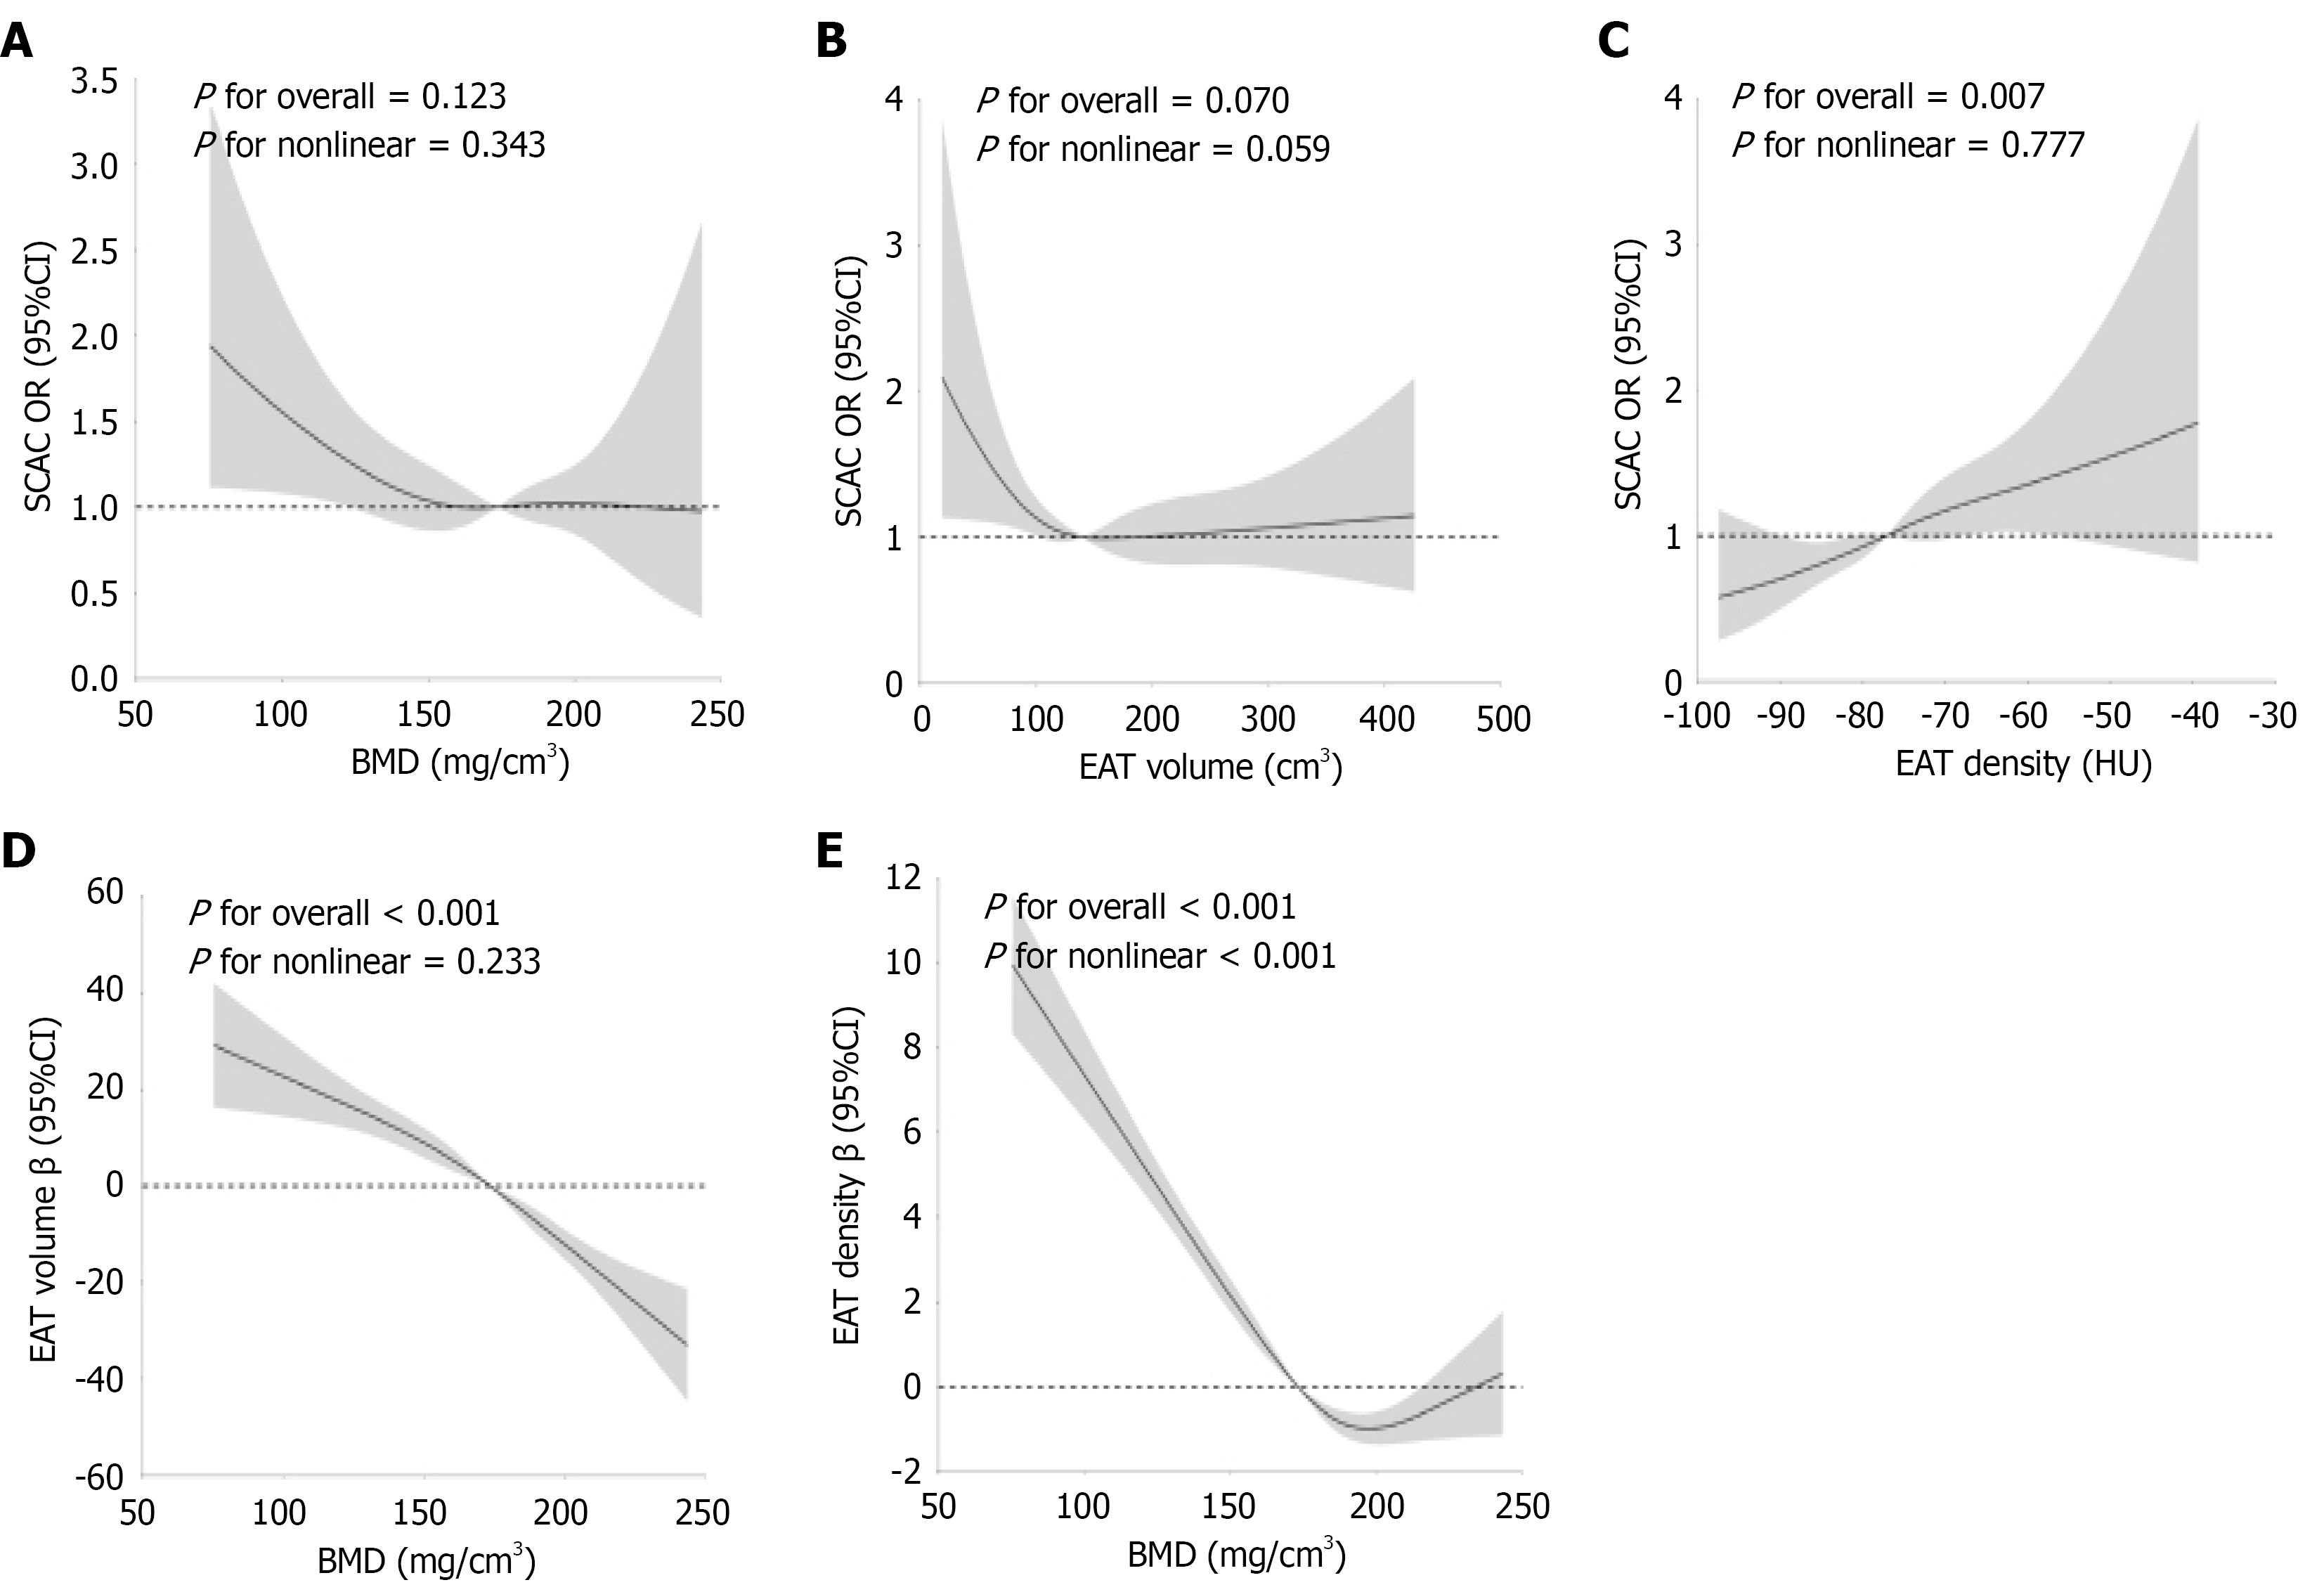
Figure 4 Restricted cubic spline analyses of the associations between computed tomography-derived imaging biomarkers.
The β coefficients and odds ratios are represented by solid lines, and the 95%CIs are indicated by shaded areas. Knots were positioned at the 5%, 35%, 65%, and 95% of each distribution. A: Bone mineral density (BMD) and severe coronary artery calcification (SCAC); B: Epicardial adipose tissue (EAT) volume and SCAC; C: EAT density and SCAC; D: BMD and EAT volume; E: BMD and EAT density. SCAC: Severe coronary artery calcification; BMD: Bone mineral density; EAT: Epicardial adipose tissue; OR: Odds ratio.
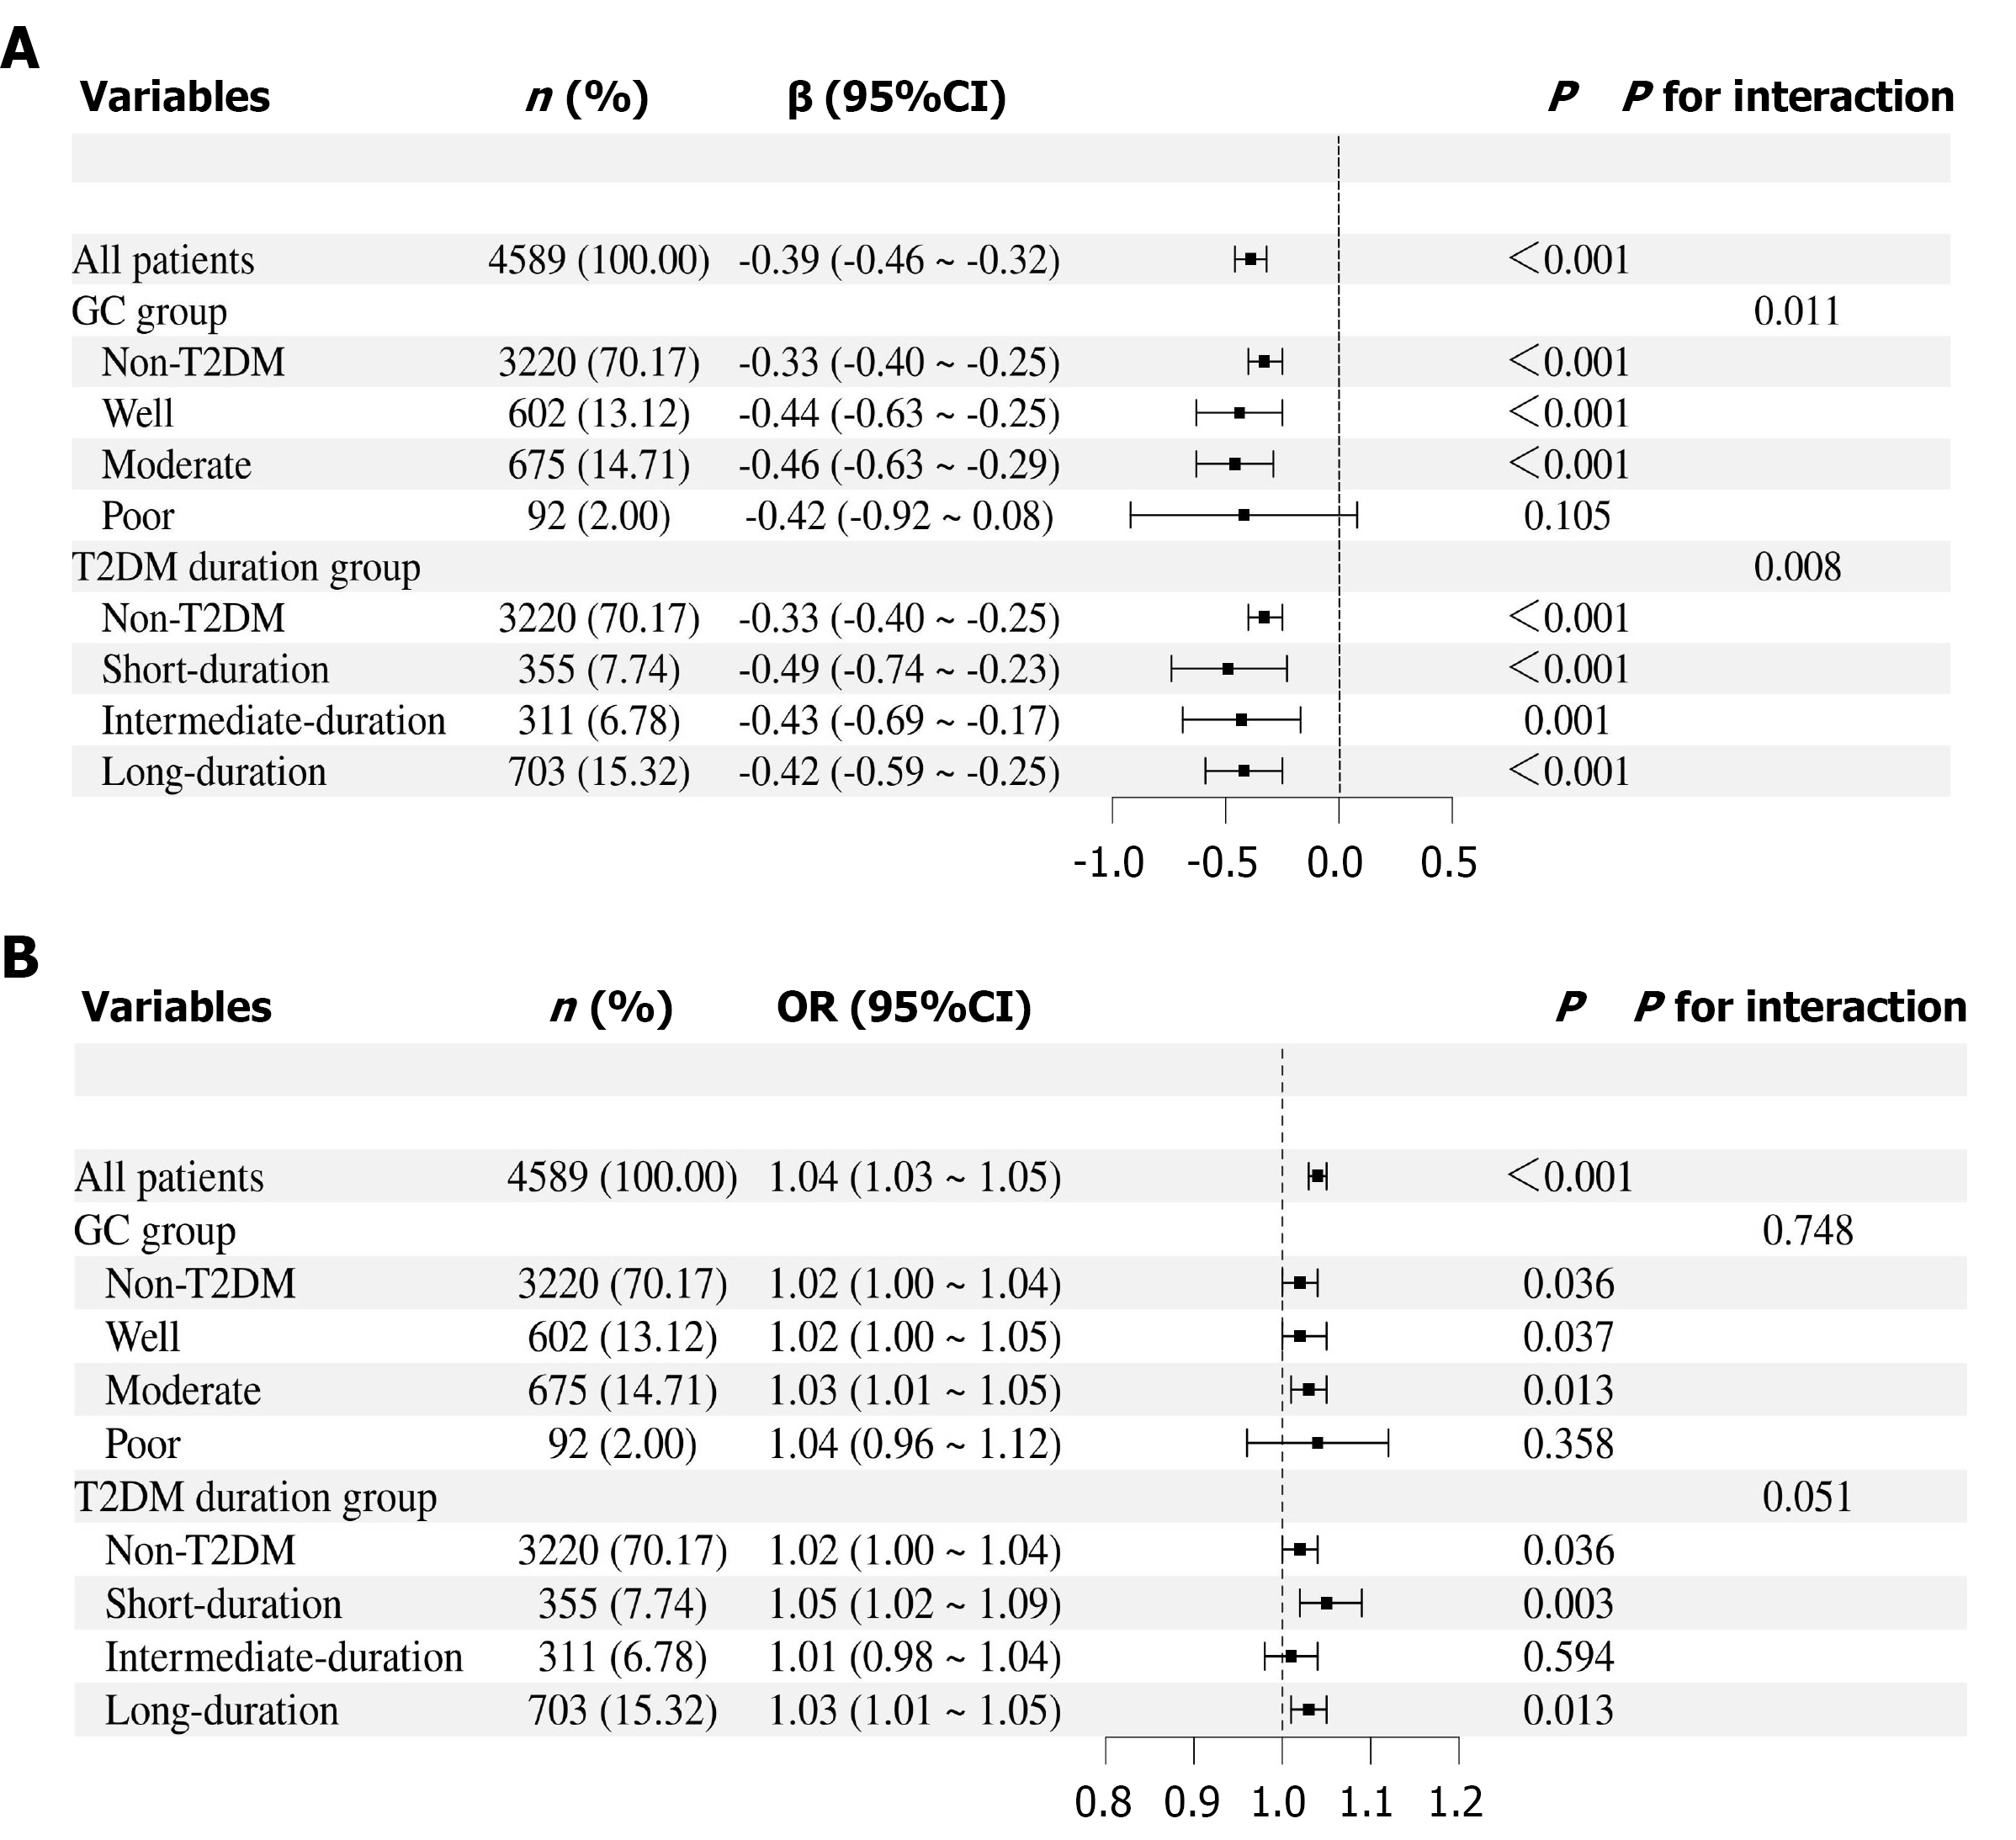
Figure 5 Forest plot.
A: Forest plot of subgroup analyses for the association of bone mineral density with epicardial adipose tissue density. Data are presented as β coefficients with 95%CI derived from linear regression models; B: Forest plot of subgroup analyses for the association of bone mineral density with severe coronary artery calcification. Data are presented as odds ratio with 95%CI derived from logistic regression models. P values indicate the statistical significance of the associations within each subgroup, while P for interaction assesses whether subgroup variables modify the association. GC: Glycemic control; OR: Odds ratio; T2DM: Type 2 diabetes mellitus.
- Citation: Liu YK, Wu FY, Jiang CP, Xia YX, Li Y, Zeng WW, Zhang SY, Fan DN, Zhang MX, Liu TC, Wu XP, Dong Y, Chen W, Zhao YH, Li T, Li Z, Xu XY. Artificial intelligence-based chest computed tomography assessment of bone, vascular, and epicardial adipose changes in type 2 diabetes. World J Diabetes 2026; 17(8): 121422
- URL: https://www.wjgnet.com/1948-9358/full/v17/i8/121422.htm
- DOI: https://dx.doi.org/10.4239/wjd.121422