
















Copyright: ©Author(s) 2026.
World J Diabetes. Aug 15, 2026; 17(8): 121326
Published online Aug 15, 2026. doi: 10.4239/wjd.121326
Published online Aug 15, 2026. doi: 10.4239/wjd.121326
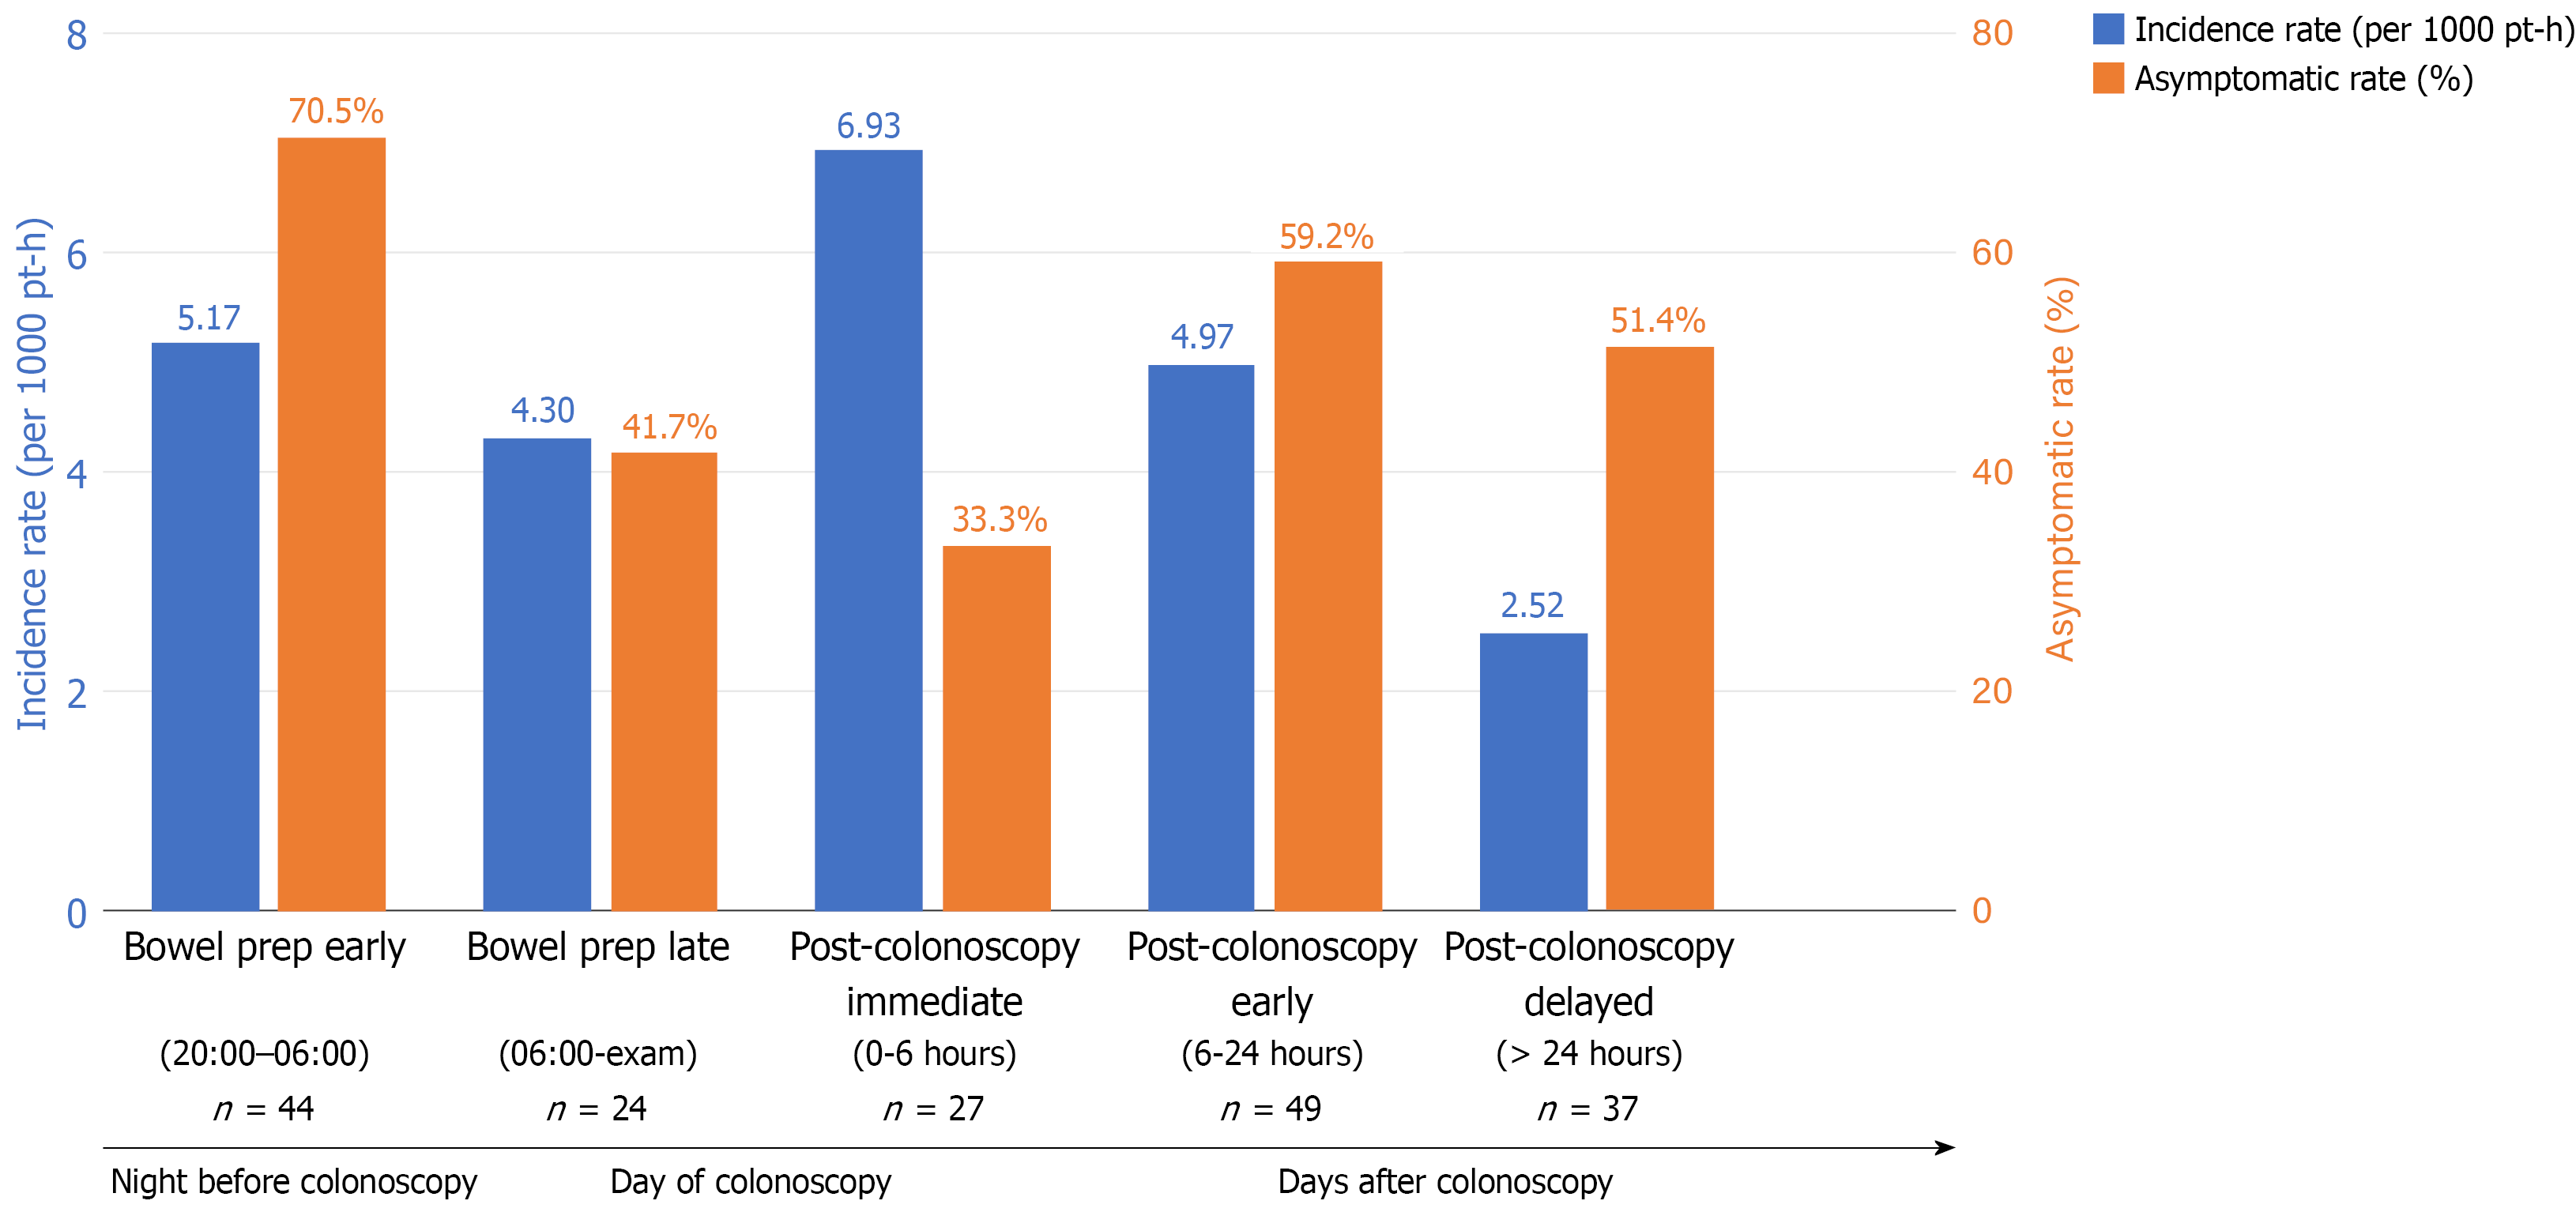
Figure 1 Temporal distribution of hypoglycaemic events and identification of dual high-risk windows during the peri-colonoscopy period.
Blue bars indicate incidence rates (left Y-axis); orange bars indicate asymptomatic proportions (right Y-axis). The two Y-axes represent different metrics and should not be interpreted as implying a direct quantitative relationship. Two high-risk windows are highlighted: (1) Early bowel preparation window (20:00-06:00) (highest asymptomatic proportion, 70.5%); and (2) Immediate post-colonoscopy (highest incidence rate, 6.93). pt-h: Patient-hours.
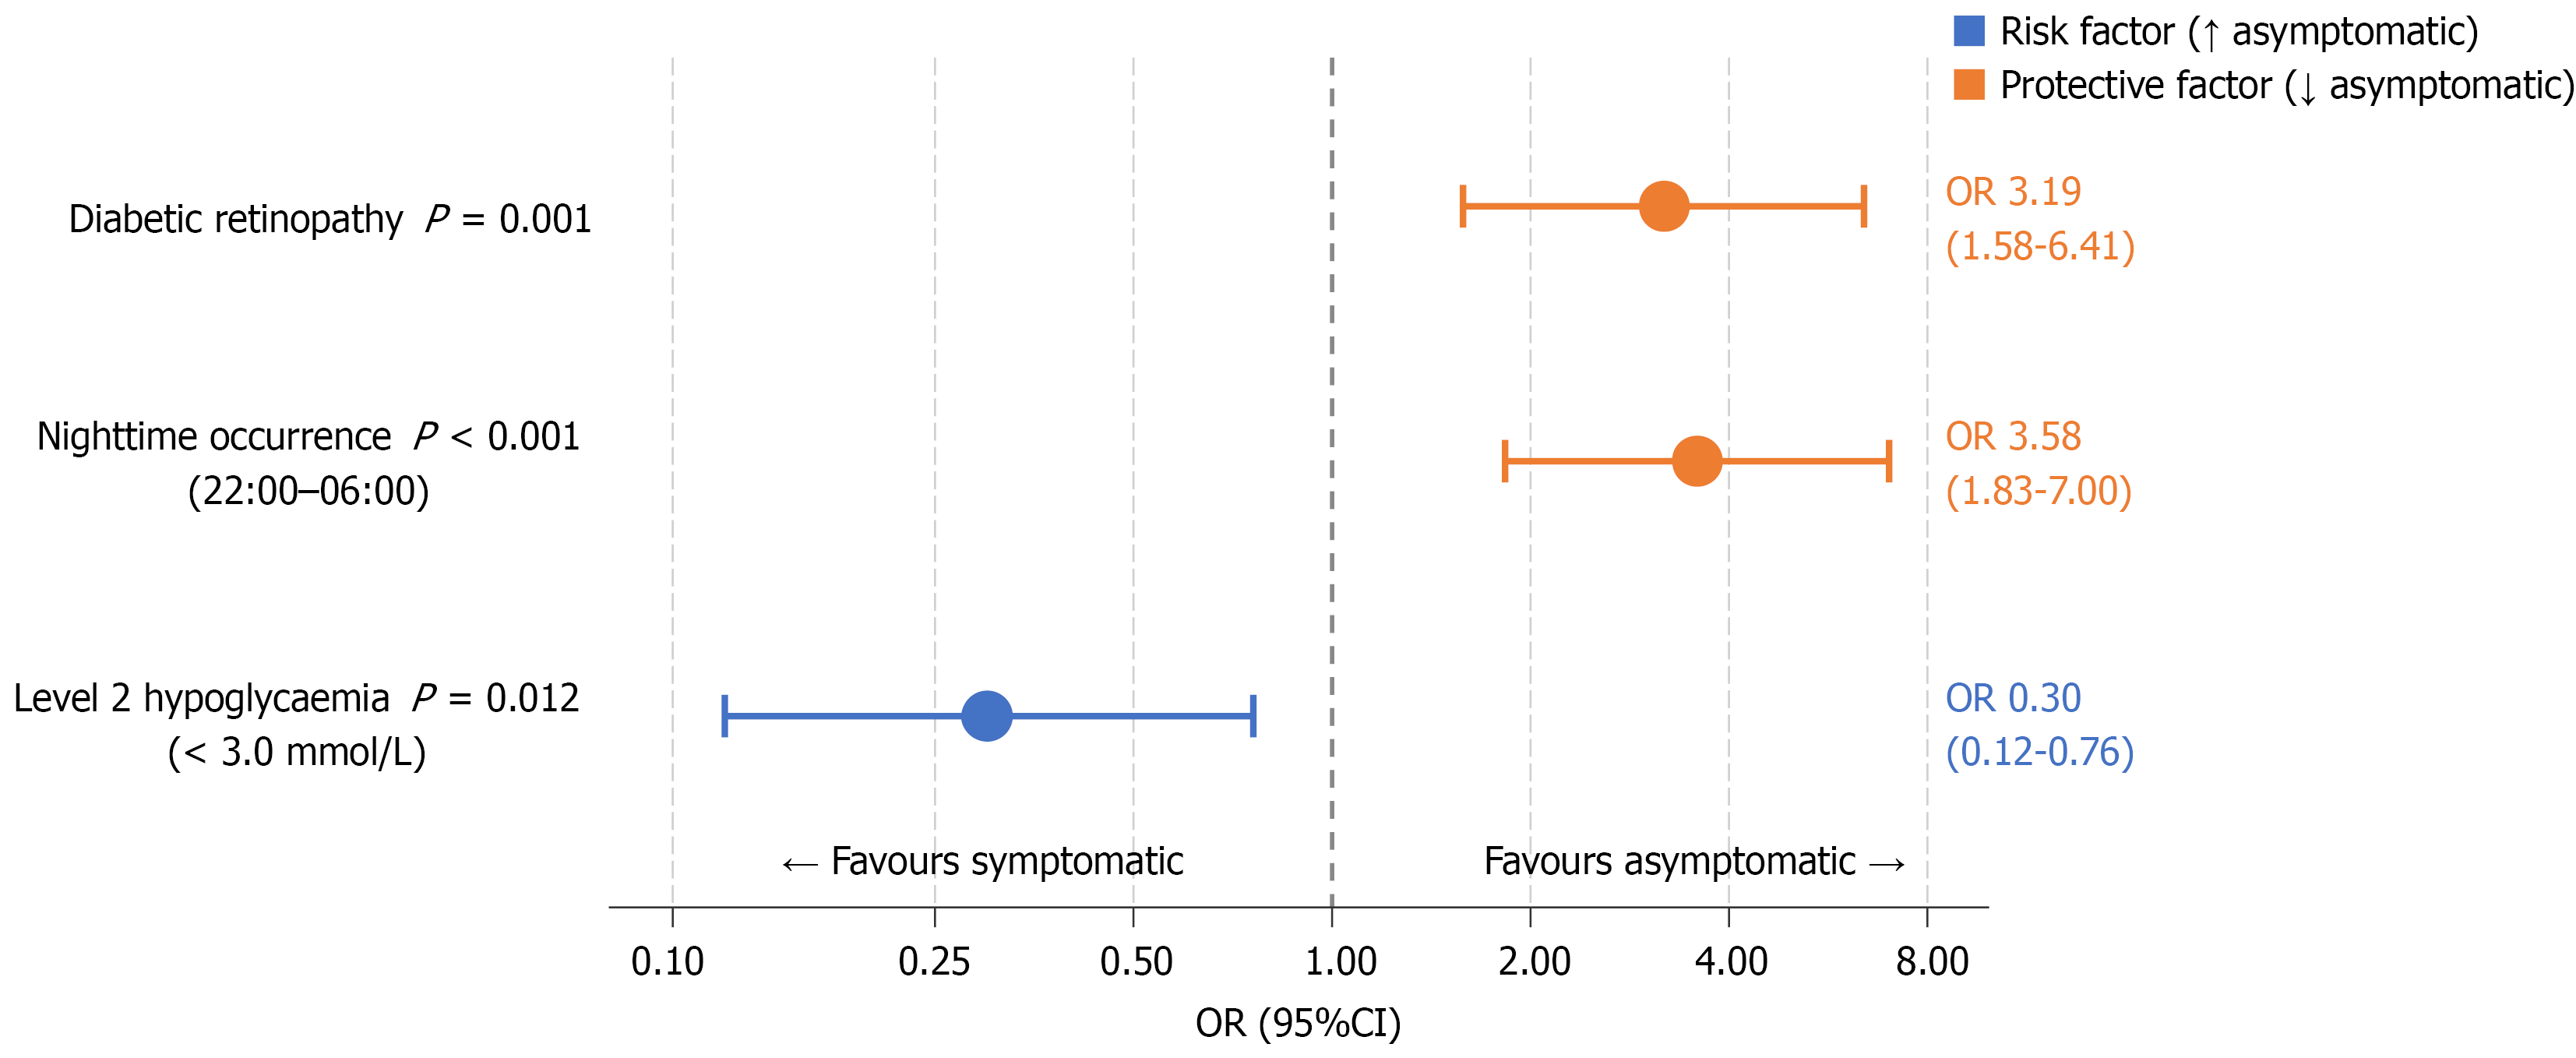
Figure 2 Forest plot of multivariable generalised estimating equations analysis for factors associated with asymptomatic hypoglycaemia.
Orange indicates risk factors (odds ratio > 1); blue indicates protective factors (odds ratio < 1). The model used an exchangeable working correlation structure. OR: Odds ratio.
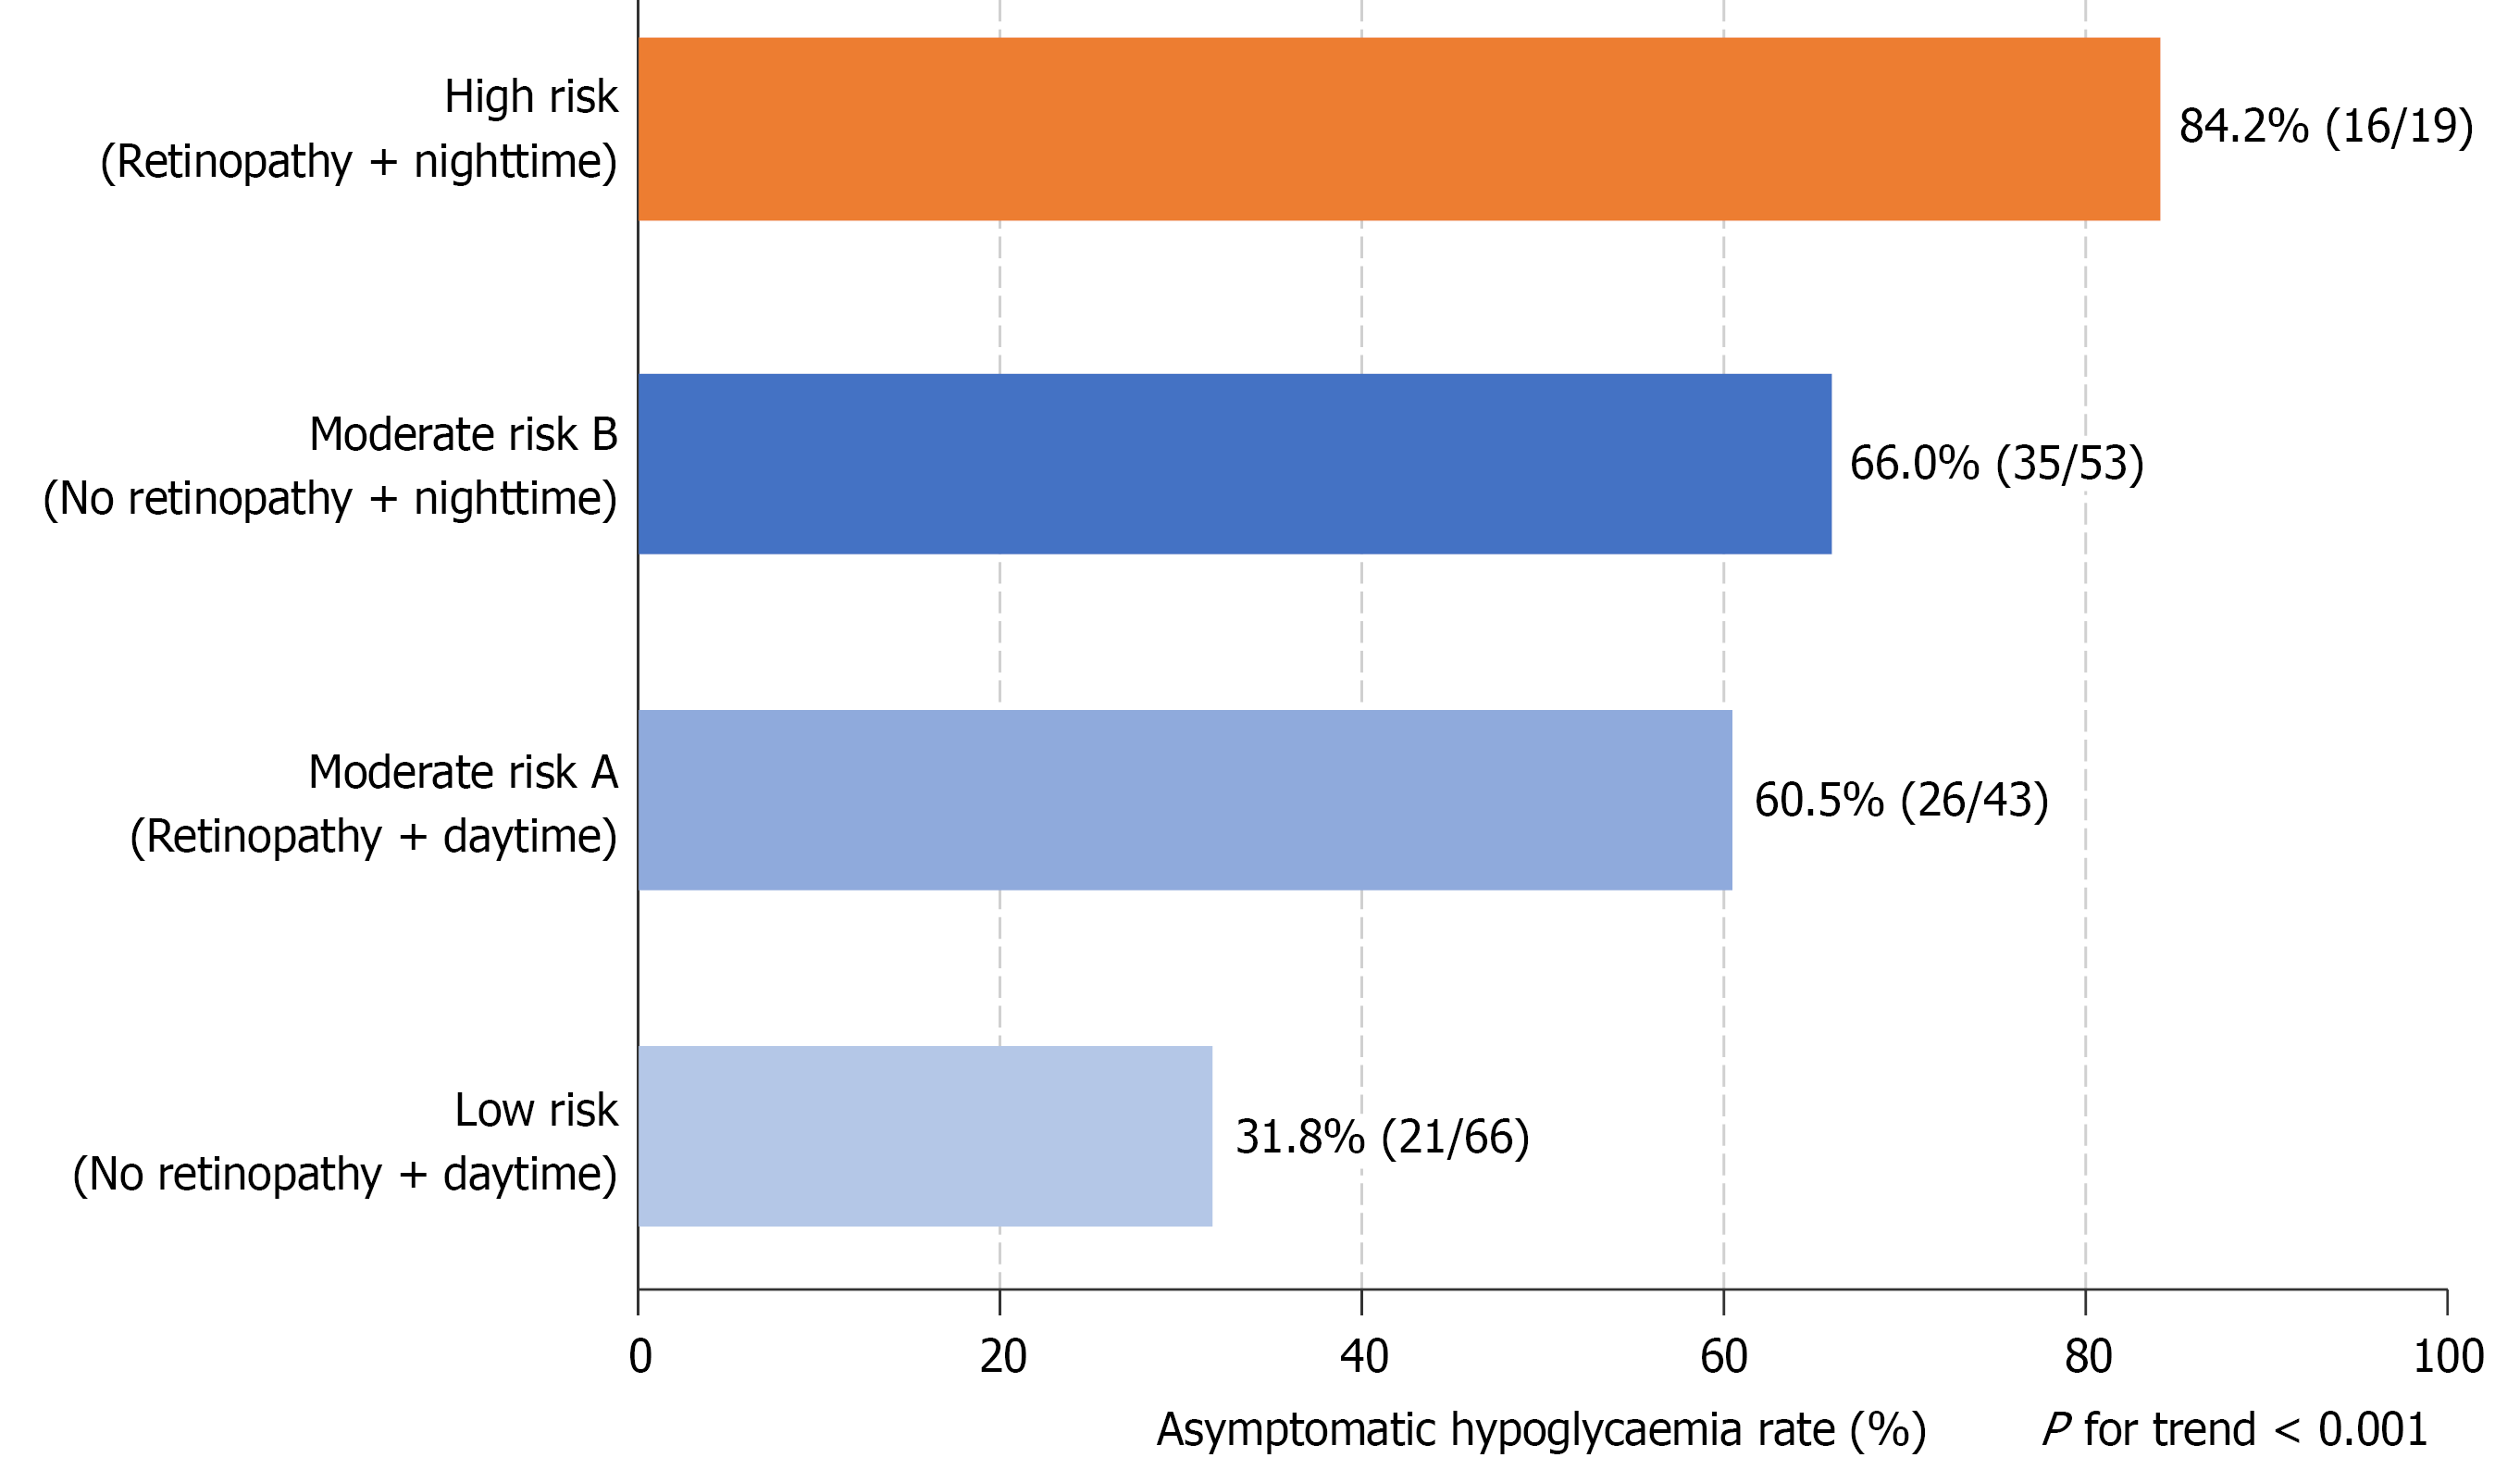
Figure 3 Exploratory risk stratification for asymptomatic hypoglycaemia based on retinopathy status and timing of occurrence.
Asym
- Citation: Yang HY, Zhang LL, Hu SQ, Yang QP, Liu DL. Peri-colonoscopy hypoglycaemia in type 2 diabetes: Temporal patterns and asymptomatic presentation. World J Diabetes 2026; 17(8): 121326
- URL: https://www.wjgnet.com/1948-9358/full/v17/i8/121326.htm
- DOI: https://dx.doi.org/10.4239/wjd.121326