
















Copyright: ©Author(s) 2026.
World J Diabetes. Aug 15, 2026; 17(8): 121173
Published online Aug 15, 2026. doi: 10.4239/wjd.121173
Published online Aug 15, 2026. doi: 10.4239/wjd.121173
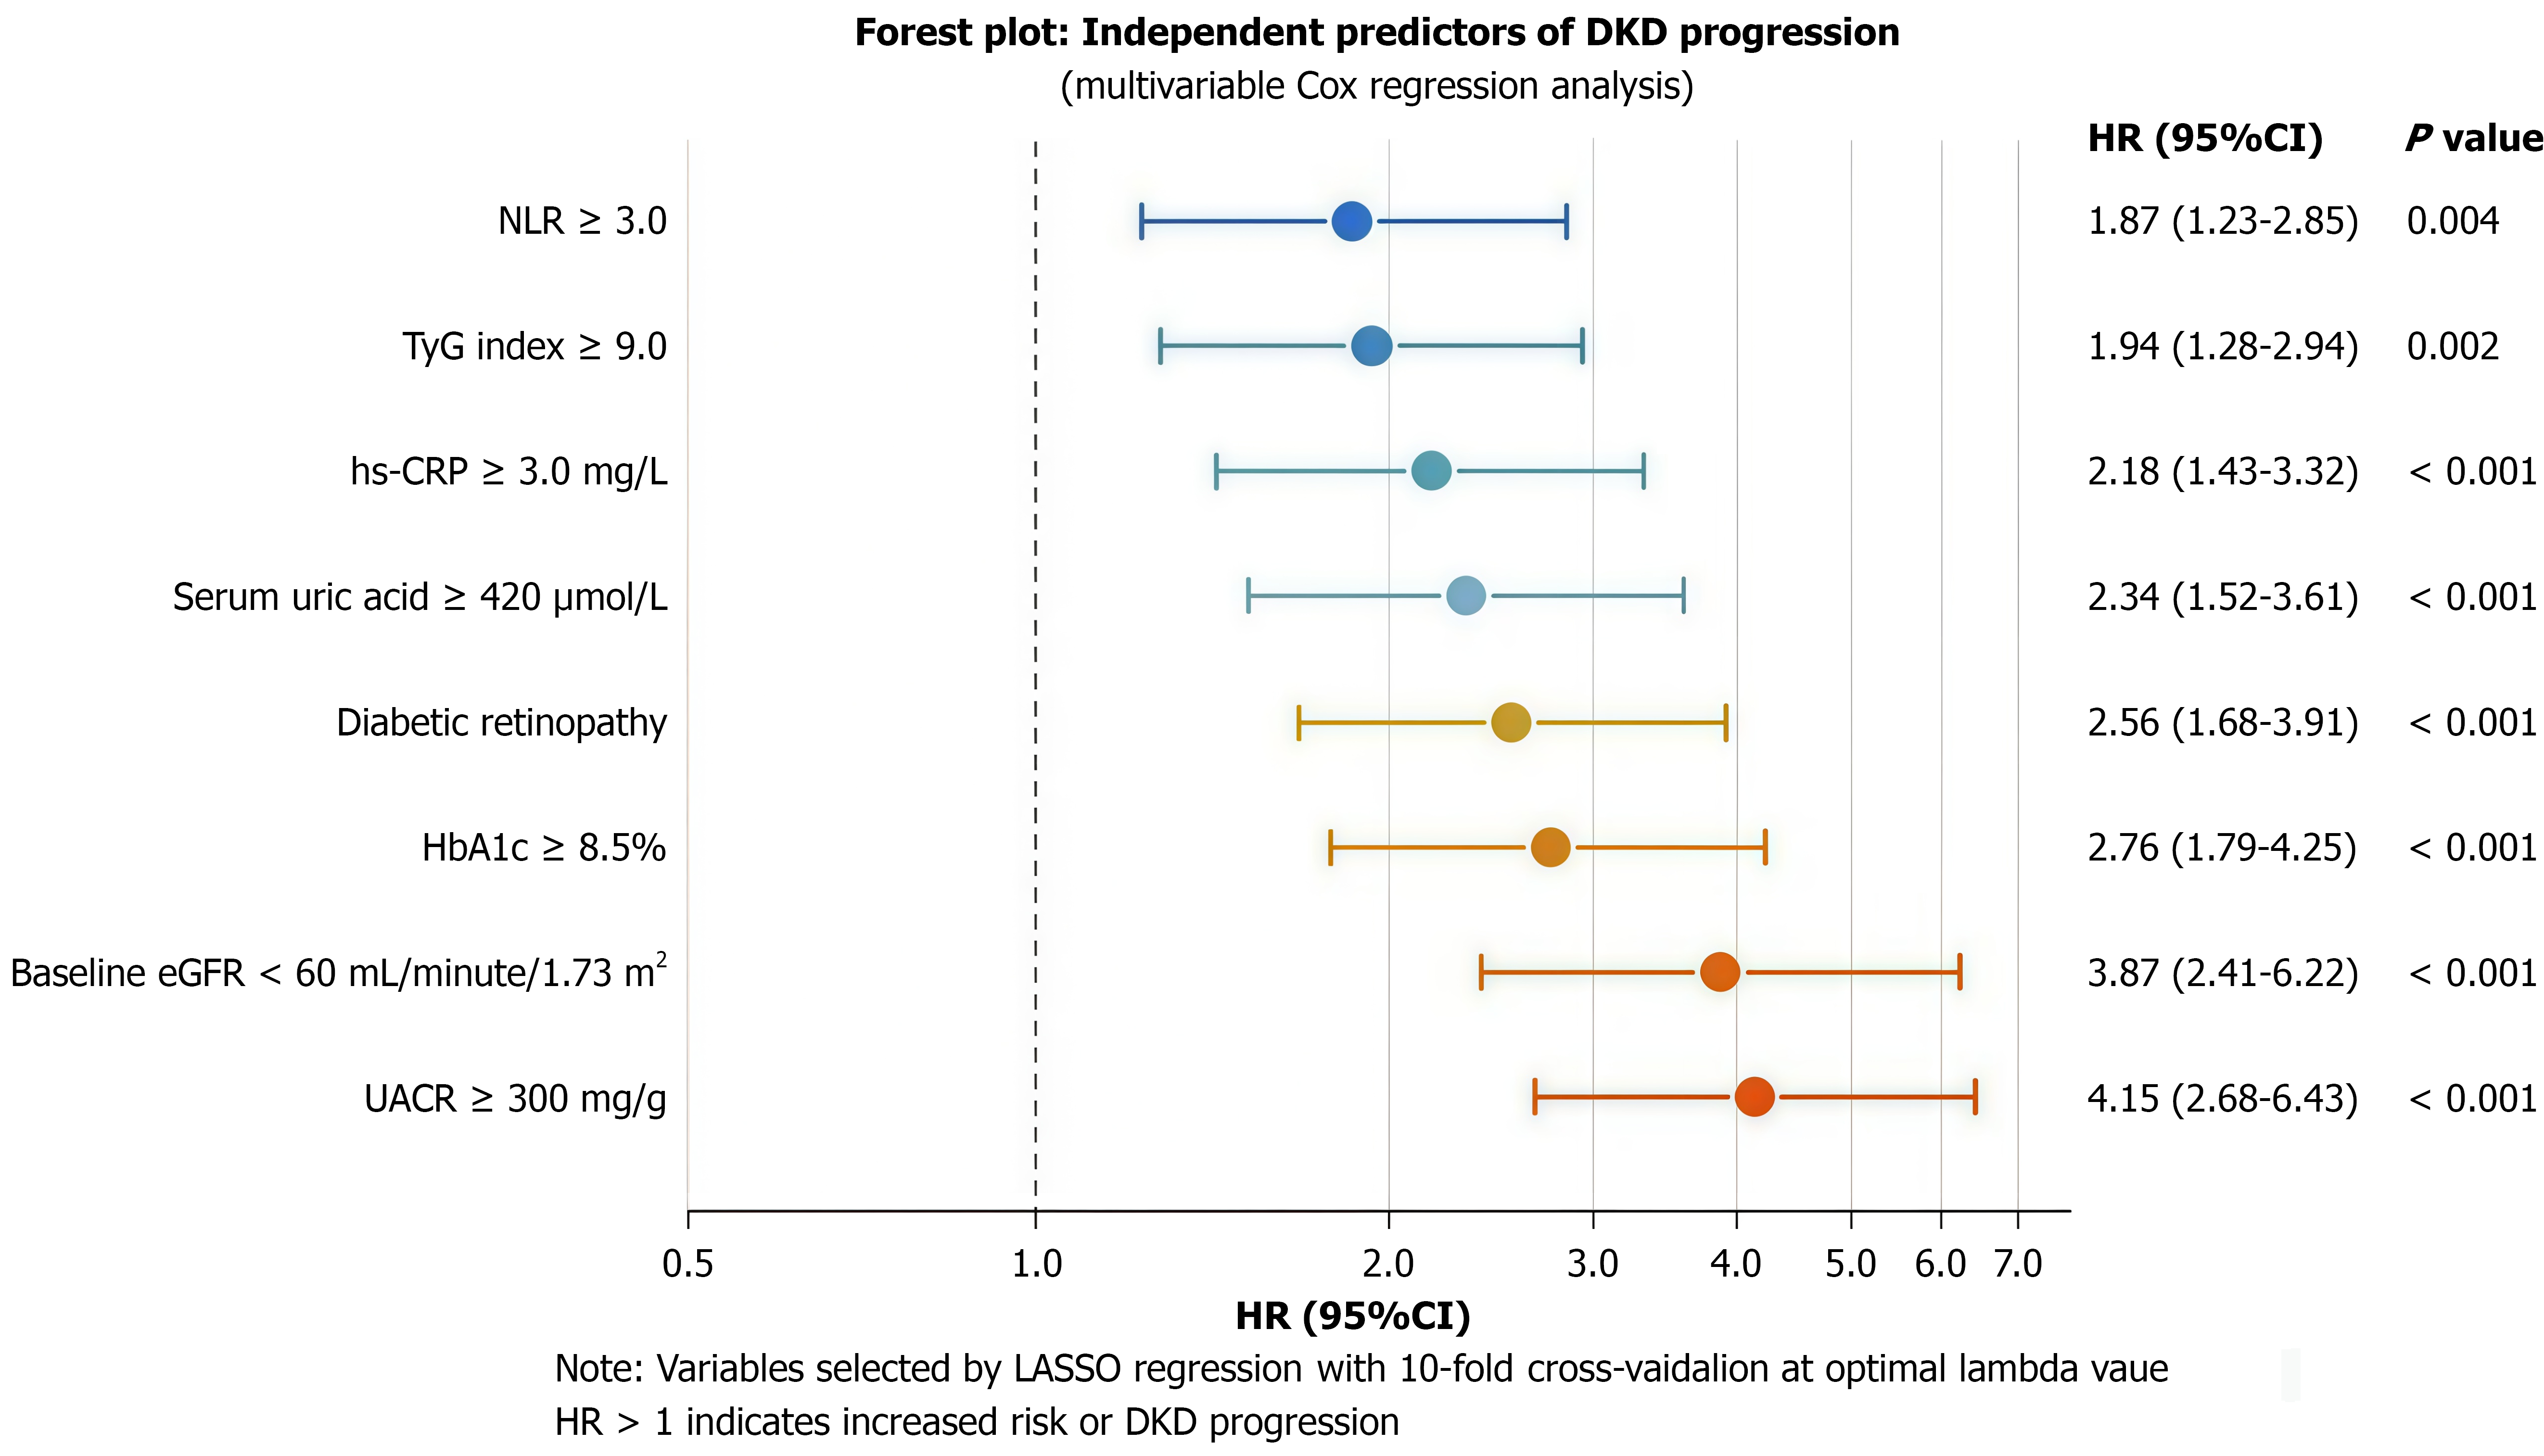
Figure 1 Forest plot of independent predictors for diabetic kidney disease progression.
Multivariable Cox regression analysis identified eight independent predictors with their corresponding hazard ratios (HRs) and 95%CI. The vertical dashed line represents the null effect (HR = 1.0). Variables are ordered by the magnitude of their HRs. DKD: Diabetic kidney disease; NLR: Neutrophil-to-lymphocyte ratio; TyG: Triglyceride-glucose; CRP: C-reactive protein; HbA1c: Hemoglobin A1c; eGFR: Estimated glomerular filtration rate; UACR: Urinary albumin-to-creatinine ratio; HR: Hazard ratio; LASSO: Least absolute shrinkage and selection operator.
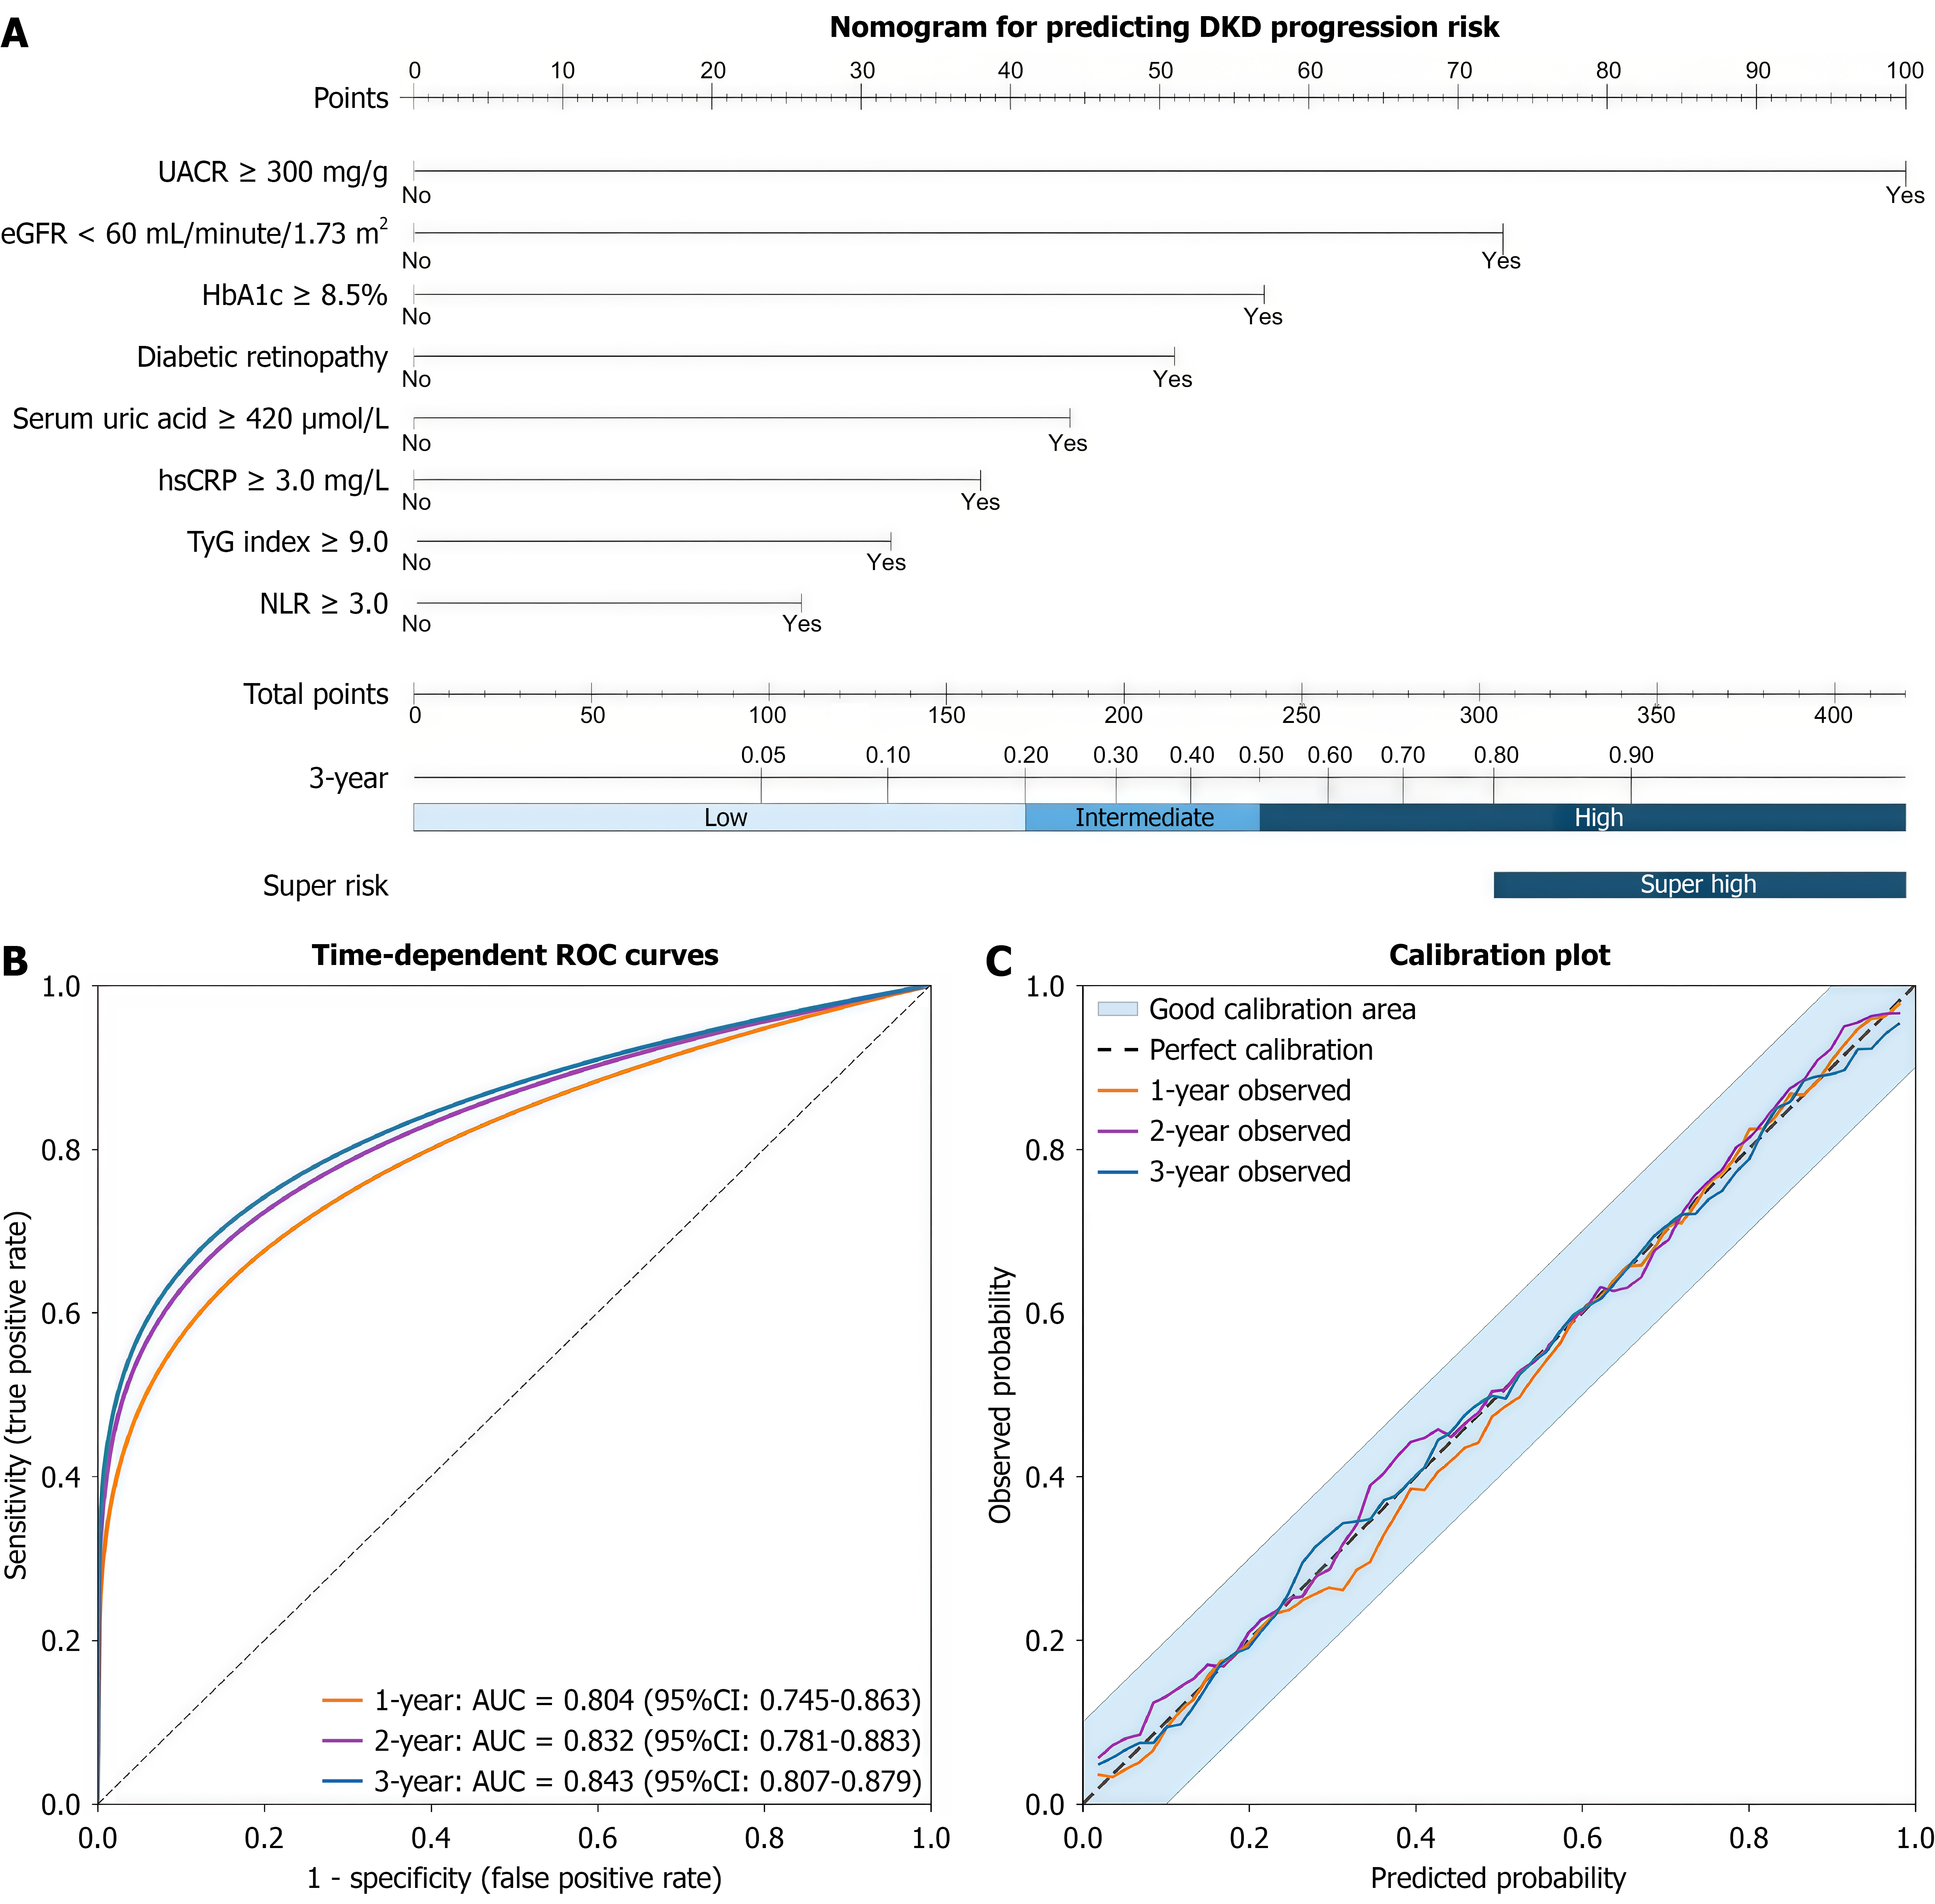
Figure 2 Nomogram and performance evaluation.
A: Nomogram for predicting 1-year, 2-year, and 3-year progression risk in diabetic kidney disease. To use the nomogram, locate each predictor value on the corresponding axis, draw a vertical line to the Points axis to determine points, sum all points, and locate the total on the total points axis. Draw a vertical line down to the risk axes to read the predicted progression probabilities; B: Time-dependent receiver operating characteristic curves showing excellent discrimination at 1 year, 2 years, and 3 years; C: Calibration curves demonstrating close agreement between predicted and observed probabilities. DKD: Diabetic kidney disease; NLR: Neutrophil-to-lymphocyte ratio; TyG: Triglyceride-glucose; CRP: C-reactive protein; HbA1c: Hemoglobin A1c; eGFR: Estimated glomerular filtration rate; UACR: Urinary albumin-to-creatinine ratio; ROC: Receiver operating characteristic; AUC: Area under the curve.
- Citation: Du N, Li WX, Qiu CY, Wang J. Risk stratification model for diabetic kidney disease progression based on metabolic and inflammatory biomarkers. World J Diabetes 2026; 17(8): 121173
- URL: https://www.wjgnet.com/1948-9358/full/v17/i8/121173.htm
- DOI: https://dx.doi.org/10.4239/wjd.121173