
















Copyright: ©Author(s) 2026.
World J Diabetes. Aug 15, 2026; 17(8): 113938
Published online Aug 15, 2026. doi: 10.4239/wjd.113938
Published online Aug 15, 2026. doi: 10.4239/wjd.113938
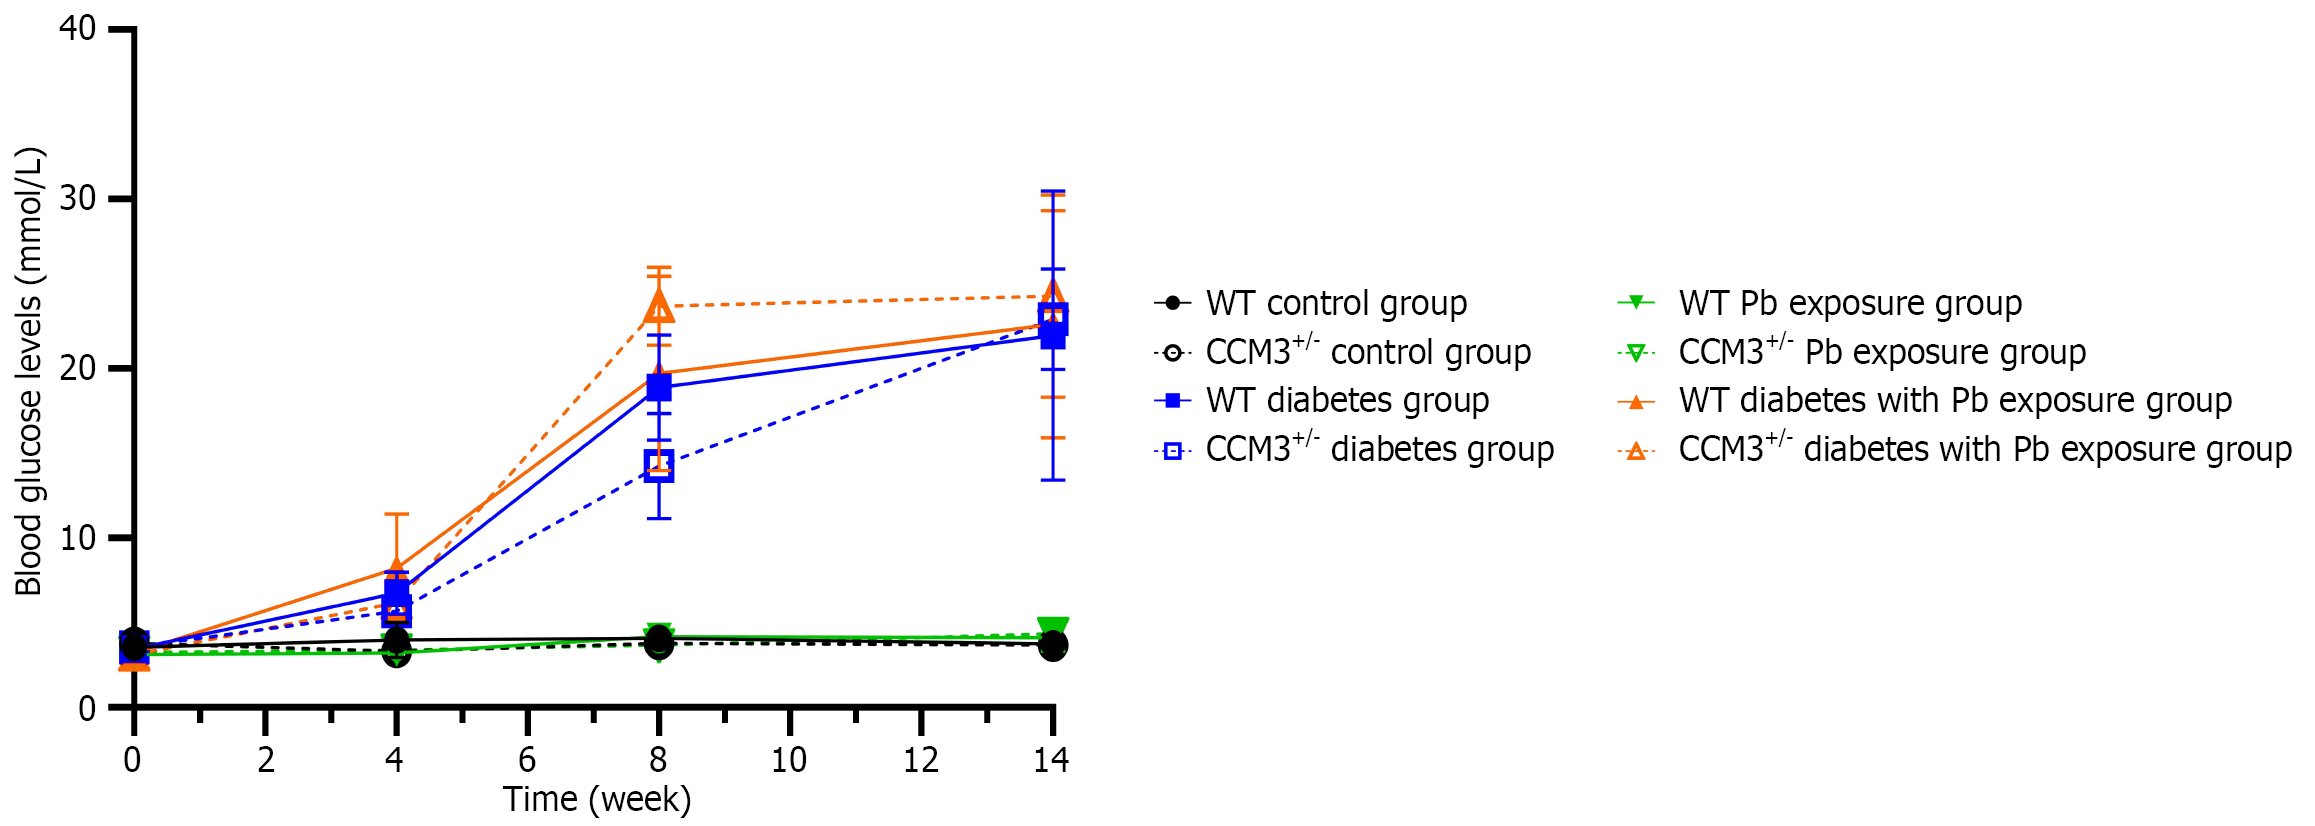
Figure 1 The blood glucose levels of mice in each group at four time points.
WT: Wild-type.
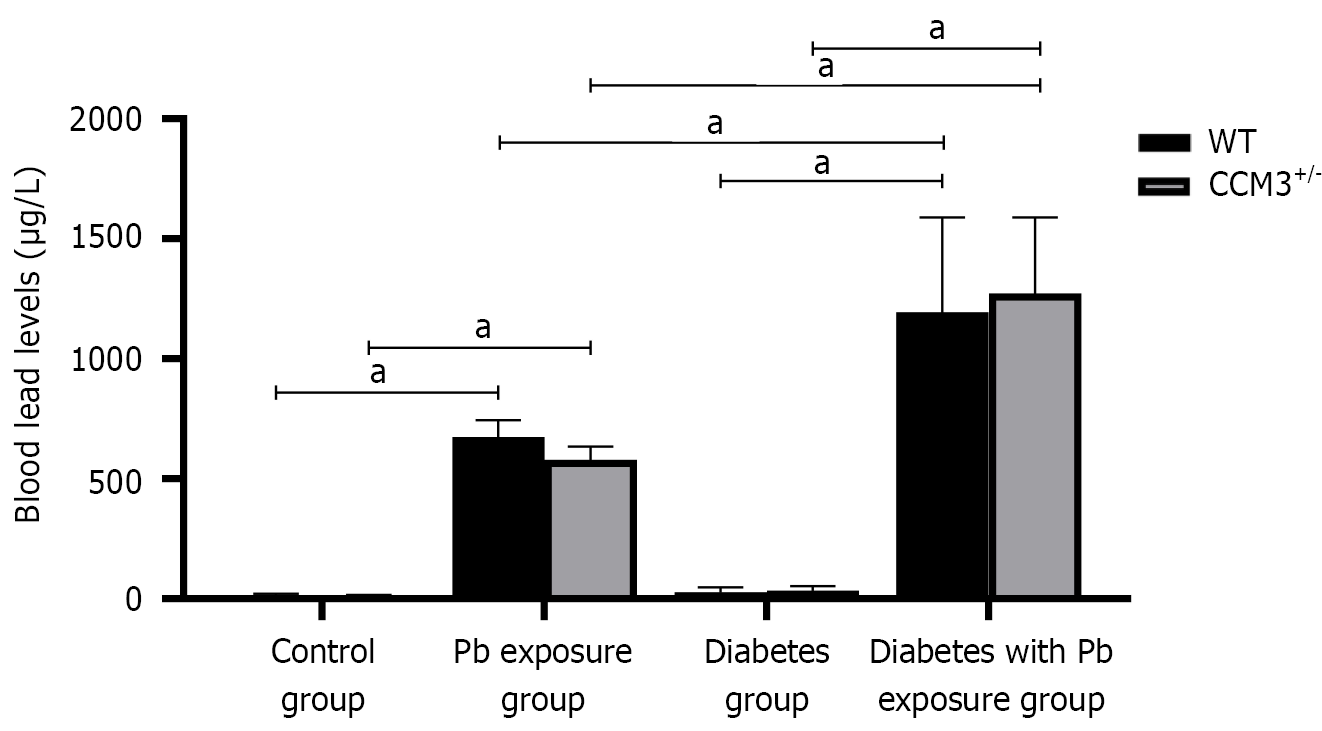
Figure 2 The blood lead levels of mice in each group.
aP < 0.05. WT: Wild-type.
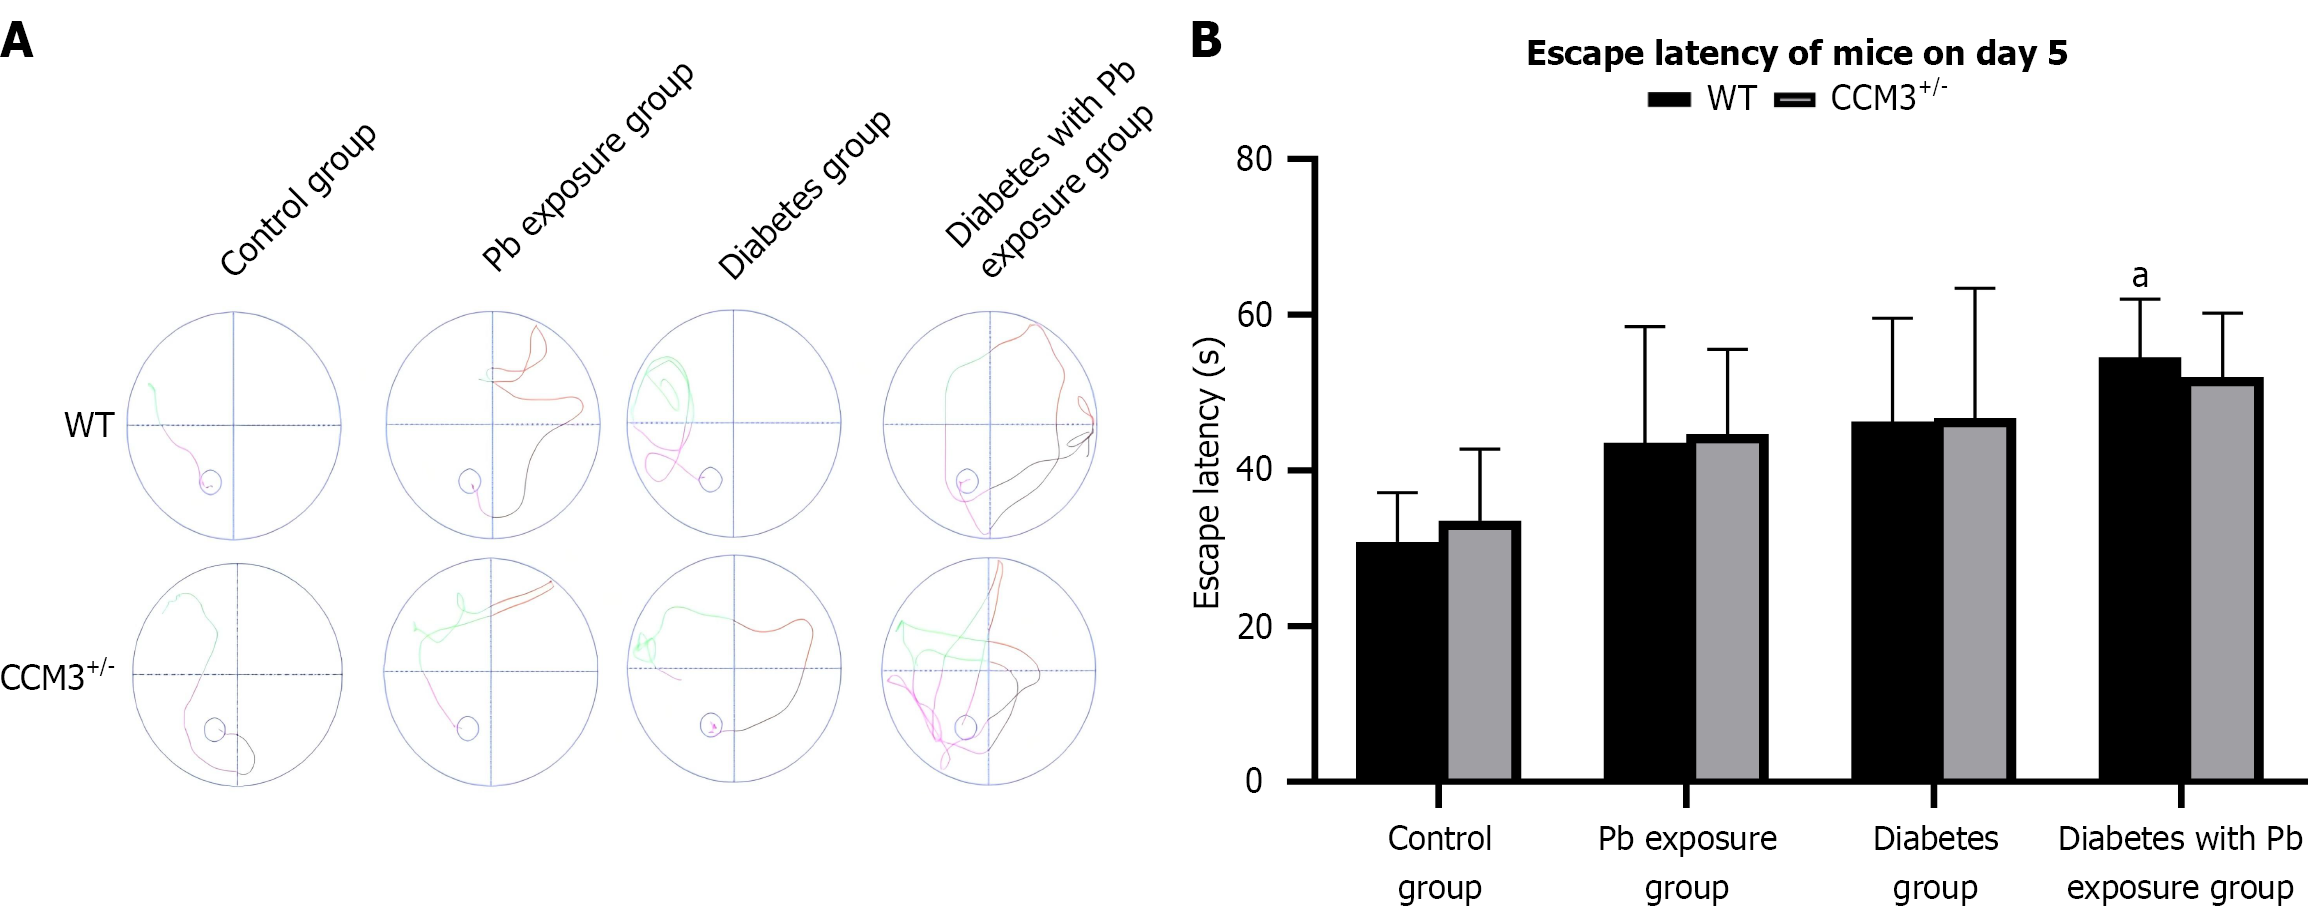
Figure 3 Results of water maze experiment on mice in each group.
A: Representative diagram of swimming trajectory of mice on day 5; B: Escape latency of mice on day 5. aP < 0.05 vs wild-type control group. WT: Wild-type.
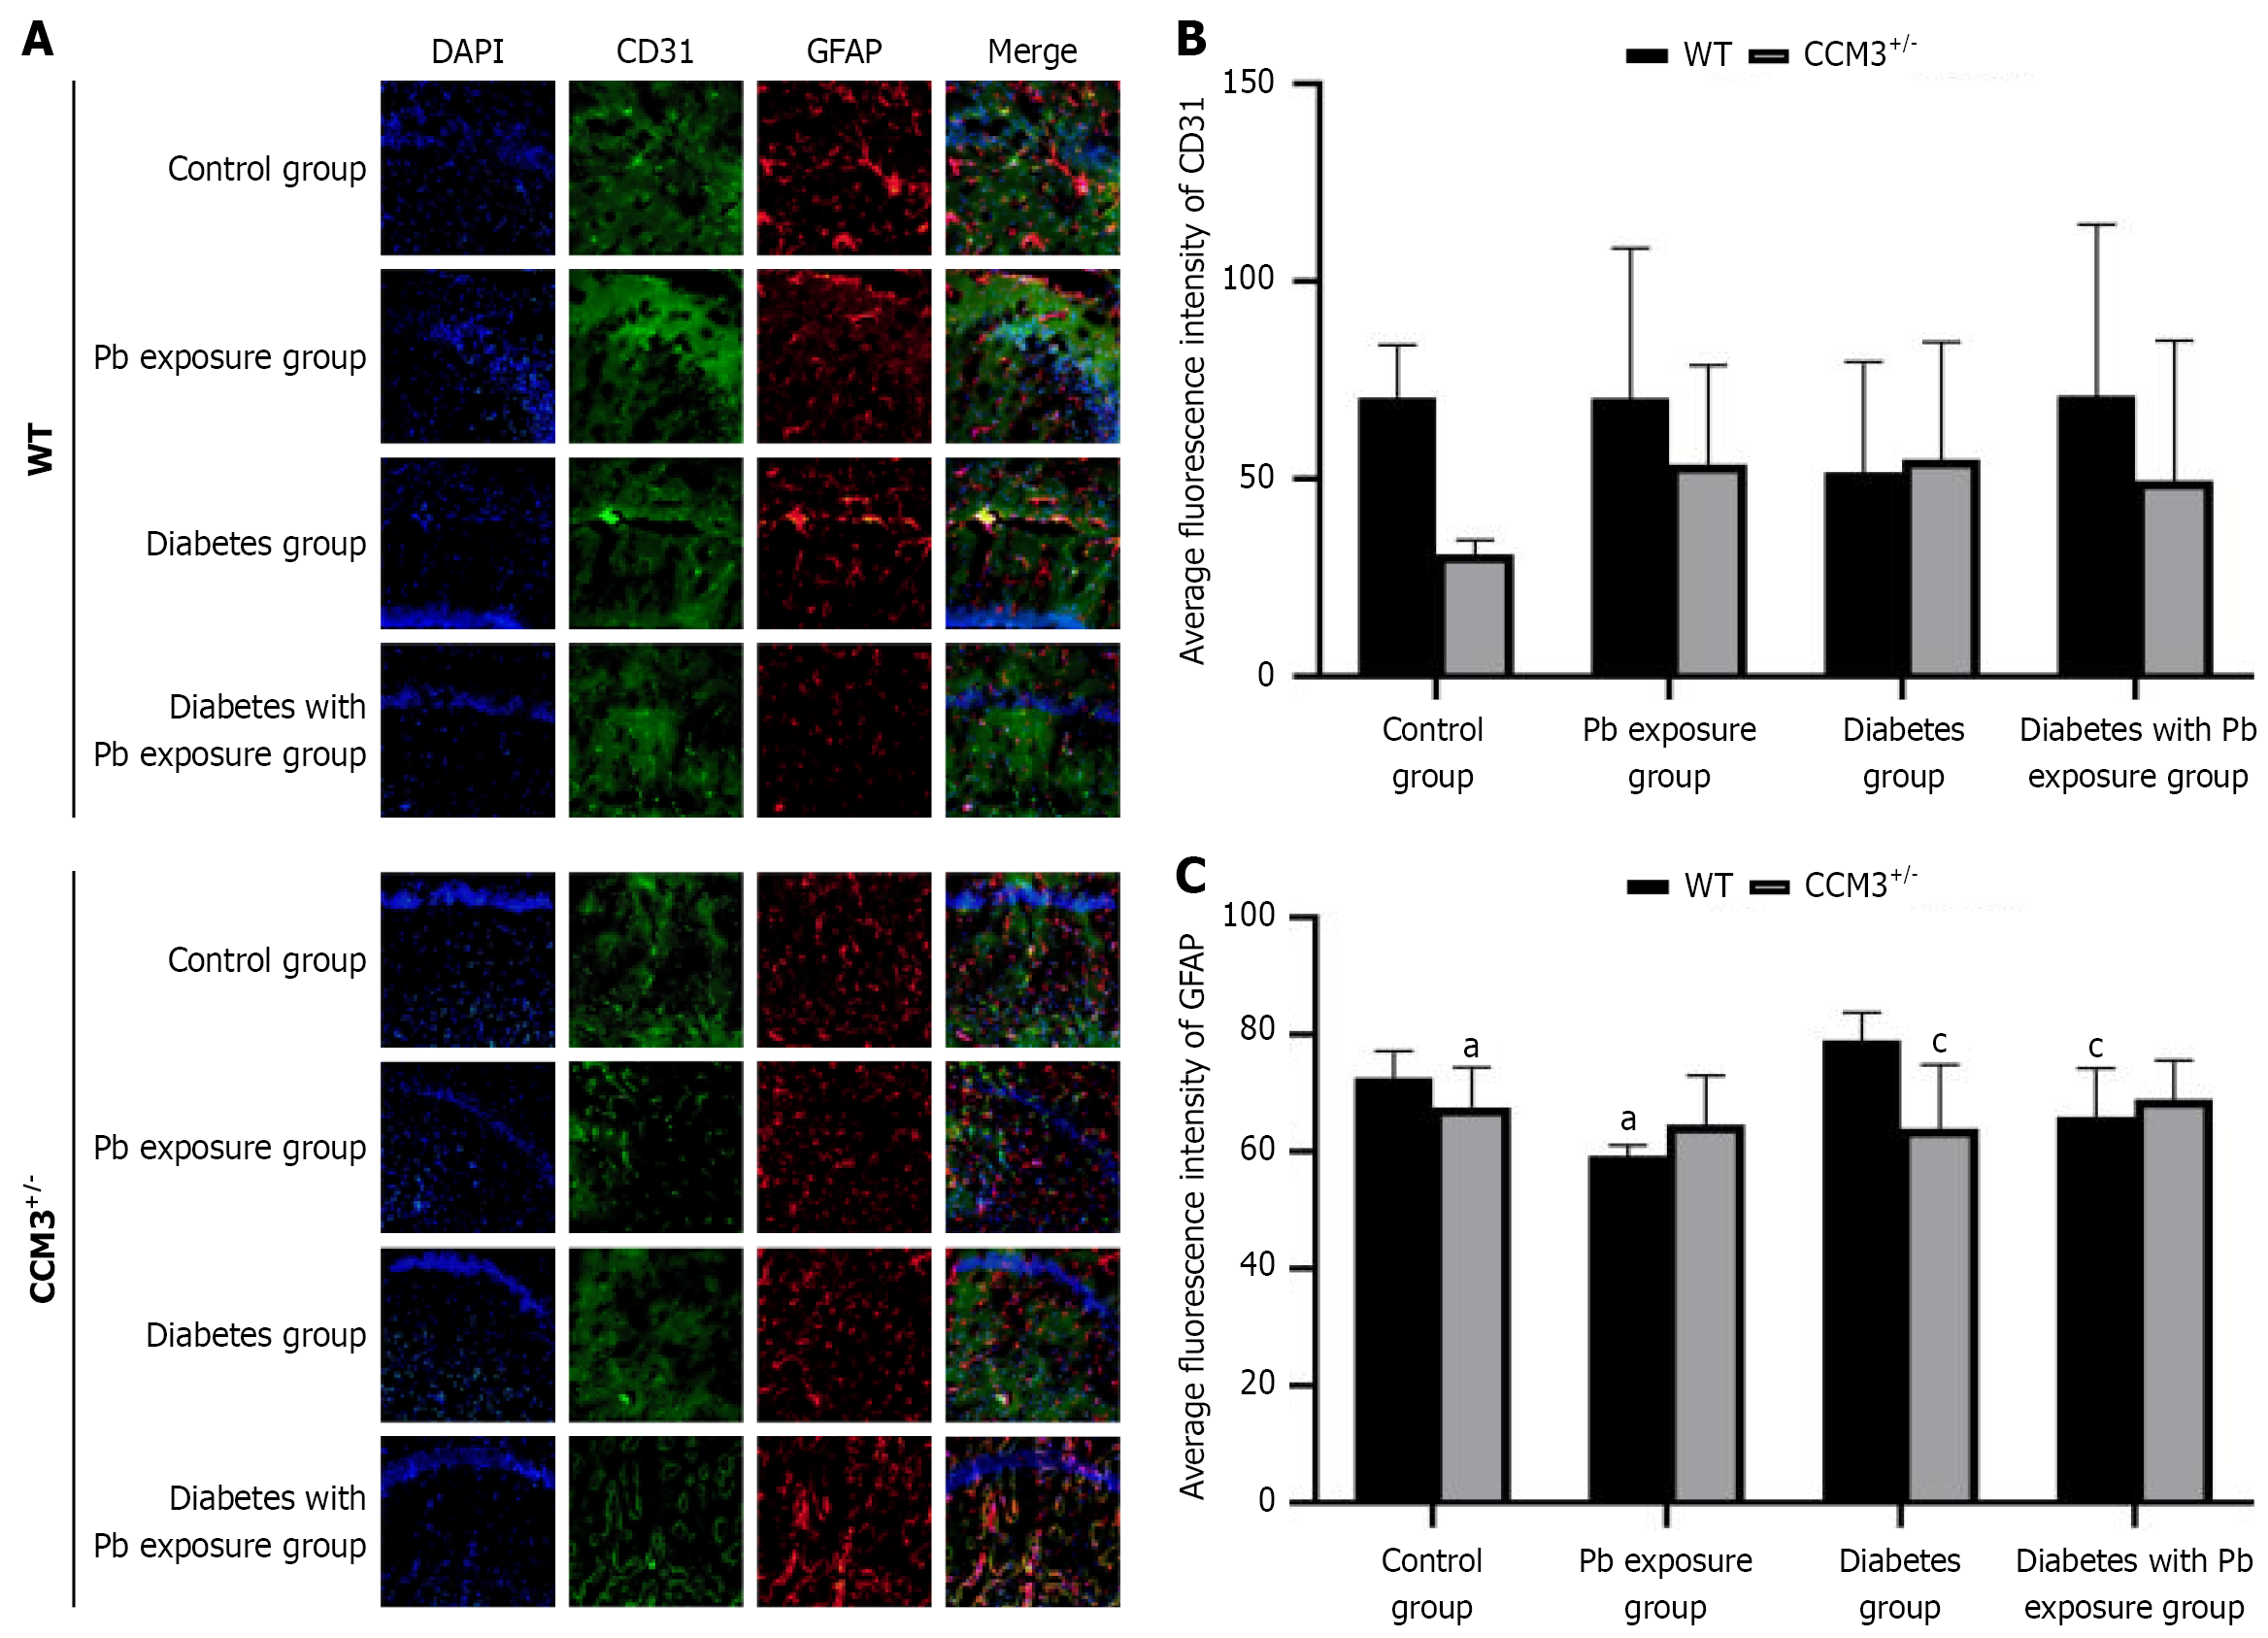
Figure 4 Fluorescence co-localization results of CD31 and glial fibrillary acidic protein in the hippocampus of mice in each group.
A: Expression of CD31 and glial fibrillary acidic protein (GFAP) in the hippocampus of mice in each group, B: Average fluorescence intensity of CD31, C: Average fluorescence intensity of GFAP. aP < 0.05 vs wild-type control group, cP < 0.05 vs wild-type diabetes group. WT: Wild-type.
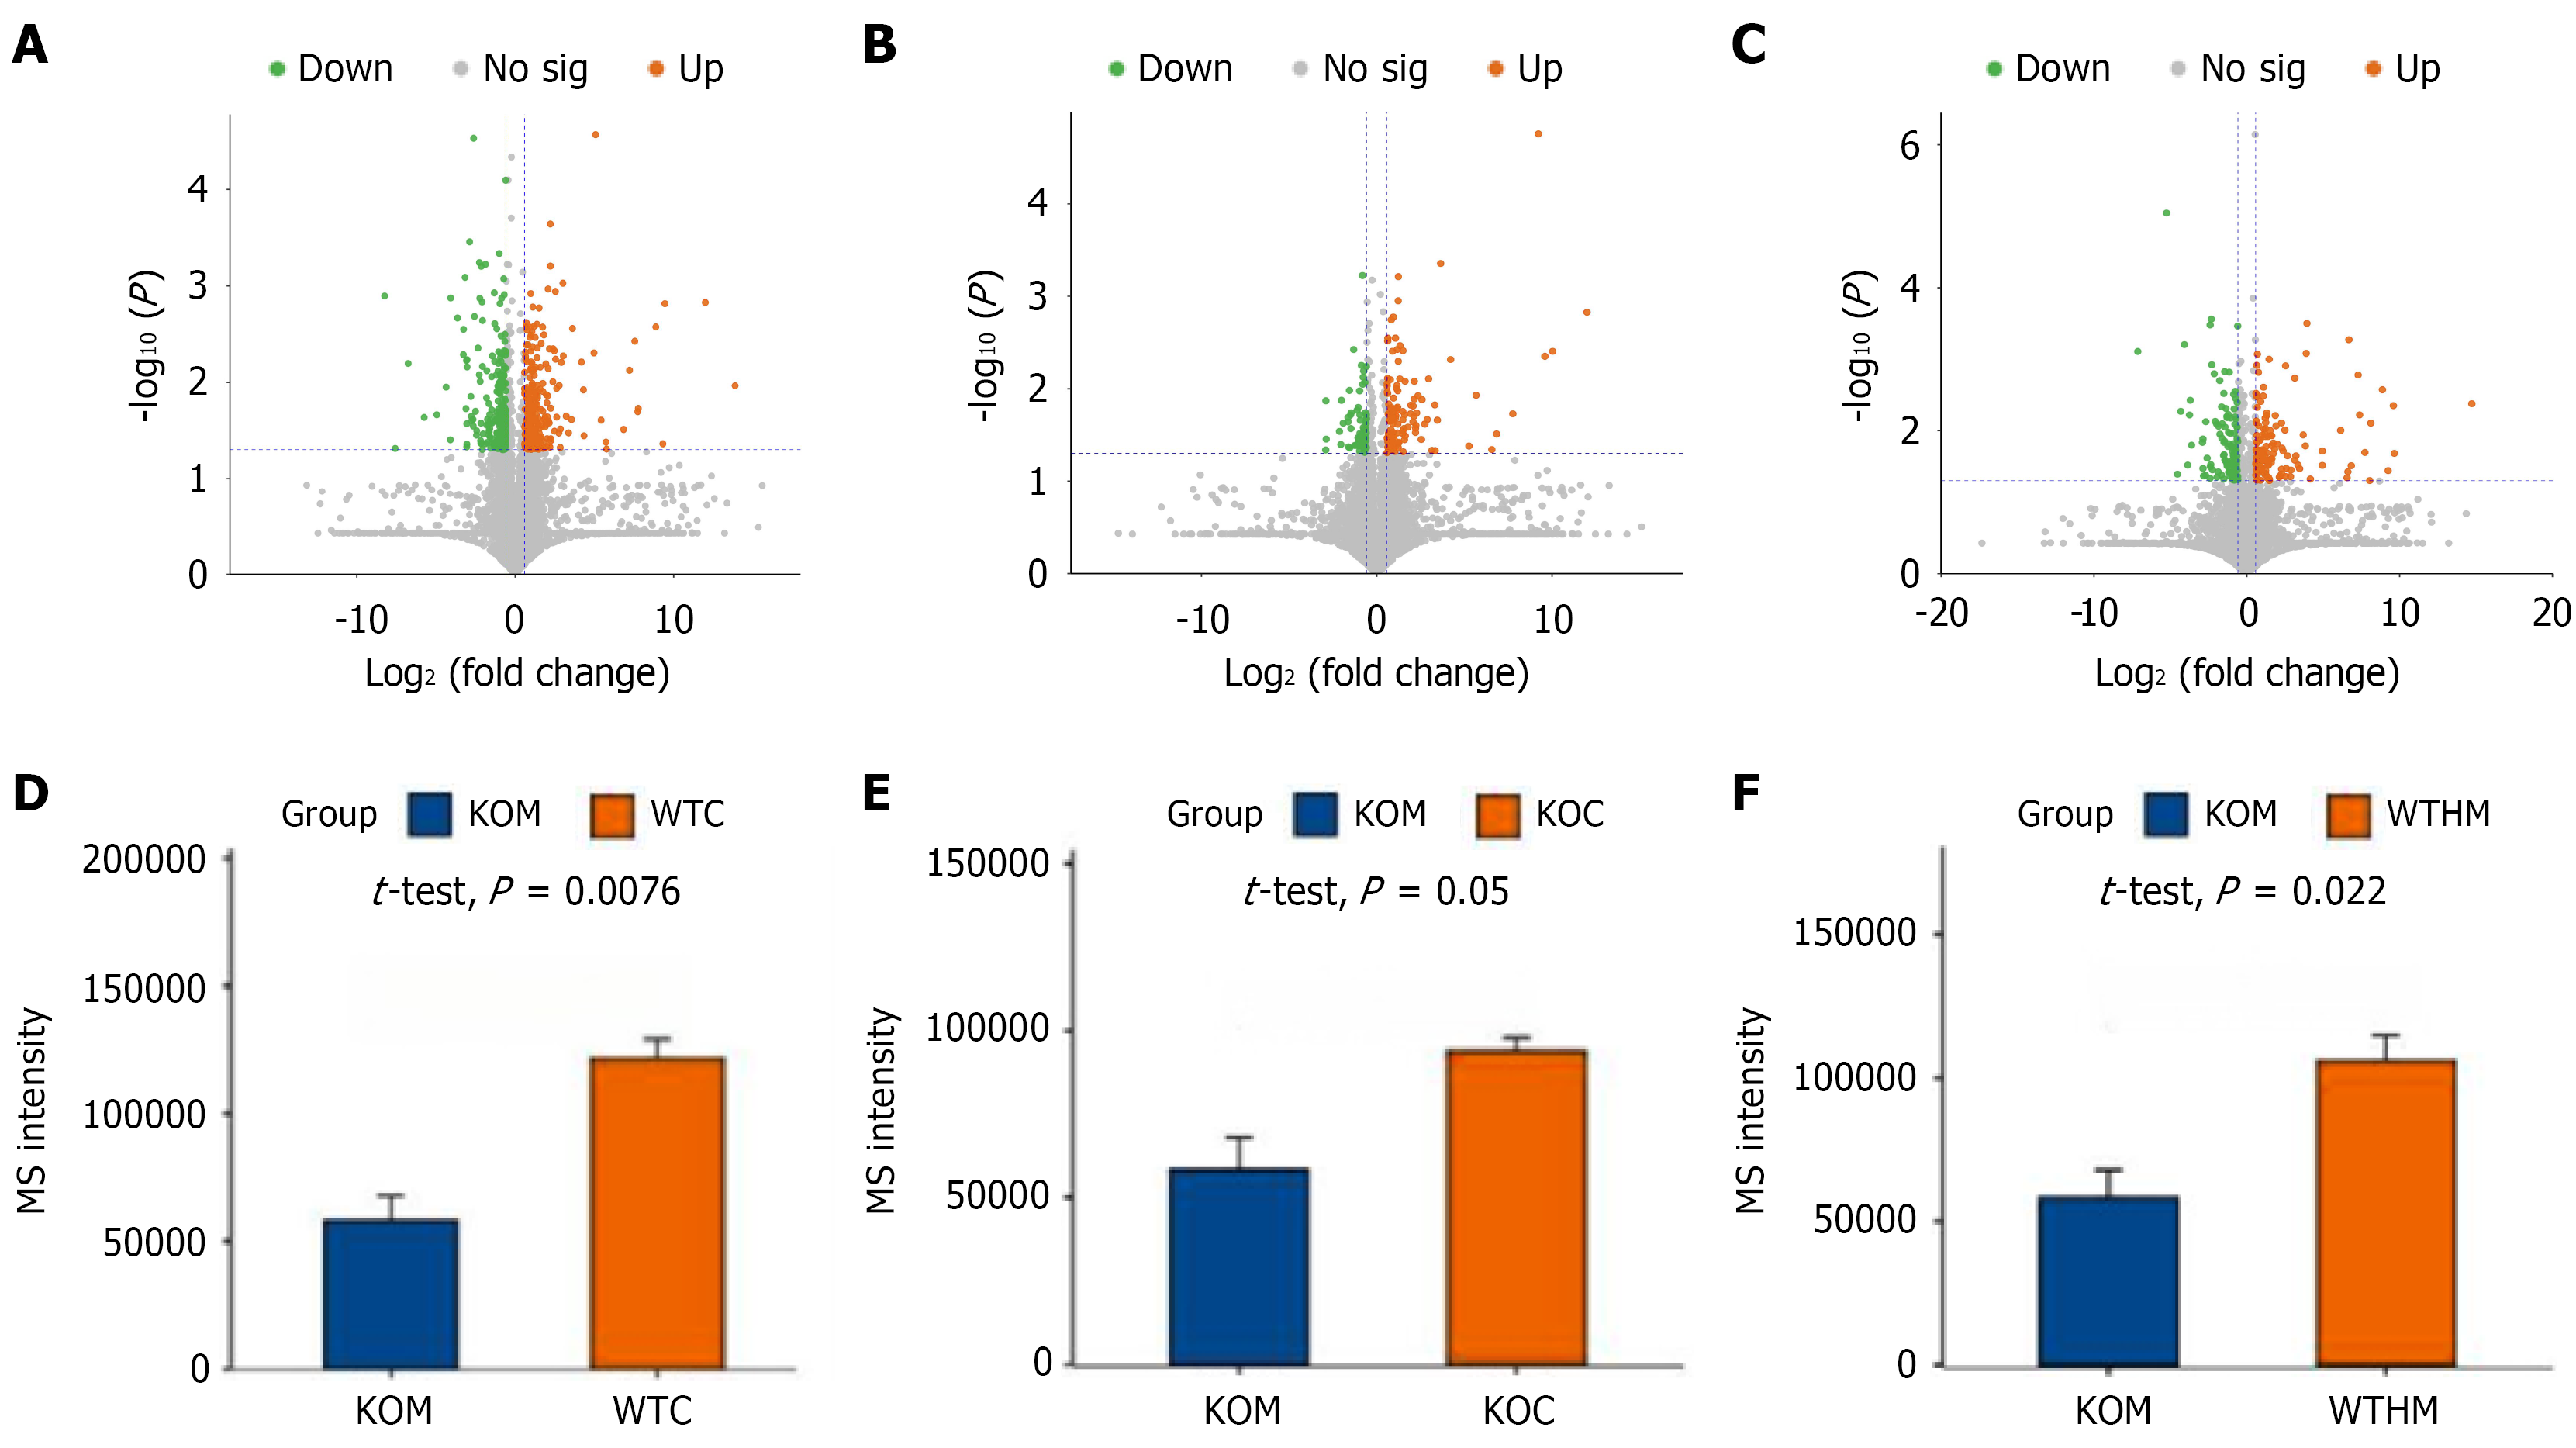
Figure 5 Differential protein volcano and AKT protein abundance difference.
A: Differential protein volcano between wild-type (WT) control group and CCM3+/- diabetes group; B: Differential protein volcano between CCM3+/- control group and CCM3+/- diabetes group; C: Differential protein volcano between WT diabetes lead exposed group and CCM3+/- diabetes group; D: AKT protein abundance difference between WT control group and CCM3+/- diabetes group; E: AKT protein abundance difference between CCM3+/- control group and CCM3+/- diabetes group; F: AKT protein abundance difference between WT diabetes lead exposed group and CCM3+/- diabetes group.
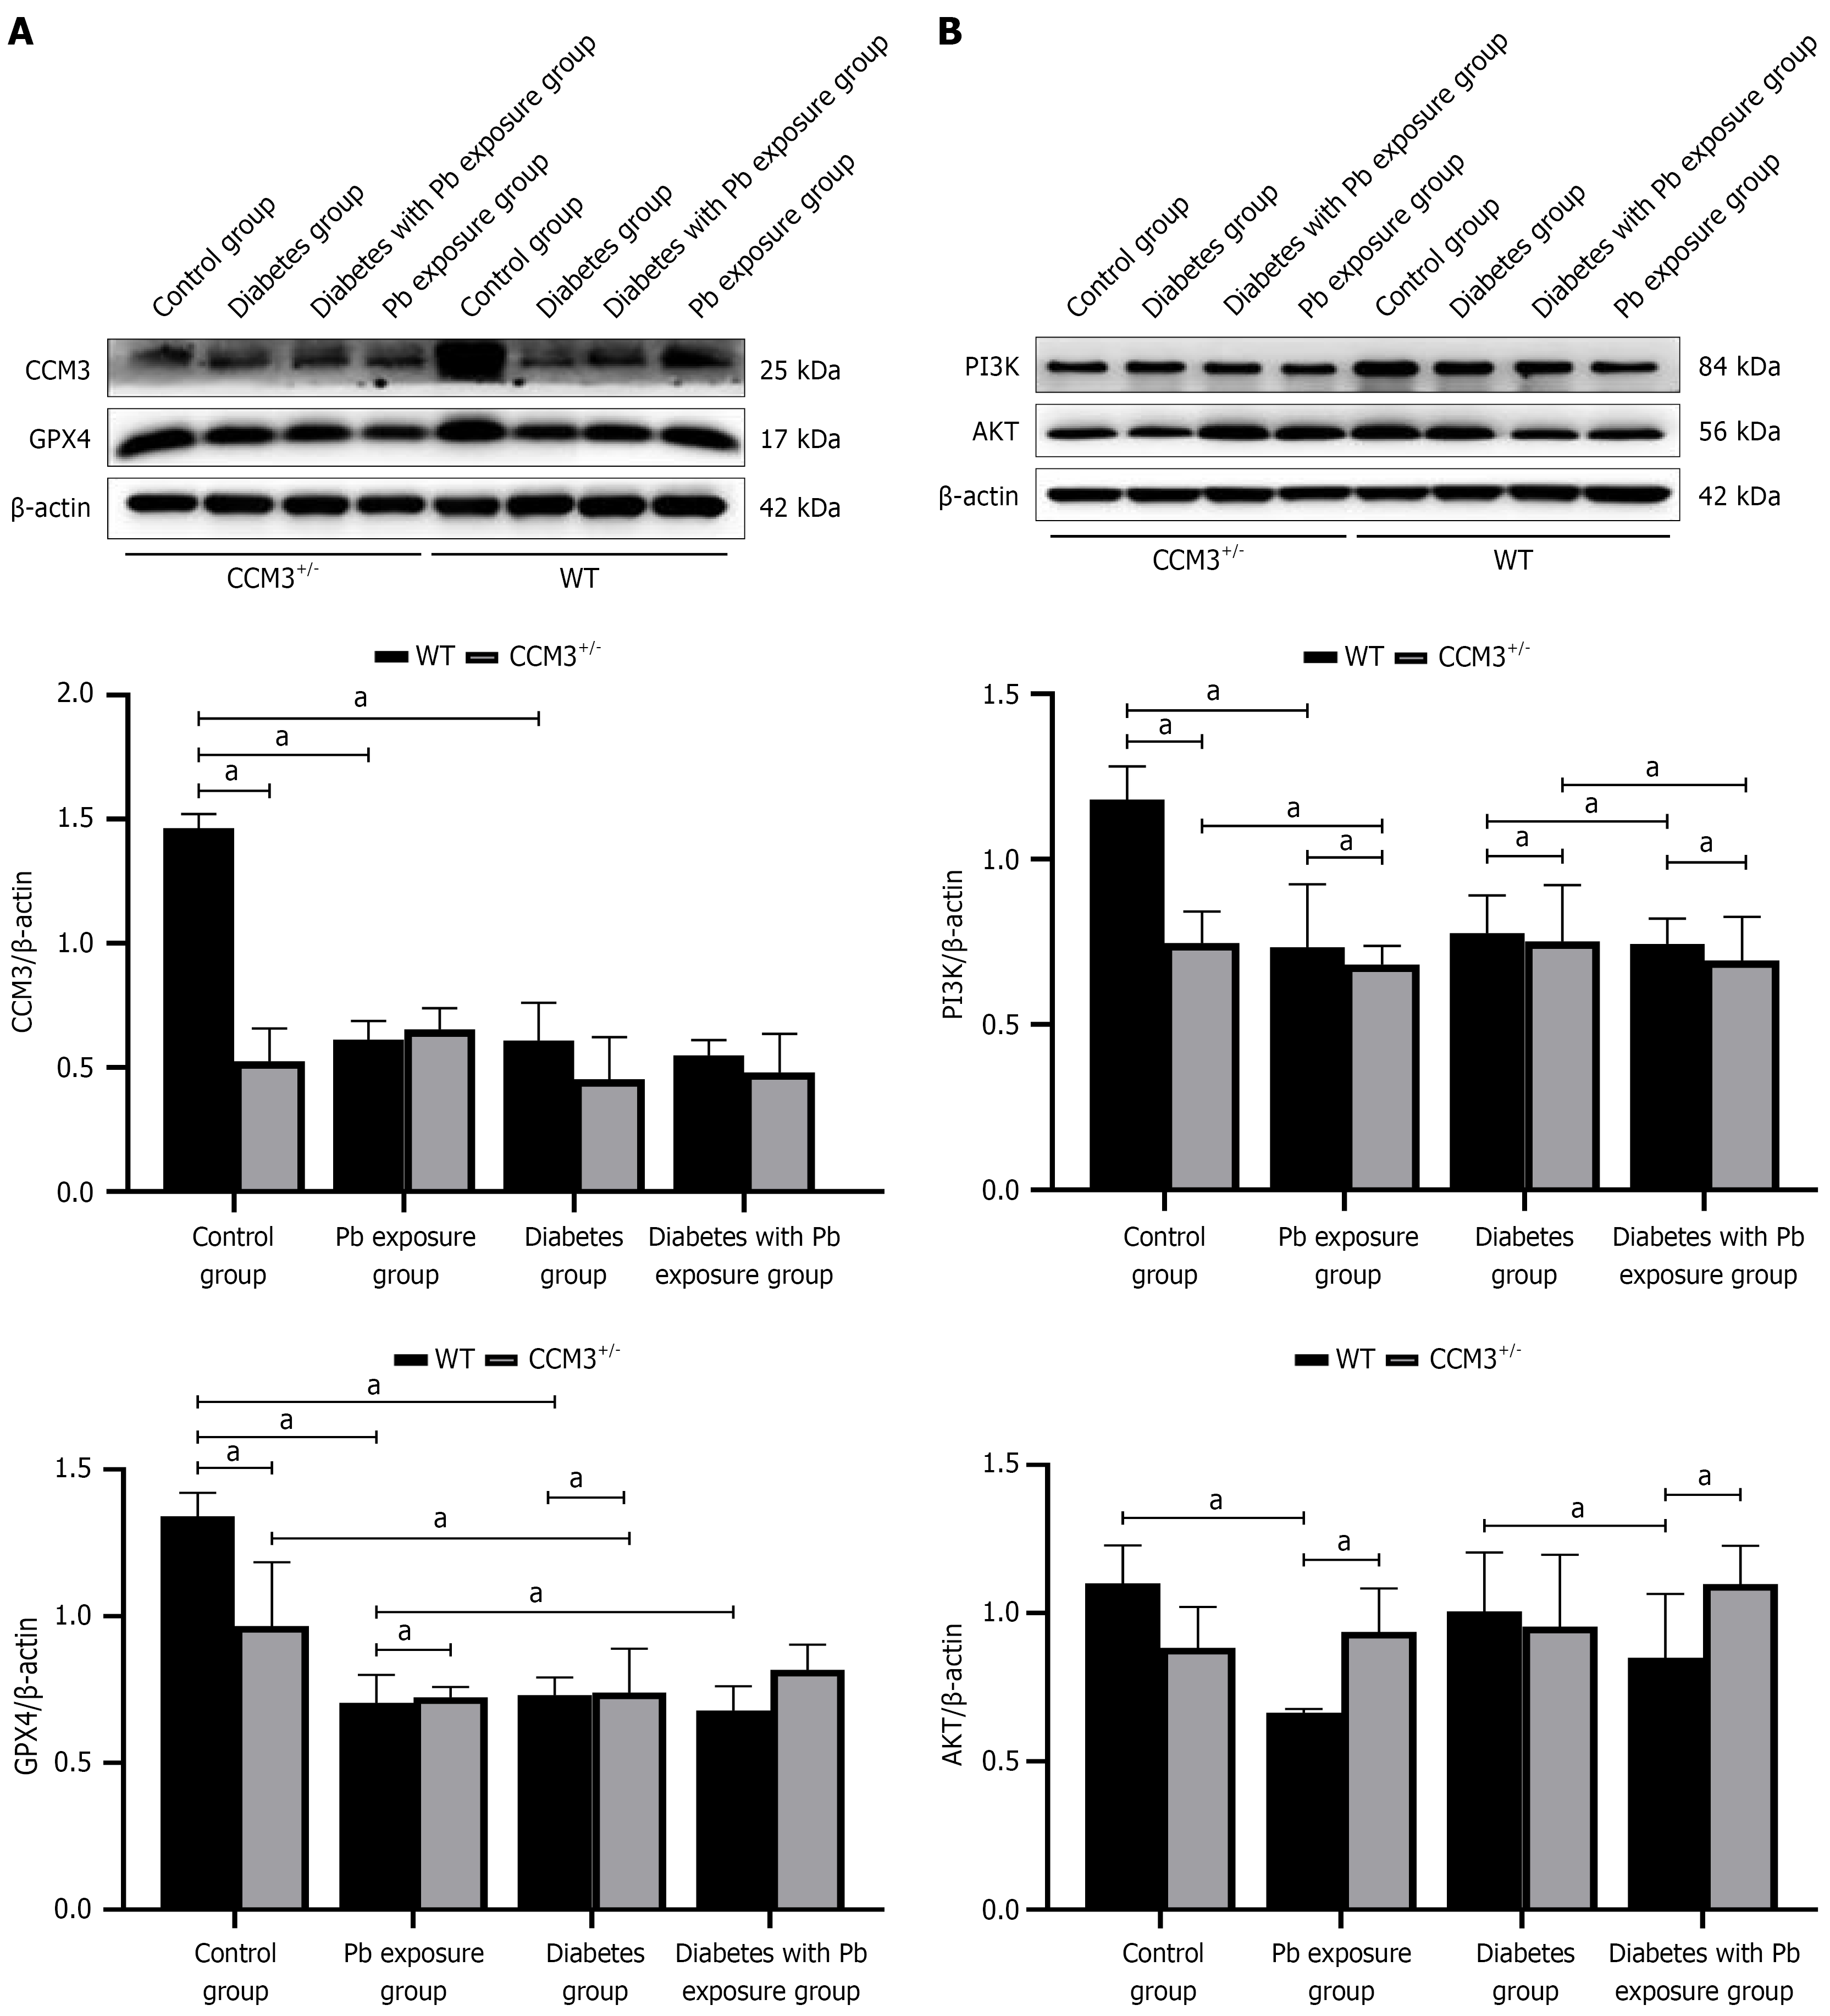
Figure 6 Western blot results of hippocampal tissue of mice in each group.
A: Expression of CCM3 and GPX4 in the hippocampus of mice in each group; B: Expression of PI3K and AKT in the hippocampus of mice in each group. aP < 0.05. WT: Wild-type.
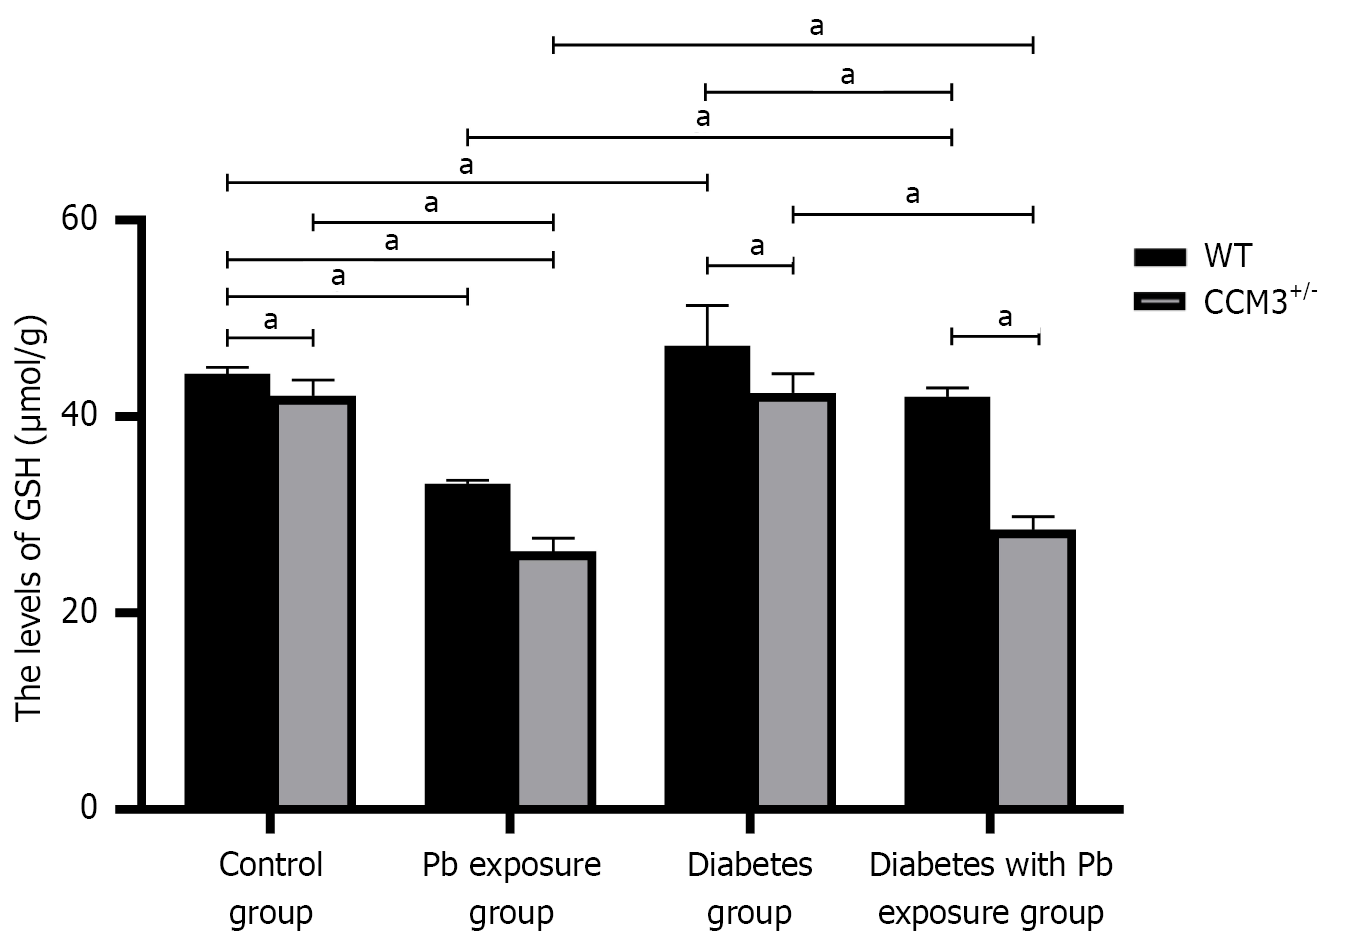
Figure 7 Glutathione levels in the hippocampus of mice.
aP < 0.05. WT: Wild-type.
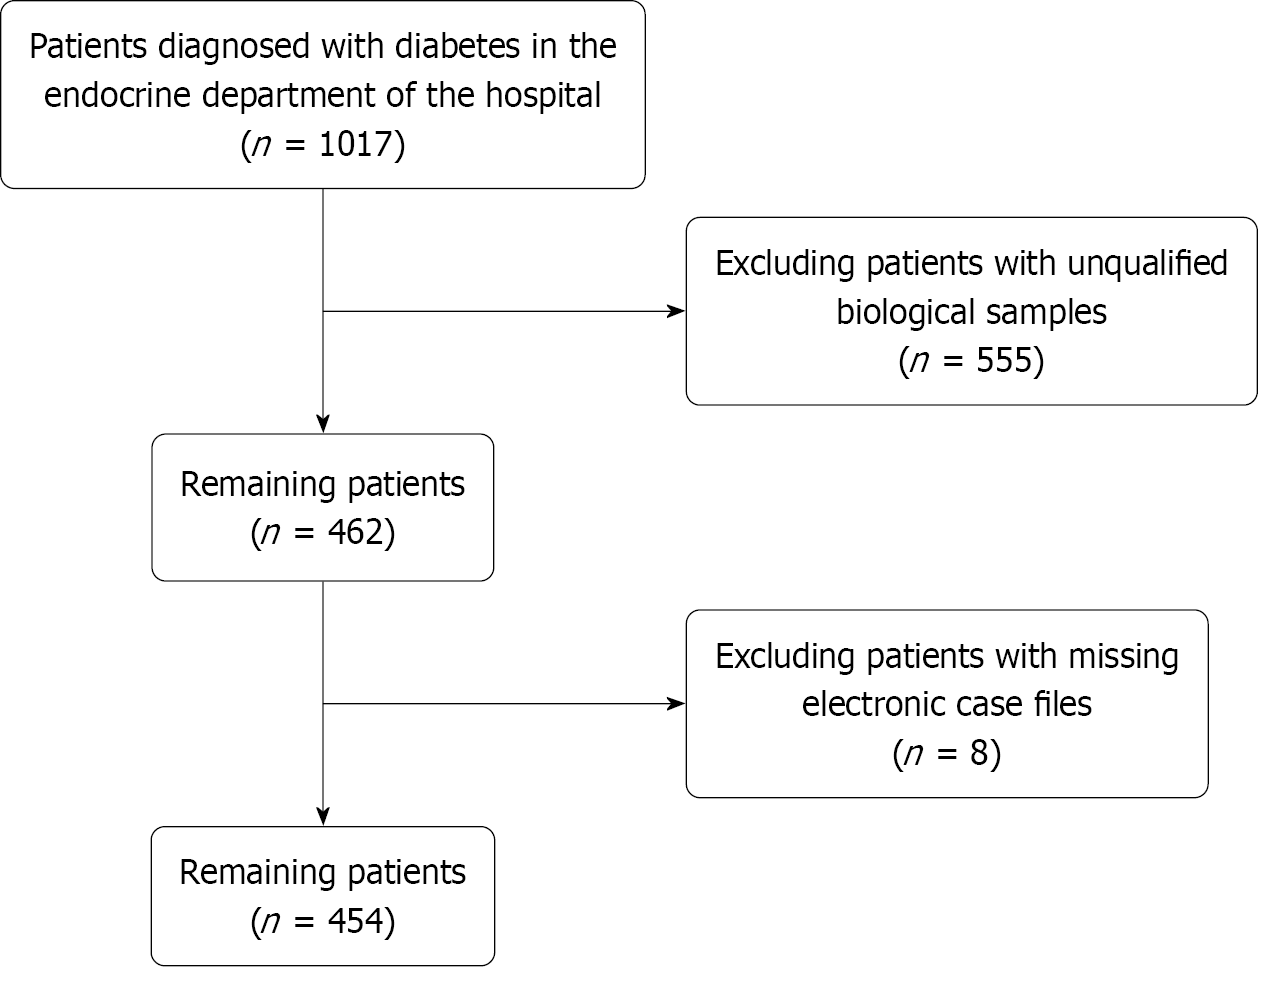
Figure 8
Research population screening process.
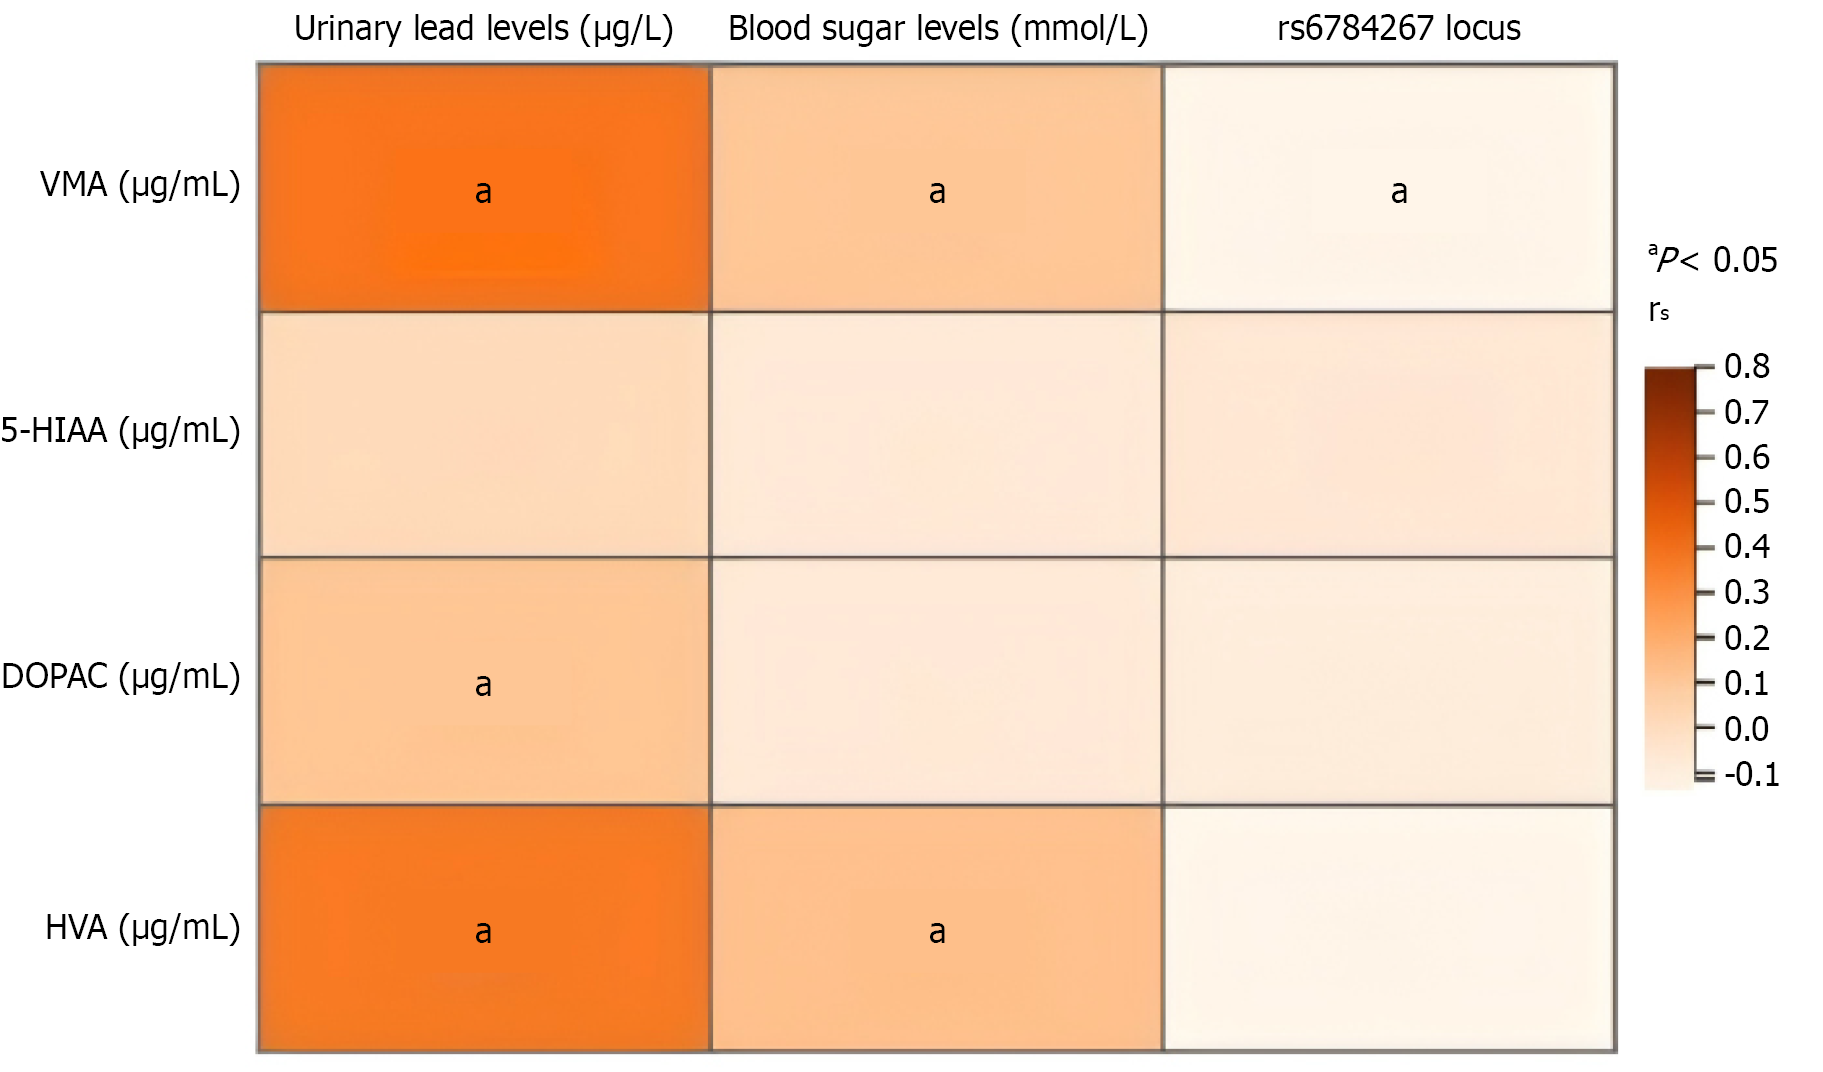
Figure 9 Heat map of correlation between urinary lead levels, blood glucose levels and rs6784267 locus with four neurotransmitter metabolites.
aP < 0.05. VMA: Vanillylmandelic acid; HVA: Homovanillic acid; DOPAC: 3,4-dihydroxyphenylacetic acid; 5-HIAA: 5-hydroxyindole acetic acid.
- Citation: Liang X, Yang LX, Tao T, Ding WJ, Tang XY, Shang ZB, Zhou H, He Y, Sun Y. Role of CCM3 in lead-induced neurological damage in diabetes. World J Diabetes 2026; 17(8): 113938
- URL: https://www.wjgnet.com/1948-9358/full/v17/i8/113938.htm
- DOI: https://dx.doi.org/10.4239/wjd.113938