
















Copyright: ©Author(s) 2026.
World J Diabetes. Jul 15, 2026; 17(7): 119604
Published online Jul 15, 2026. doi: 10.4239/wjd.119604
Published online Jul 15, 2026. doi: 10.4239/wjd.119604
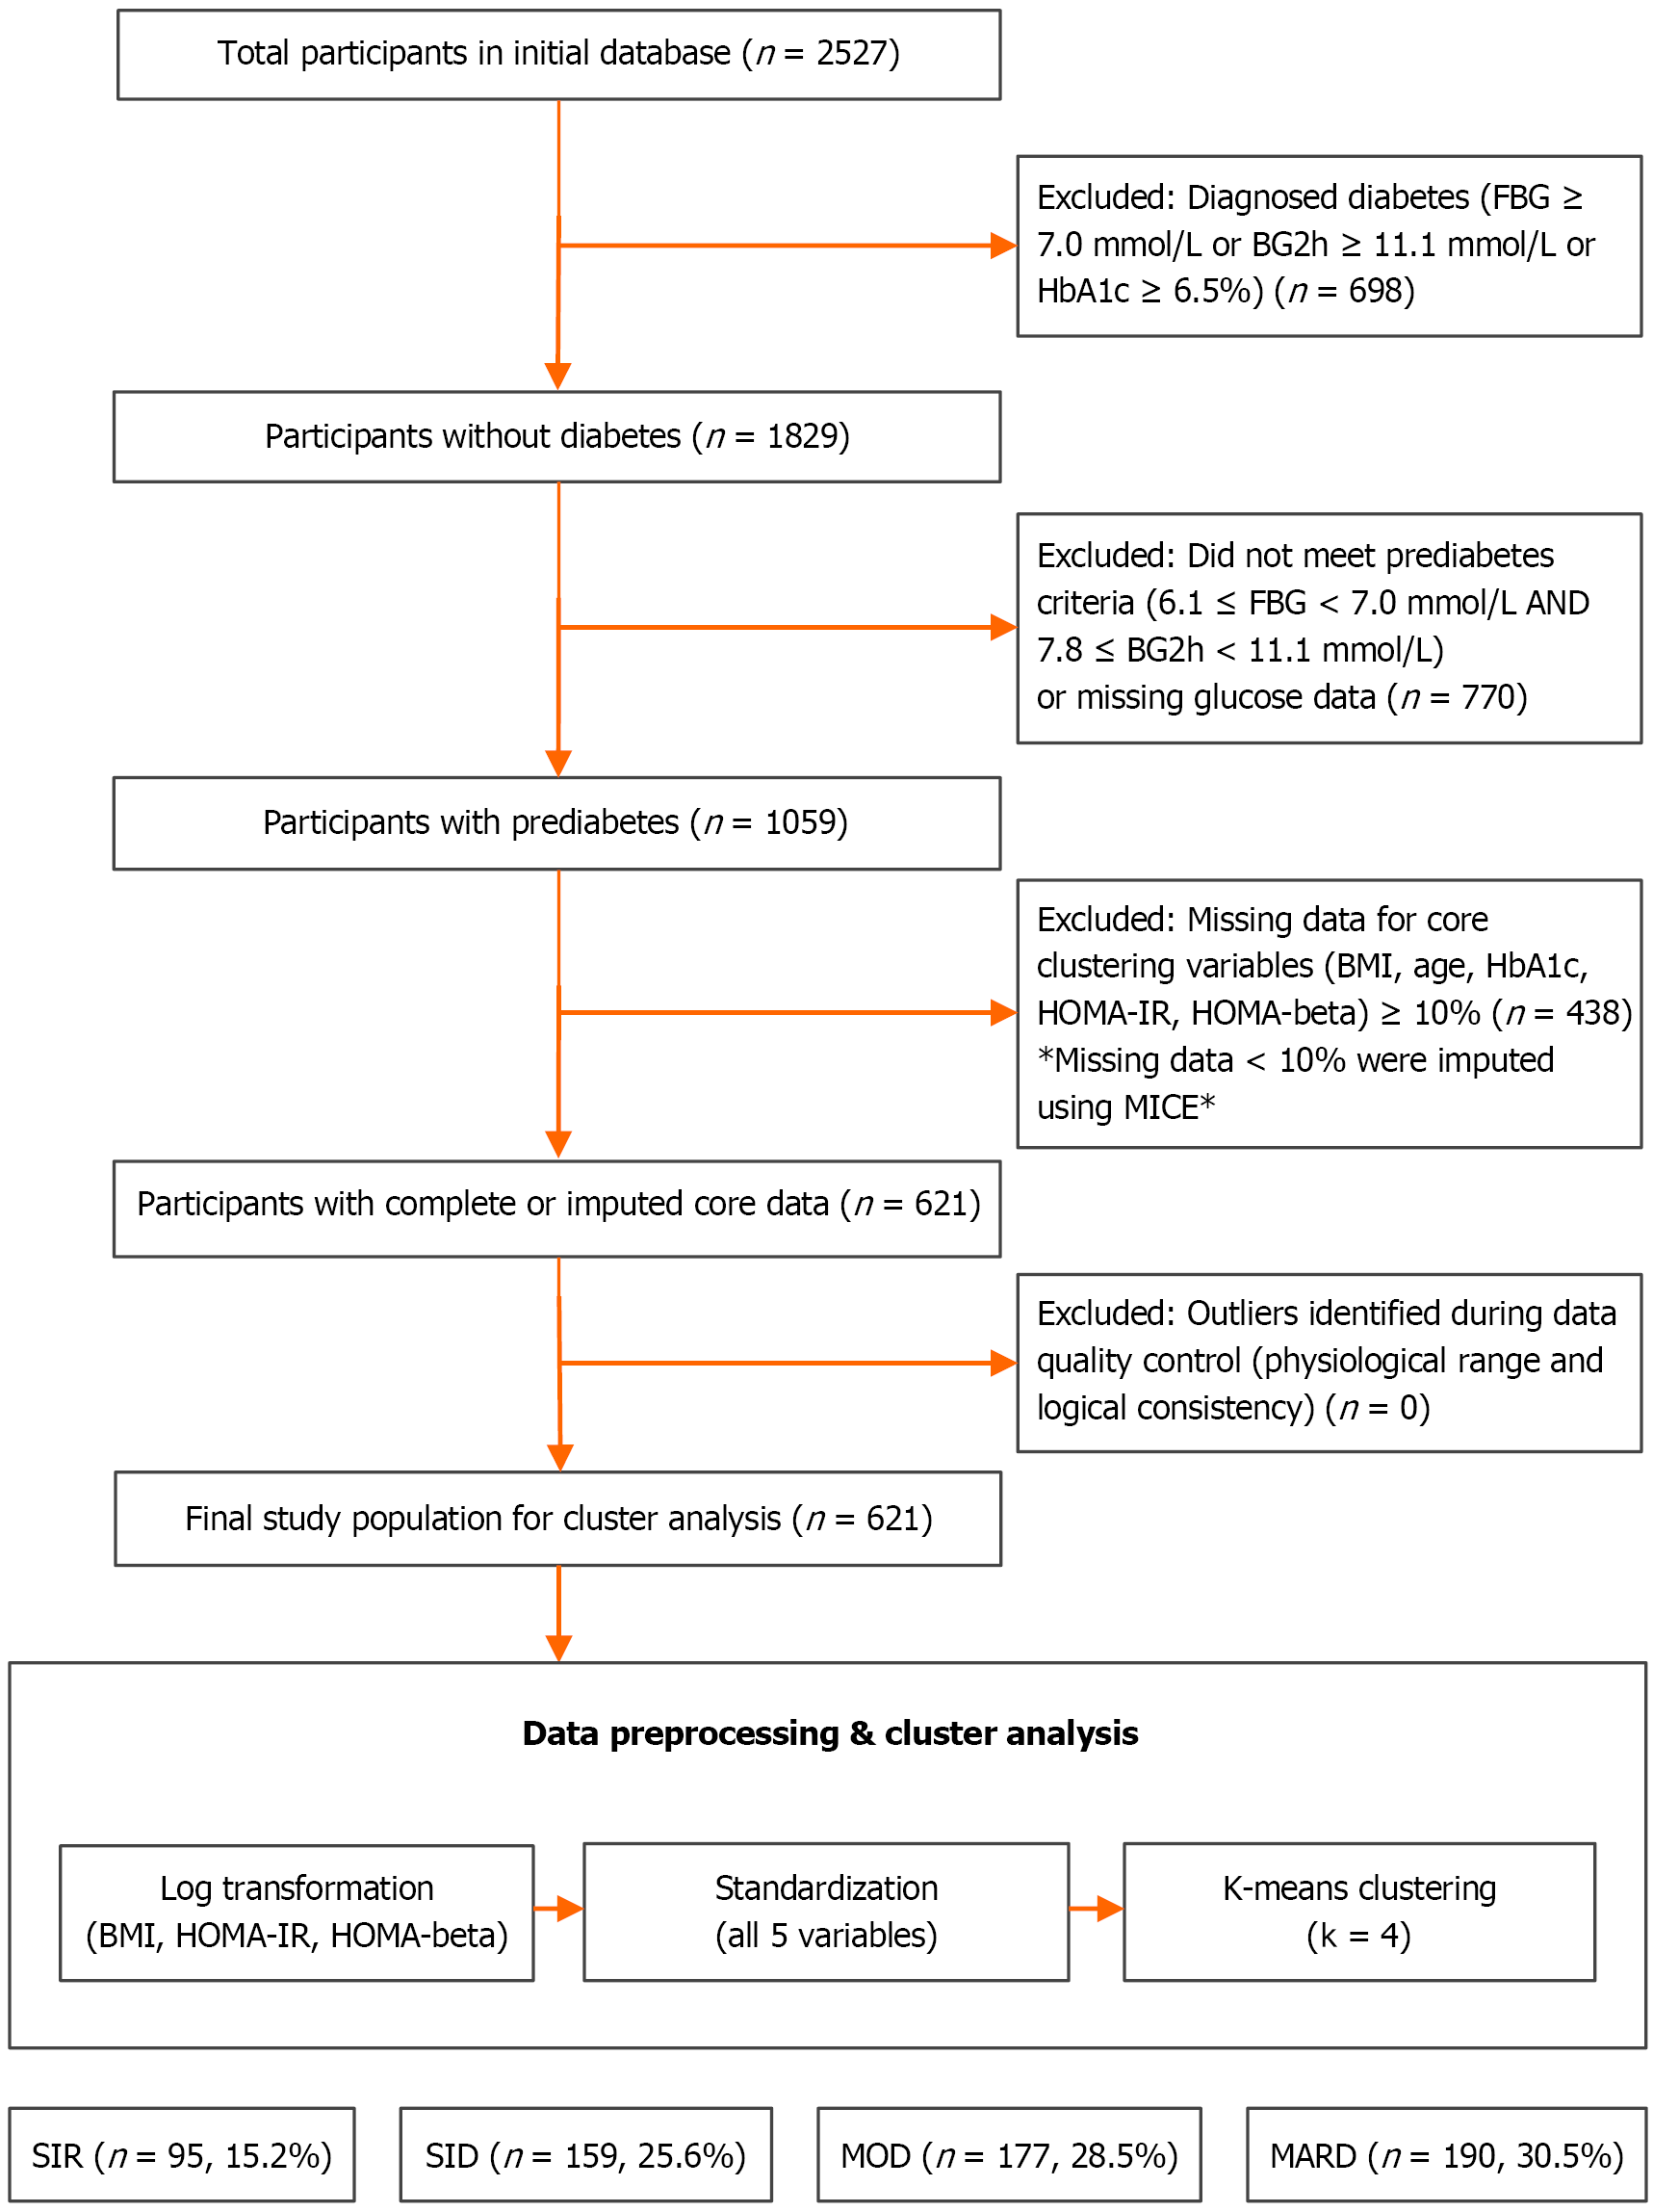
Figure 1 Study flowchart of participant selection, data preprocessing and cluster derivation.
A total of 2527 participants were screened, 1059 met the prediabetes definition, and 621 remained for clustering after exclusion for diabetes, non-prediabetes or missing glucose data, and missing core clustering variables. The clustering workflow included log transformation of body mass index, homeostatic model assessment of insulin resistance, and homeostatic model assessment of β-cell function, standardization of all five core variables, and K-means clustering (k = 4), which identified four subtypes. FBG: Fasting blood glucose; BG2h: 2-hour blood glucose; HbA1c: Glycated hemoglobin A1c; BMI: Body mass index; HOMA-IR: Homeostatic model assessment of insulin resistance; HOMA-β: Homeostatic model assessment of β-cell function; MICE: Multiple imputation by chained equations; SIR: Severe insulin resistant; SID: Severe insulin deficiency; MOD: Mild obesity-related dysmetabolism; MARD: Mild age-related dysmetabolism.
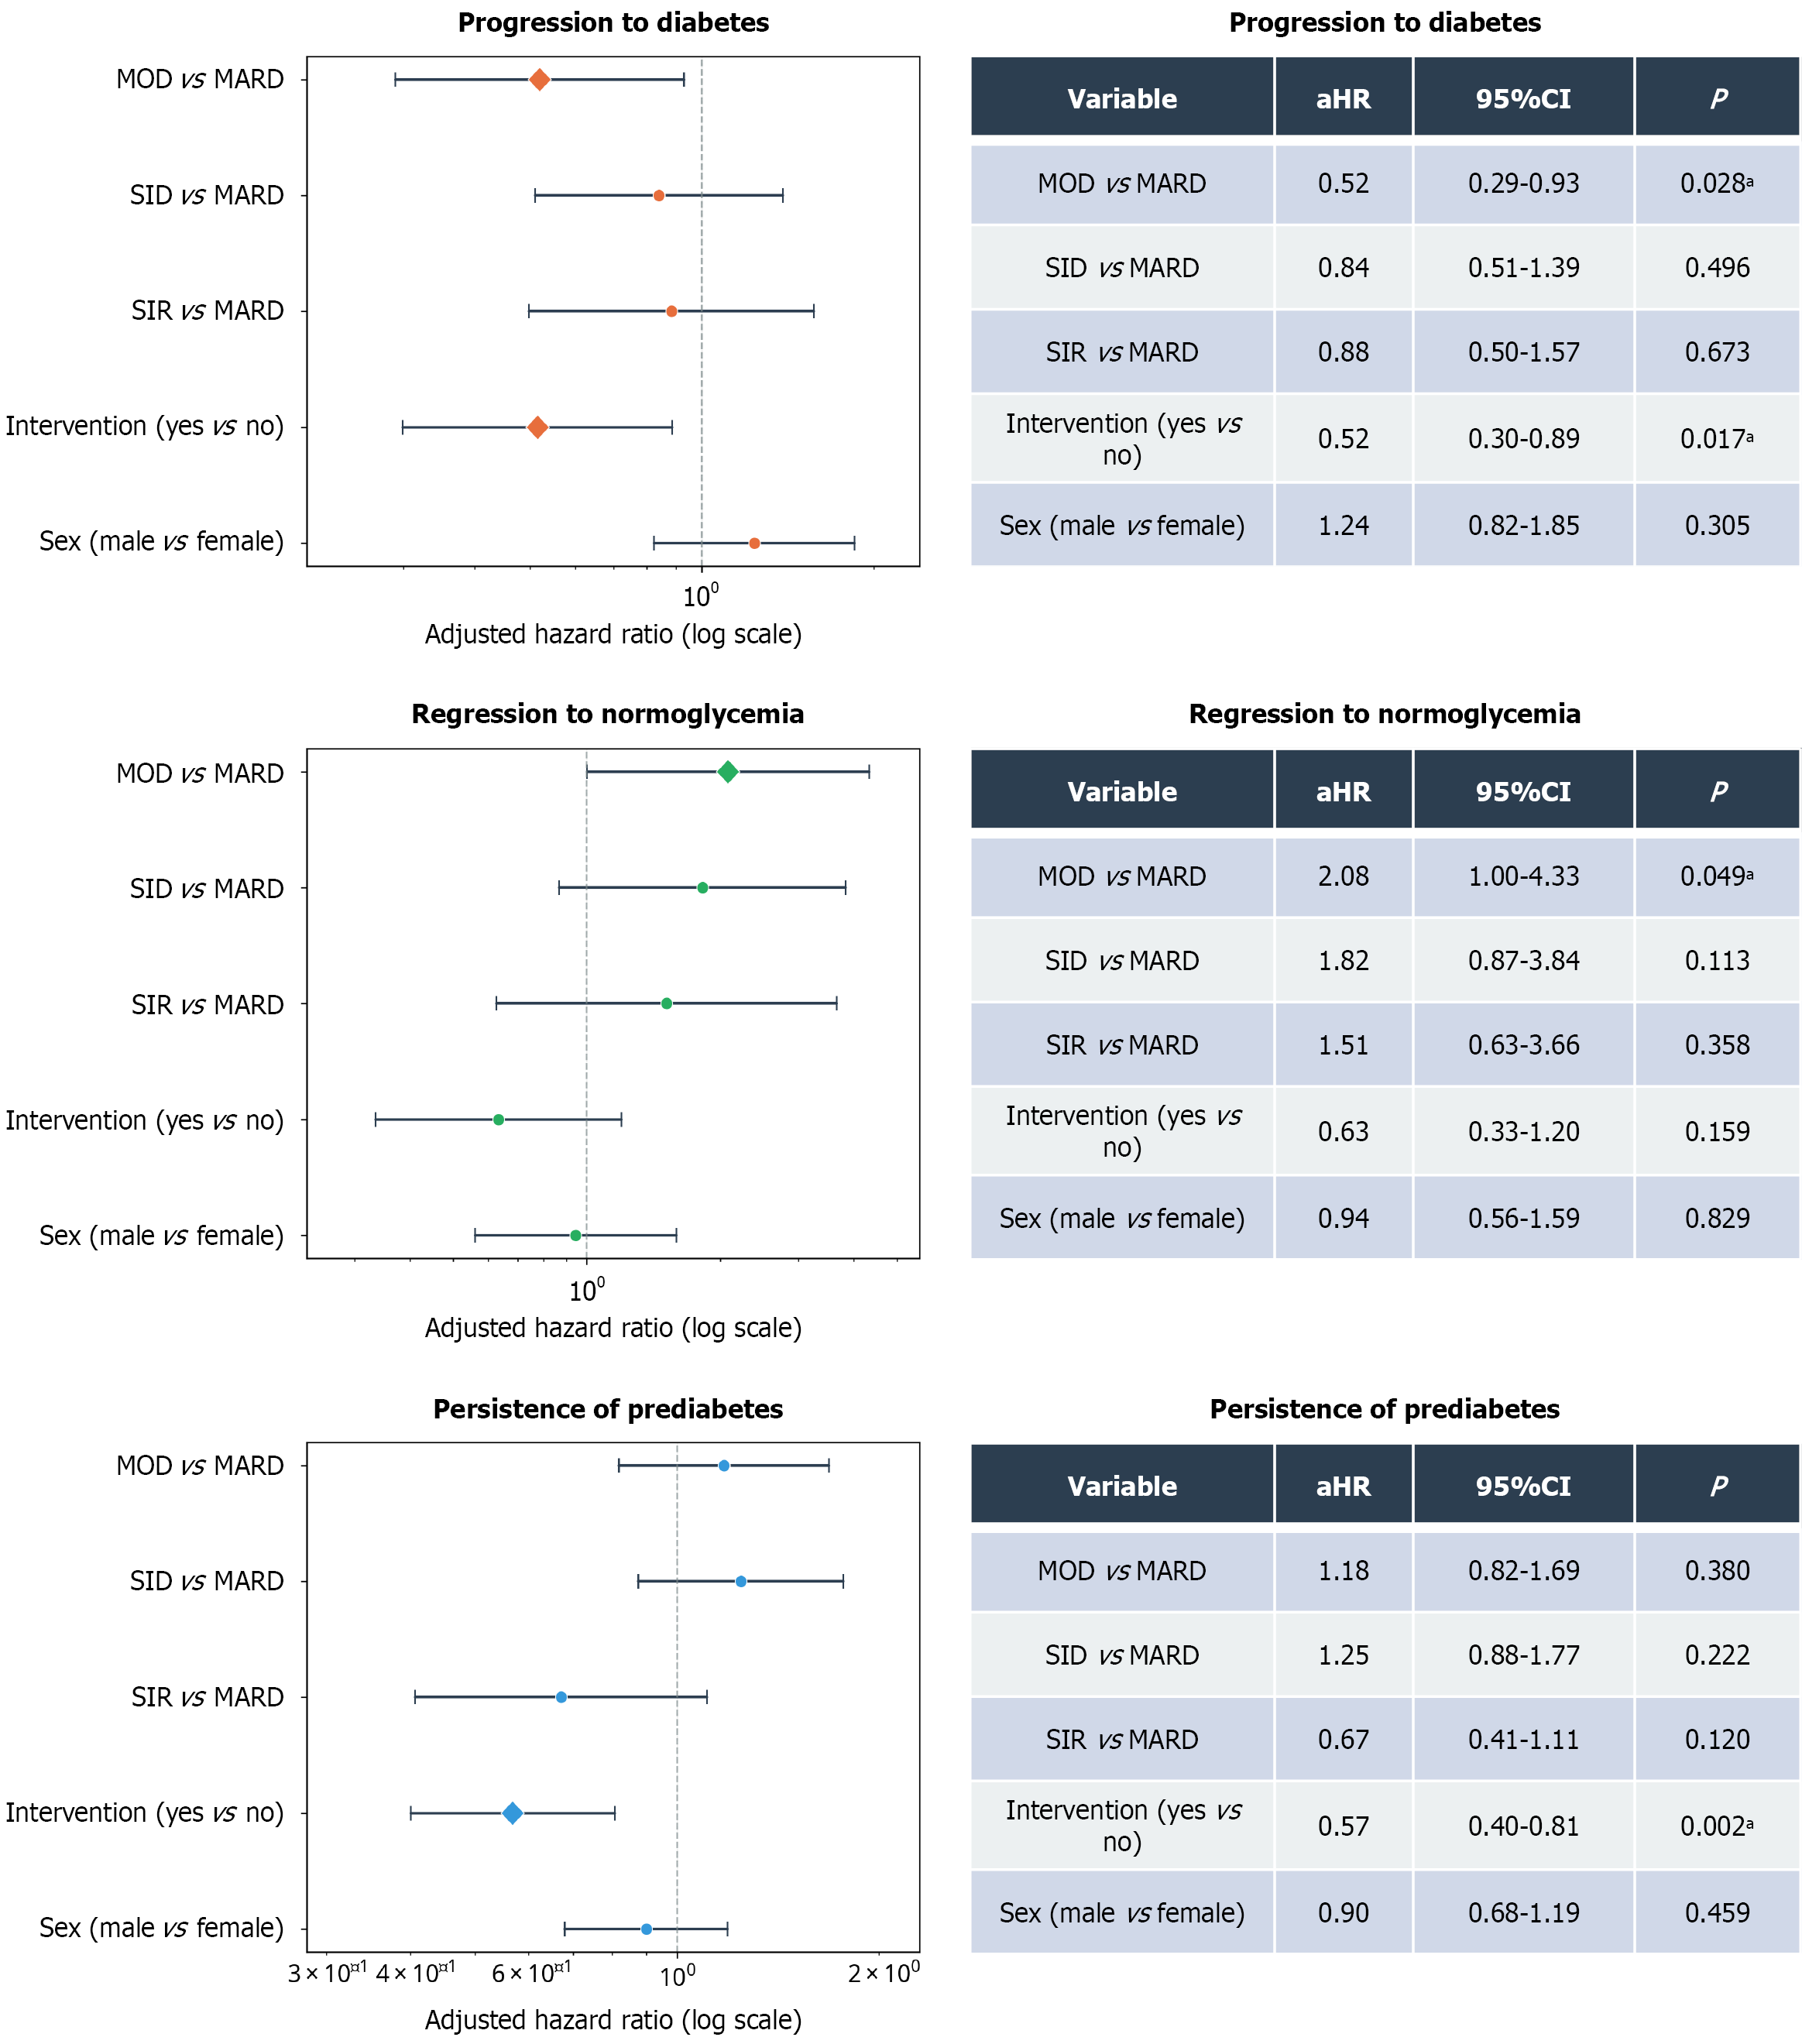
Figure 2 Forest plot of adjusted hazard ratios (cause-specific Cox models).
Panels show the associations of subtype, intervention, and sex with progression to diabetes, regression to normoglycemia, and persistence of prediabetes. Points indicate adjusted hazard ratios and horizontal lines indicate 95% confidence intervals; the dashed vertical line marks the null value (adjusted hazard ratio = 1.0). Models were adjusted for diabetes subtype, intervention status, and sex, with mild age-related dysmetabolism as the reference subtype. aP < 0.05. aHR: Adjusted hazard ratio; CI: Confidence interval; MARD: Mild age-related dysmetabolism; MOD: Mild obesity-related dysmetabolism; SID: Severe insulin deficiency; SIR: Severe insulin resistance.
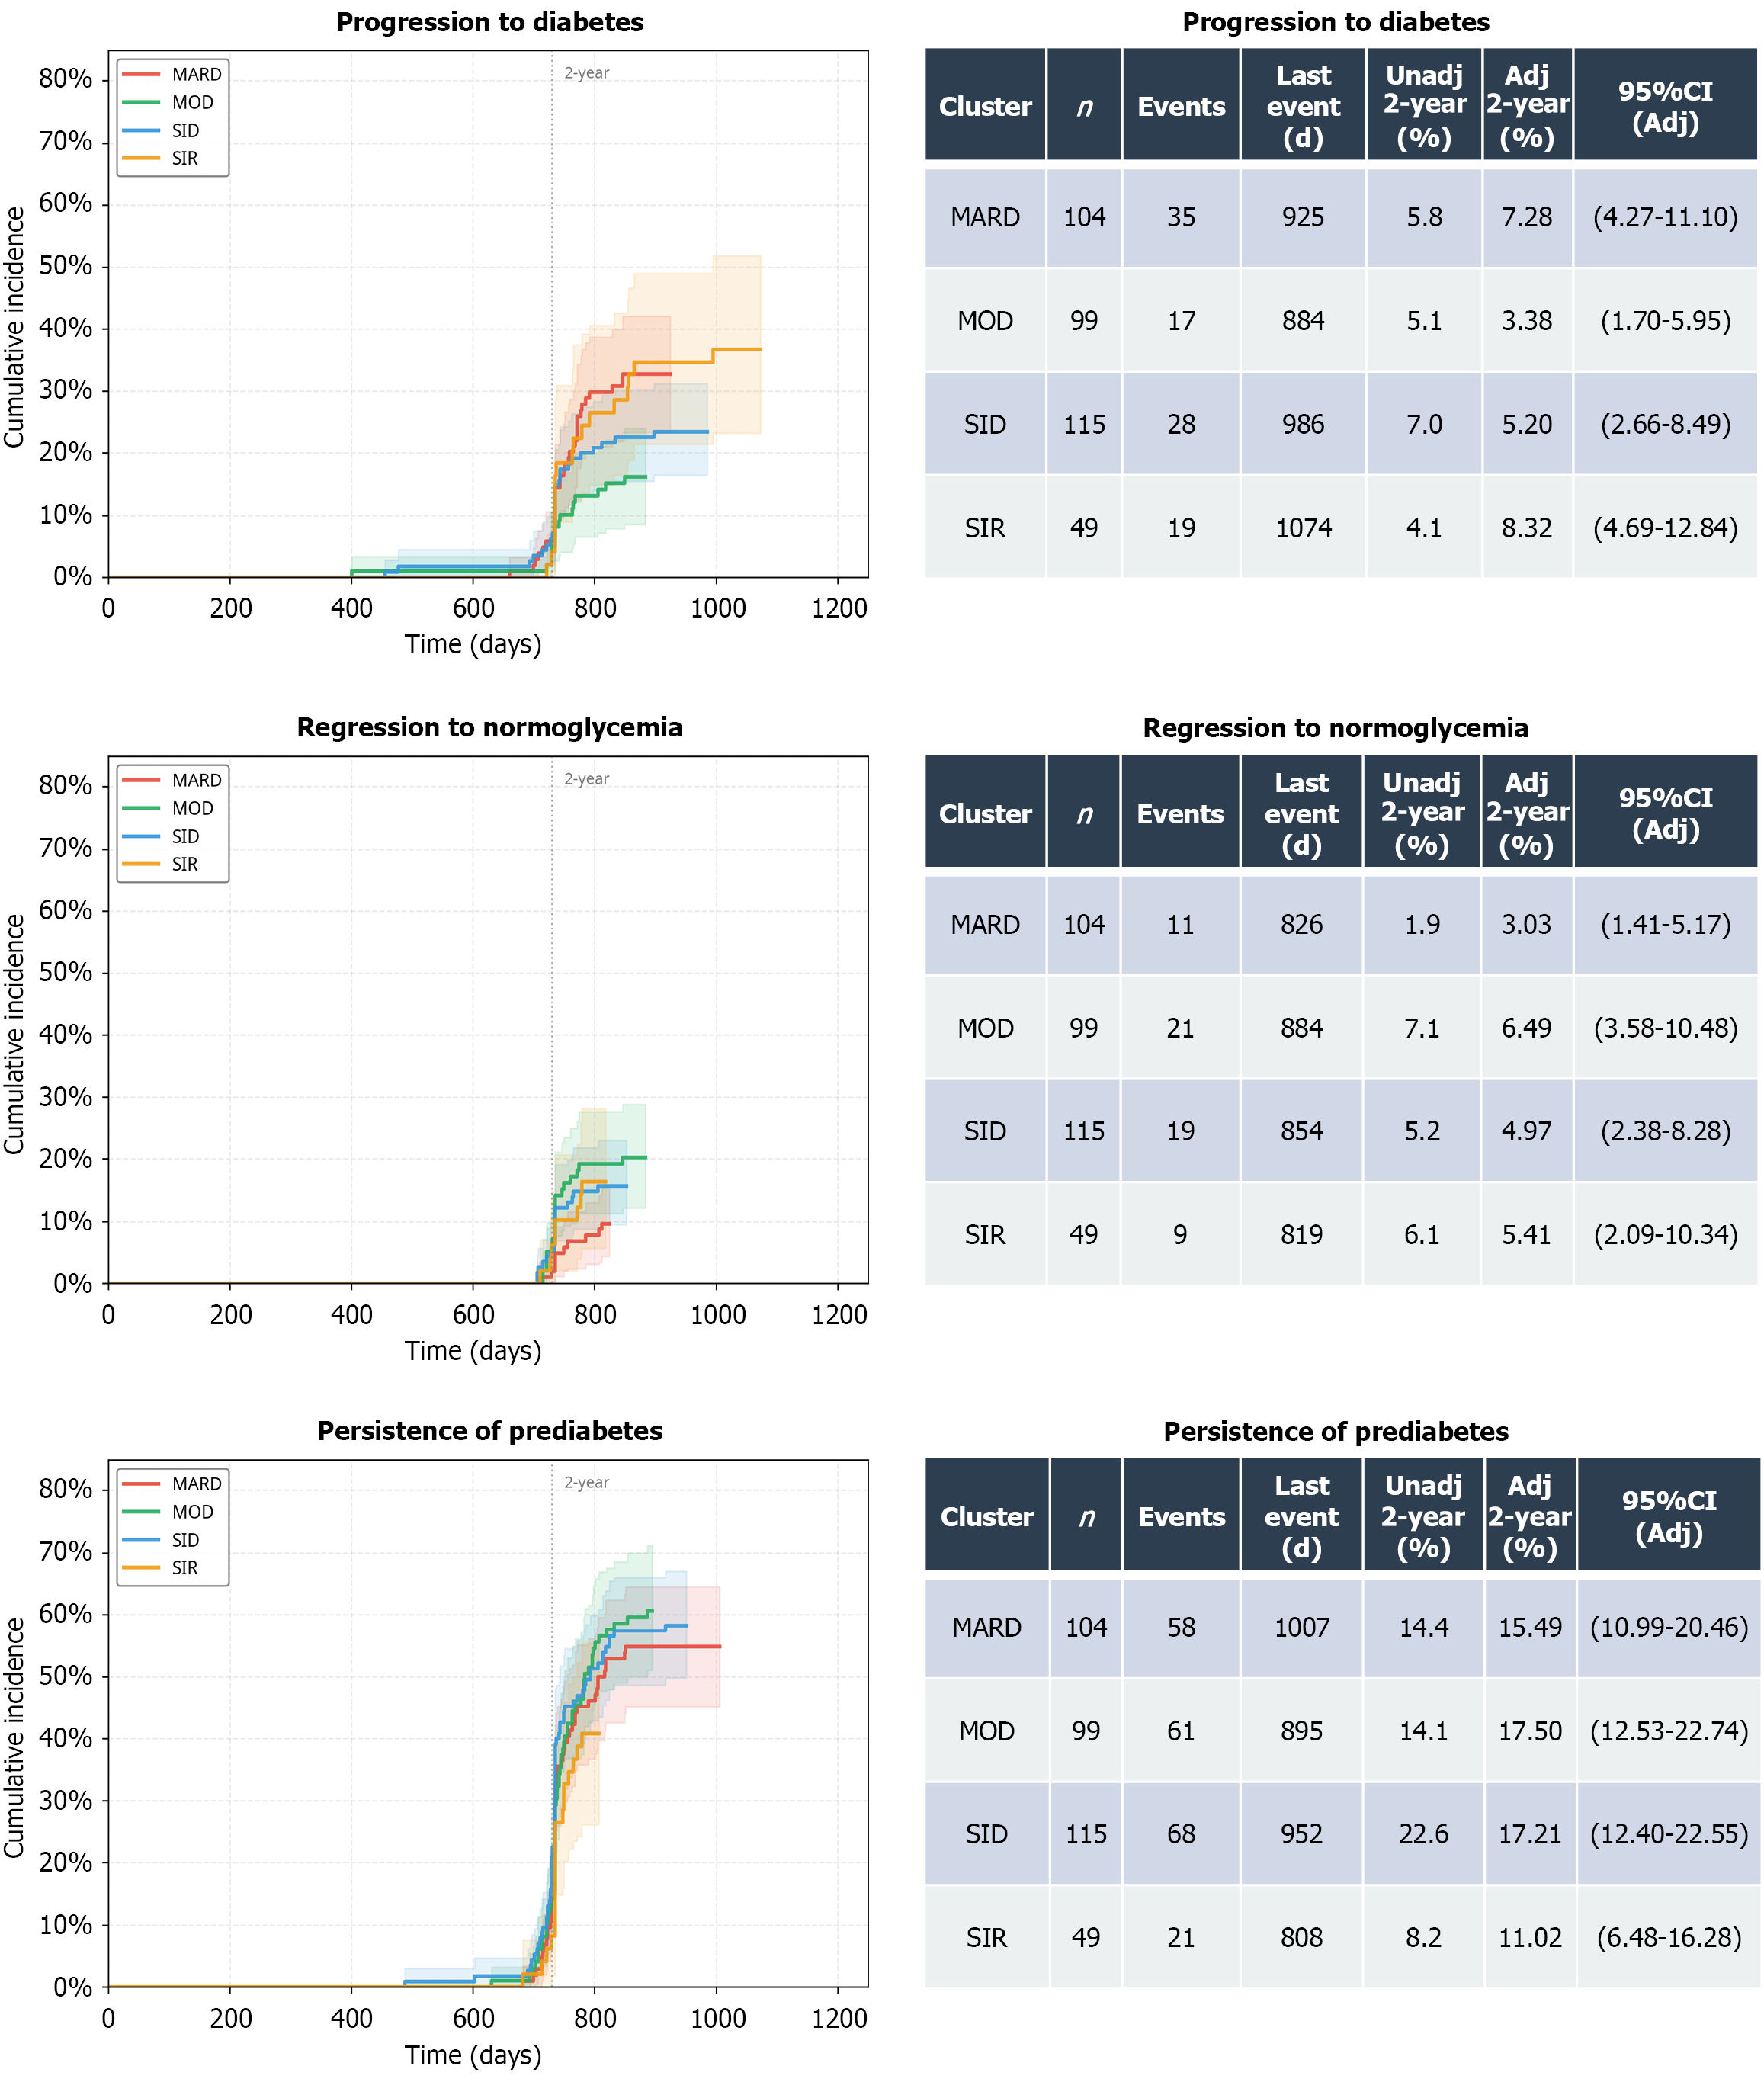
Figure 3 Cumulative incidence functions (Aalen-Johansen) with adjusted 2-year cumulative incidence function.
Panels show Aalen-Johansen cumulative incidence curves for progression to diabetes, regression to normoglycemia, and persistence of prediabetes across the four metabolic subtypes. Shaded bands indicate 95% confidence intervals from 500 bootstrap resamples, and the vertical dotted line marks 2 years. Tables below each panel summarize sample size, events, last event time, unadjusted 2-year cumulative incidence, adjusted 2-year cumulative incidence, and 95% confidence intervals. Adjusted 2-year cumulative incidence was estimated with Fine-Gray competing risk models and marginal standardization, adjusting for subtype, intervention, and sex. MARD: Mild age-related dysmetabolism; MOD: Mild obesity-related dysmetabolism; SID: Severe insulin deficiency; SIR: Severe insulin resistance; CI: Confidence interval.
- Citation: Zhang SH, Zhang JP, Song LL, Wu LL, Li ZQ, He YF, Deng RF, Ma WL, Zhang C, Zhang B, Yu LP. Metabolic feature-based clustering for subtype identification and longitudinal outcome predictions in the Chinese prediabetic population. World J Diabetes 2026; 17(7): 119604
- URL: https://www.wjgnet.com/1948-9358/full/v17/i7/119604.htm
- DOI: https://dx.doi.org/10.4239/wjd.119604