
















Copyright: ©Author(s) 2026.
World J Diabetes. Oct 15, 2026; 17(10): 123730
Published online Oct 15, 2026. doi: 10.4239/wjd.123730
Published online Oct 15, 2026. doi: 10.4239/wjd.123730
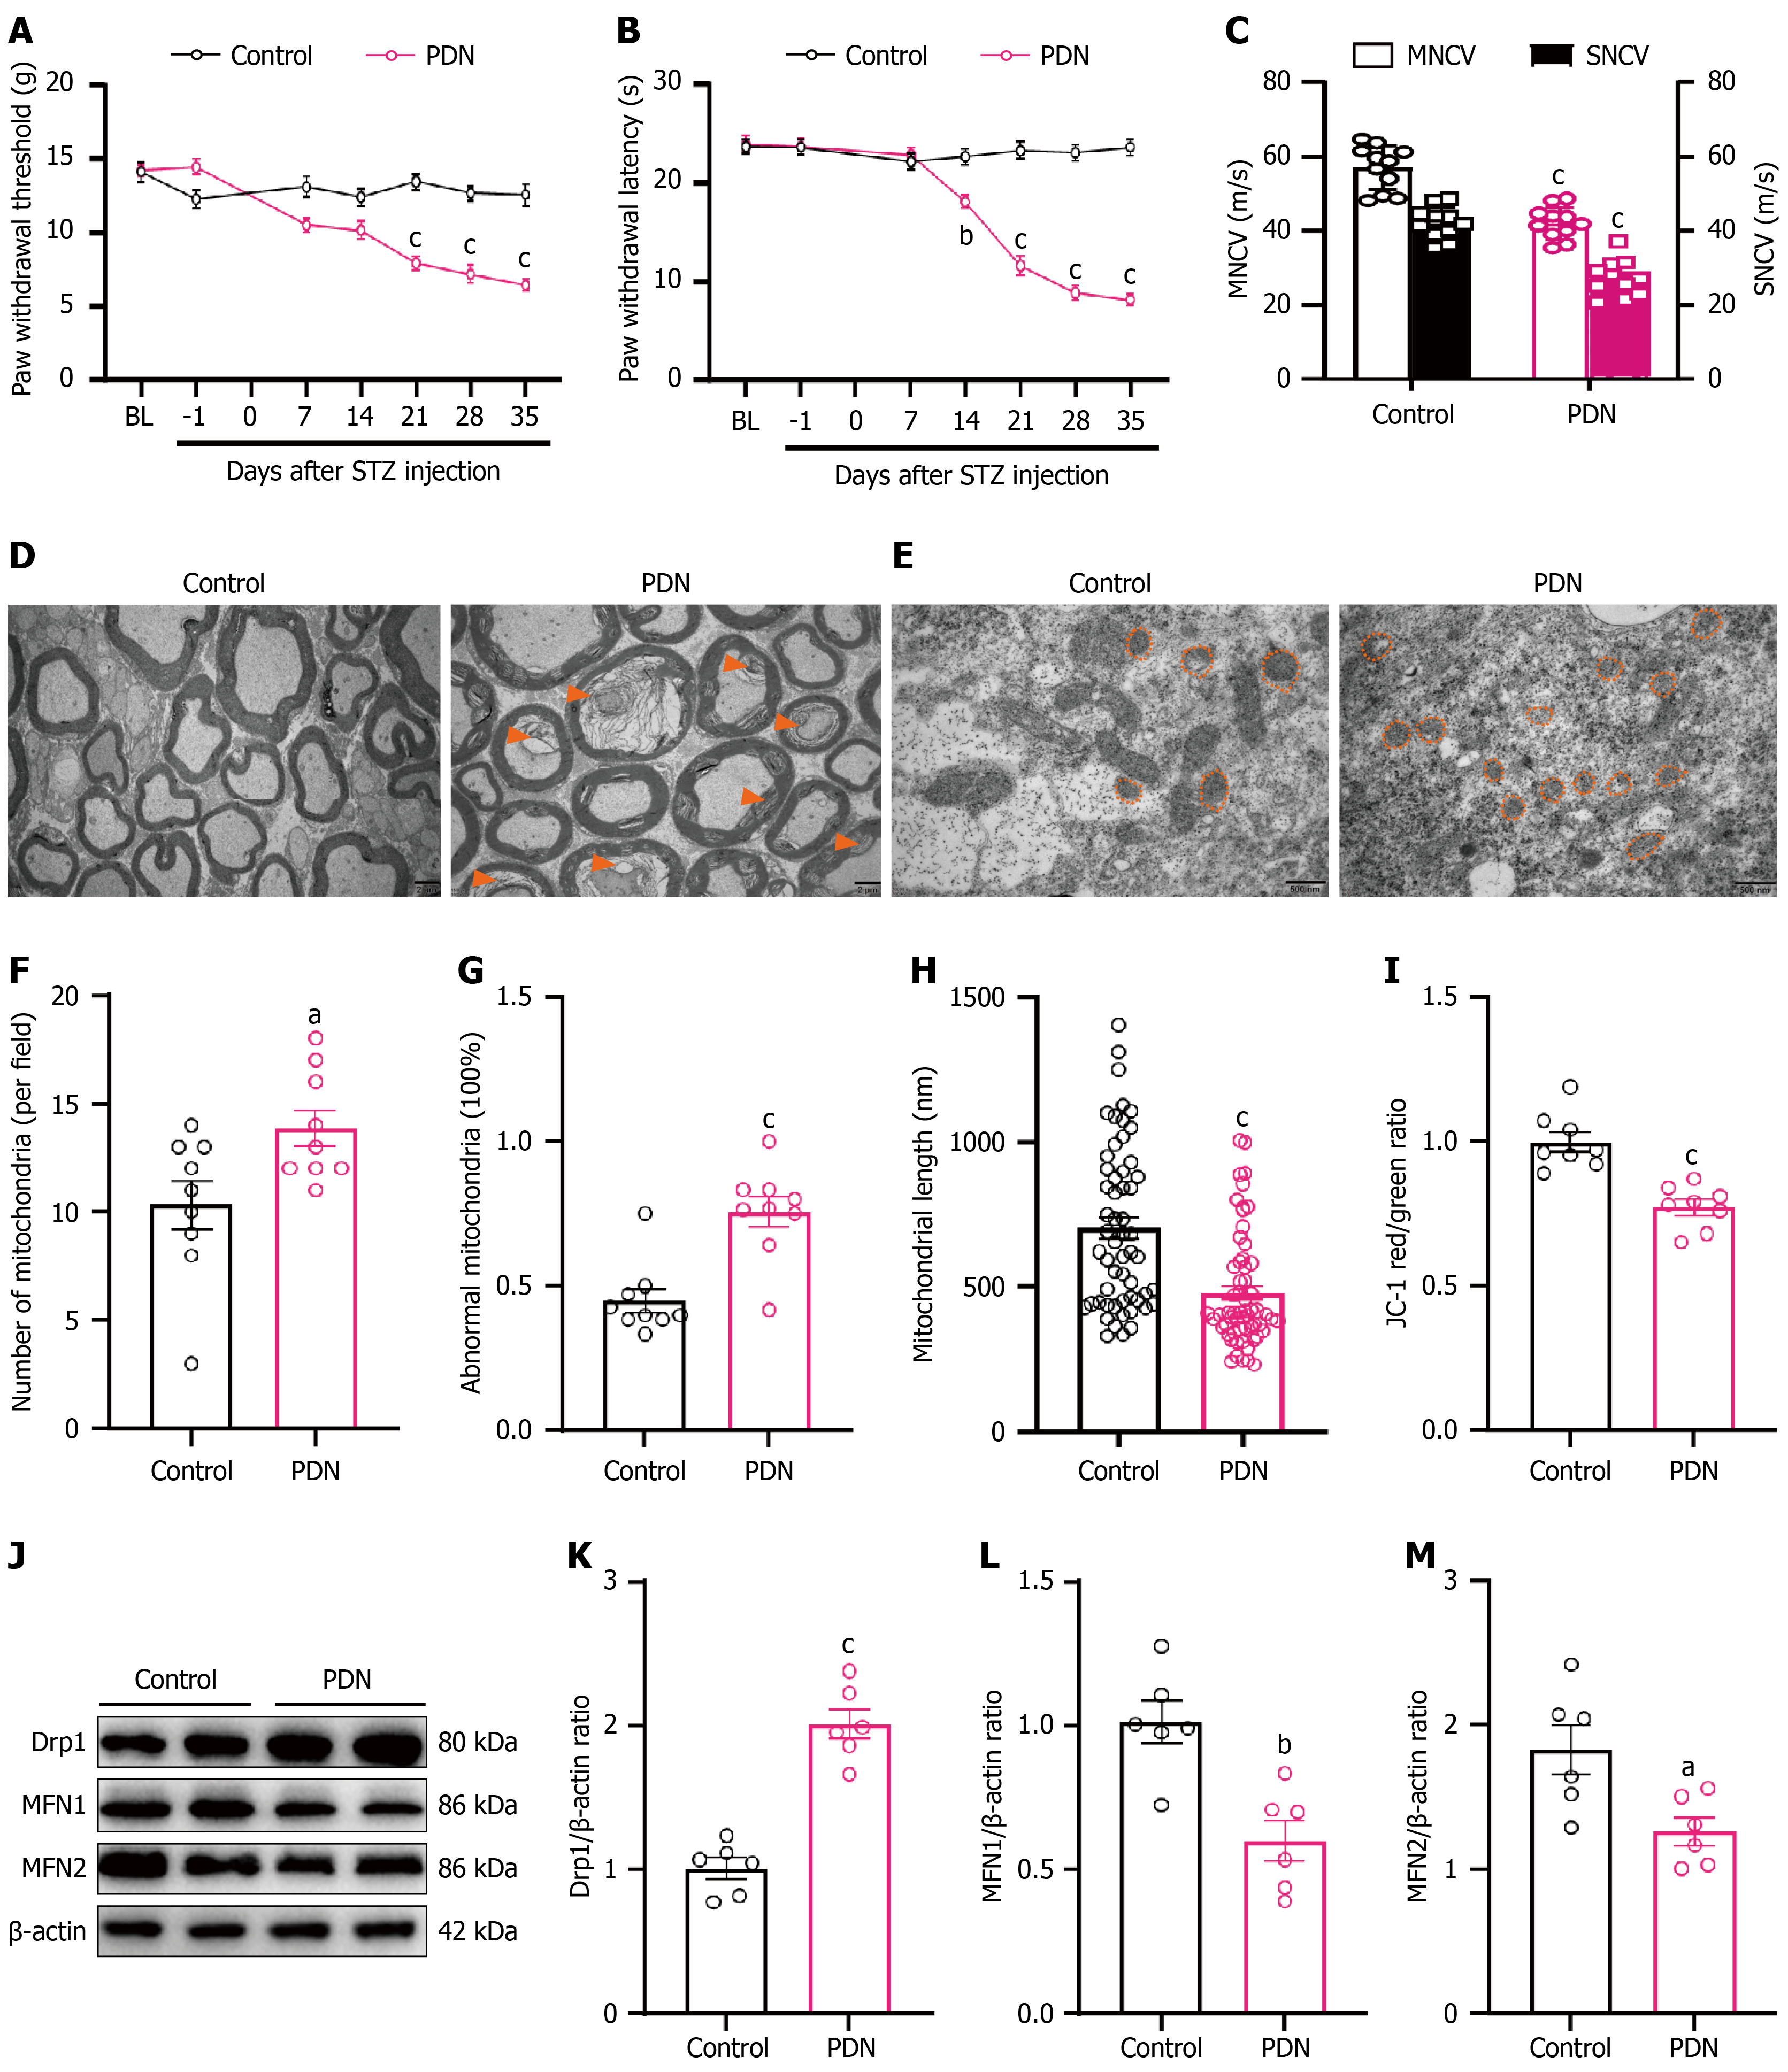
Figure 1 The rat model of painful diabetic neuropathy established through high-fat feeding combined with low-dose streptozotocin injection.
aP < 0.05, bP < 0.01, cP < 0.001 vs the control group; two-way analysis of variance with Sidak’s post-hoc test for Figure 1A and B; Unpaired t-tests, two-tailed for Figure 1C, I, K-M; Linear mixed-effects models were applied for two-group comparisons of data in panels F-H, with animal ID set as a random intercept to account for clustered observations within individual rats; Figure 1A-C: n = 11; Figure 1D-H: n = 3 rats per group, with at least 50 mitochondria counted in 3 random fields per sample. For Figure 1F and G, each field was the statistical unit; for panel H, each individual mitochondrion was the statistical unit for mitochondrial length quantification; I: n = 8; J-M: n = 6. A: Paw withdrawal threshold in painful diabetic neuropathy (PDN) rats; B: Paw withdrawal latency in PDN rats; C: Motor nerve conduction velocity and sensory nerve conduction velocity in PDN rats; D: Ultrastructural analysis of nerve fibers in the dorsal root ganglion (DRG) of PDN rats. Scale bar = 2 μm; E: Examination of mitochondrial structure in the DRG of PDN rats. Scale bar = 500 nm; F: Measurement of the number of mitochondria per field; G: Proportion of abnormal mitochondria to total mitochondria; H: Measurement of mitochondrial length; I: Assessment of mitochondrial membrane potential in the DRG of PDN rats, in which quantitative data were acquired by a fluorescence microplate reader; J-M: Western blotting showing the expression level of proteins associated with mitochondrial fission protein dynamin-related protein 1 and fusion proteins MFN1/MFN2, including representative electrophoresis bands and relative expression levels. PDN: Painful diabetic neuropathy; MNCV: Motor nerve conduction velocity; SNCV: Sensory nerve conduction velocity; STZ: Streptozotocin; Drp1: Dynamin-related protein 1.
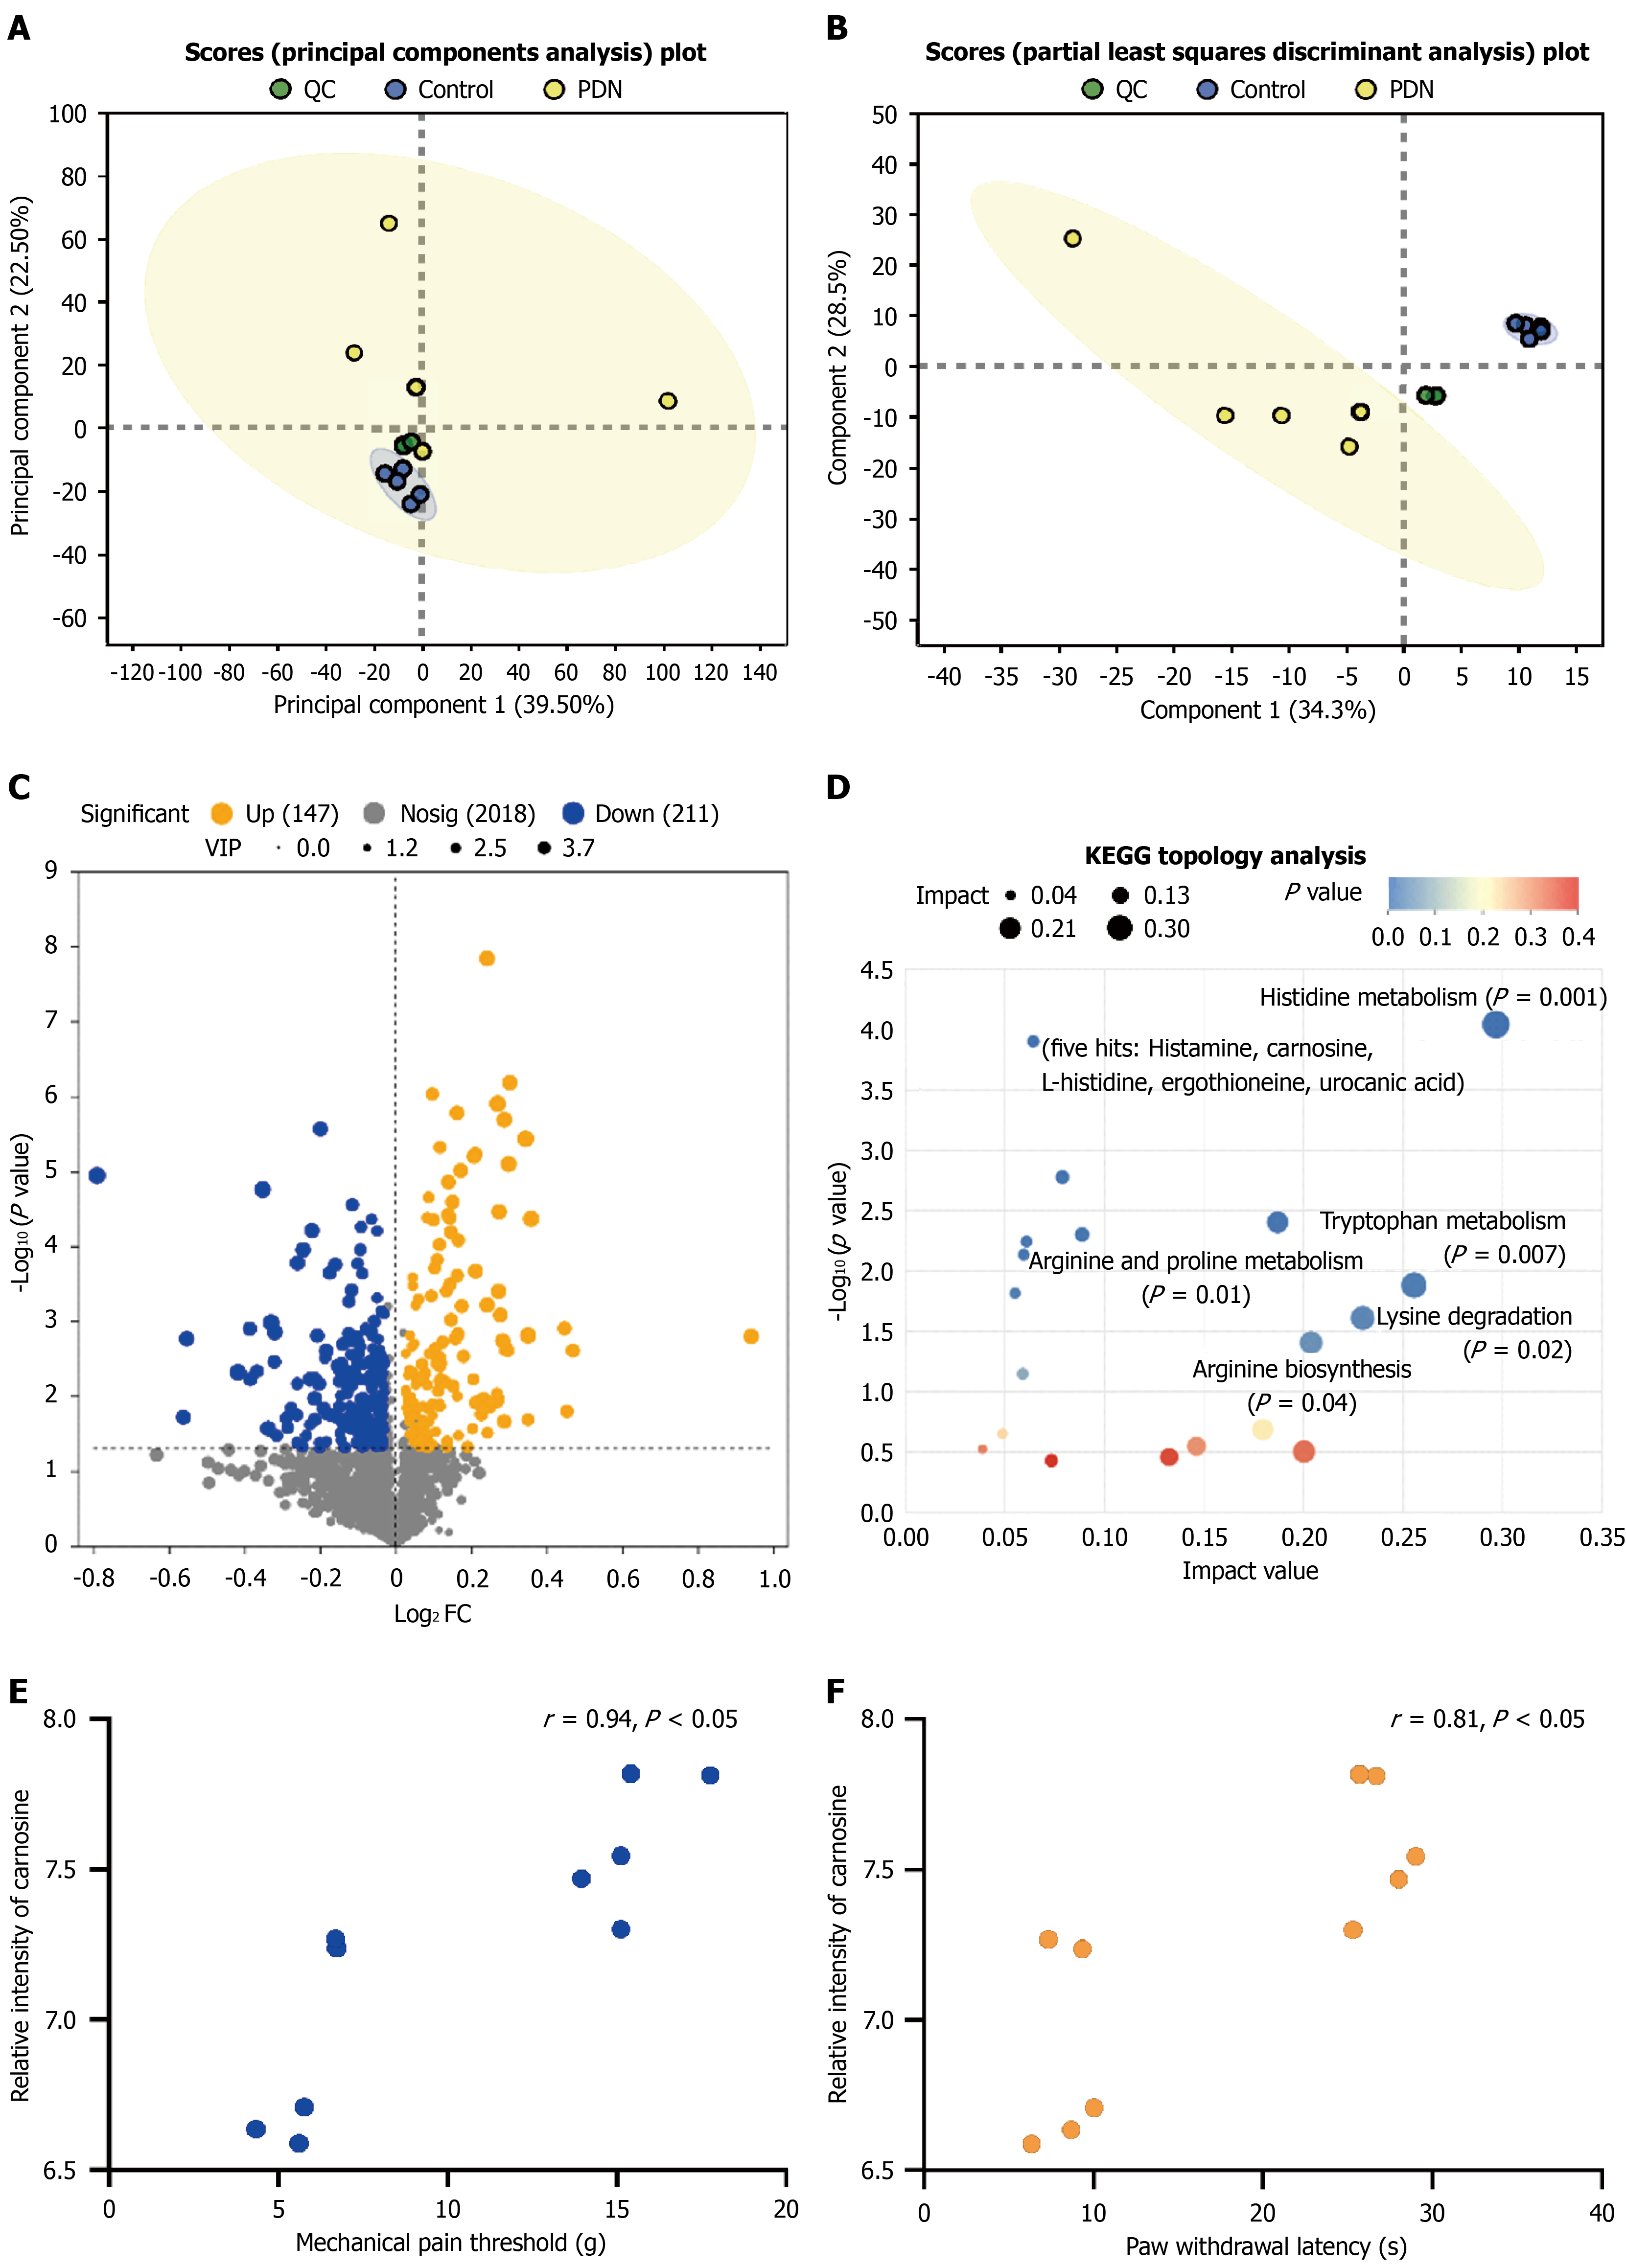
Figure 2 Dorsal root ganglia metabolomic profiling and correlation analyses between carnosine levels and behavioral pain indices, including paw withdrawal threshold and paw withdrawal latency.
A: Principal component analysis; green represents quality control, blue indicates the control group, and yellow represents painful diabetic neuropathy; B: Partial least squares discriminant analysis; green represents quality control, blue indicates the control group, and yellow represents painful diabetic neuropathy; C: Volcano plot of differential metabolites; orange indicates upregulated differential metabolites, blue indicates downregulated differential metabolites, and gray indicates metabolites detected but not significantly different; D: Kyoto Encyclopedia of Genes and Genomes topological analysis, the color gradient represents the significance of pathways arranged by P value (Y-axis, darker red indicates smaller P values), while the size of circles represents pathway impact values (X-axis, larger circles indicate higher pathway impact value scores); pathway enrichment was analyzed using a hypergeometric test, and P values were adjusted for multiple comparisons using the Benjamini-Hochberg method to control the false discovery rate (corrected P < 0.05); E and F: Correlation analysis between carnosine levels and behavioral pain indices, including paw withdrawal threshold and paw withdrawal latency. n = 5 animals per group. QC: Quality control; PDN: Painful diabetic neuropathy; KEGG: Kyoto Encyclopedia of Genes and Genomes.
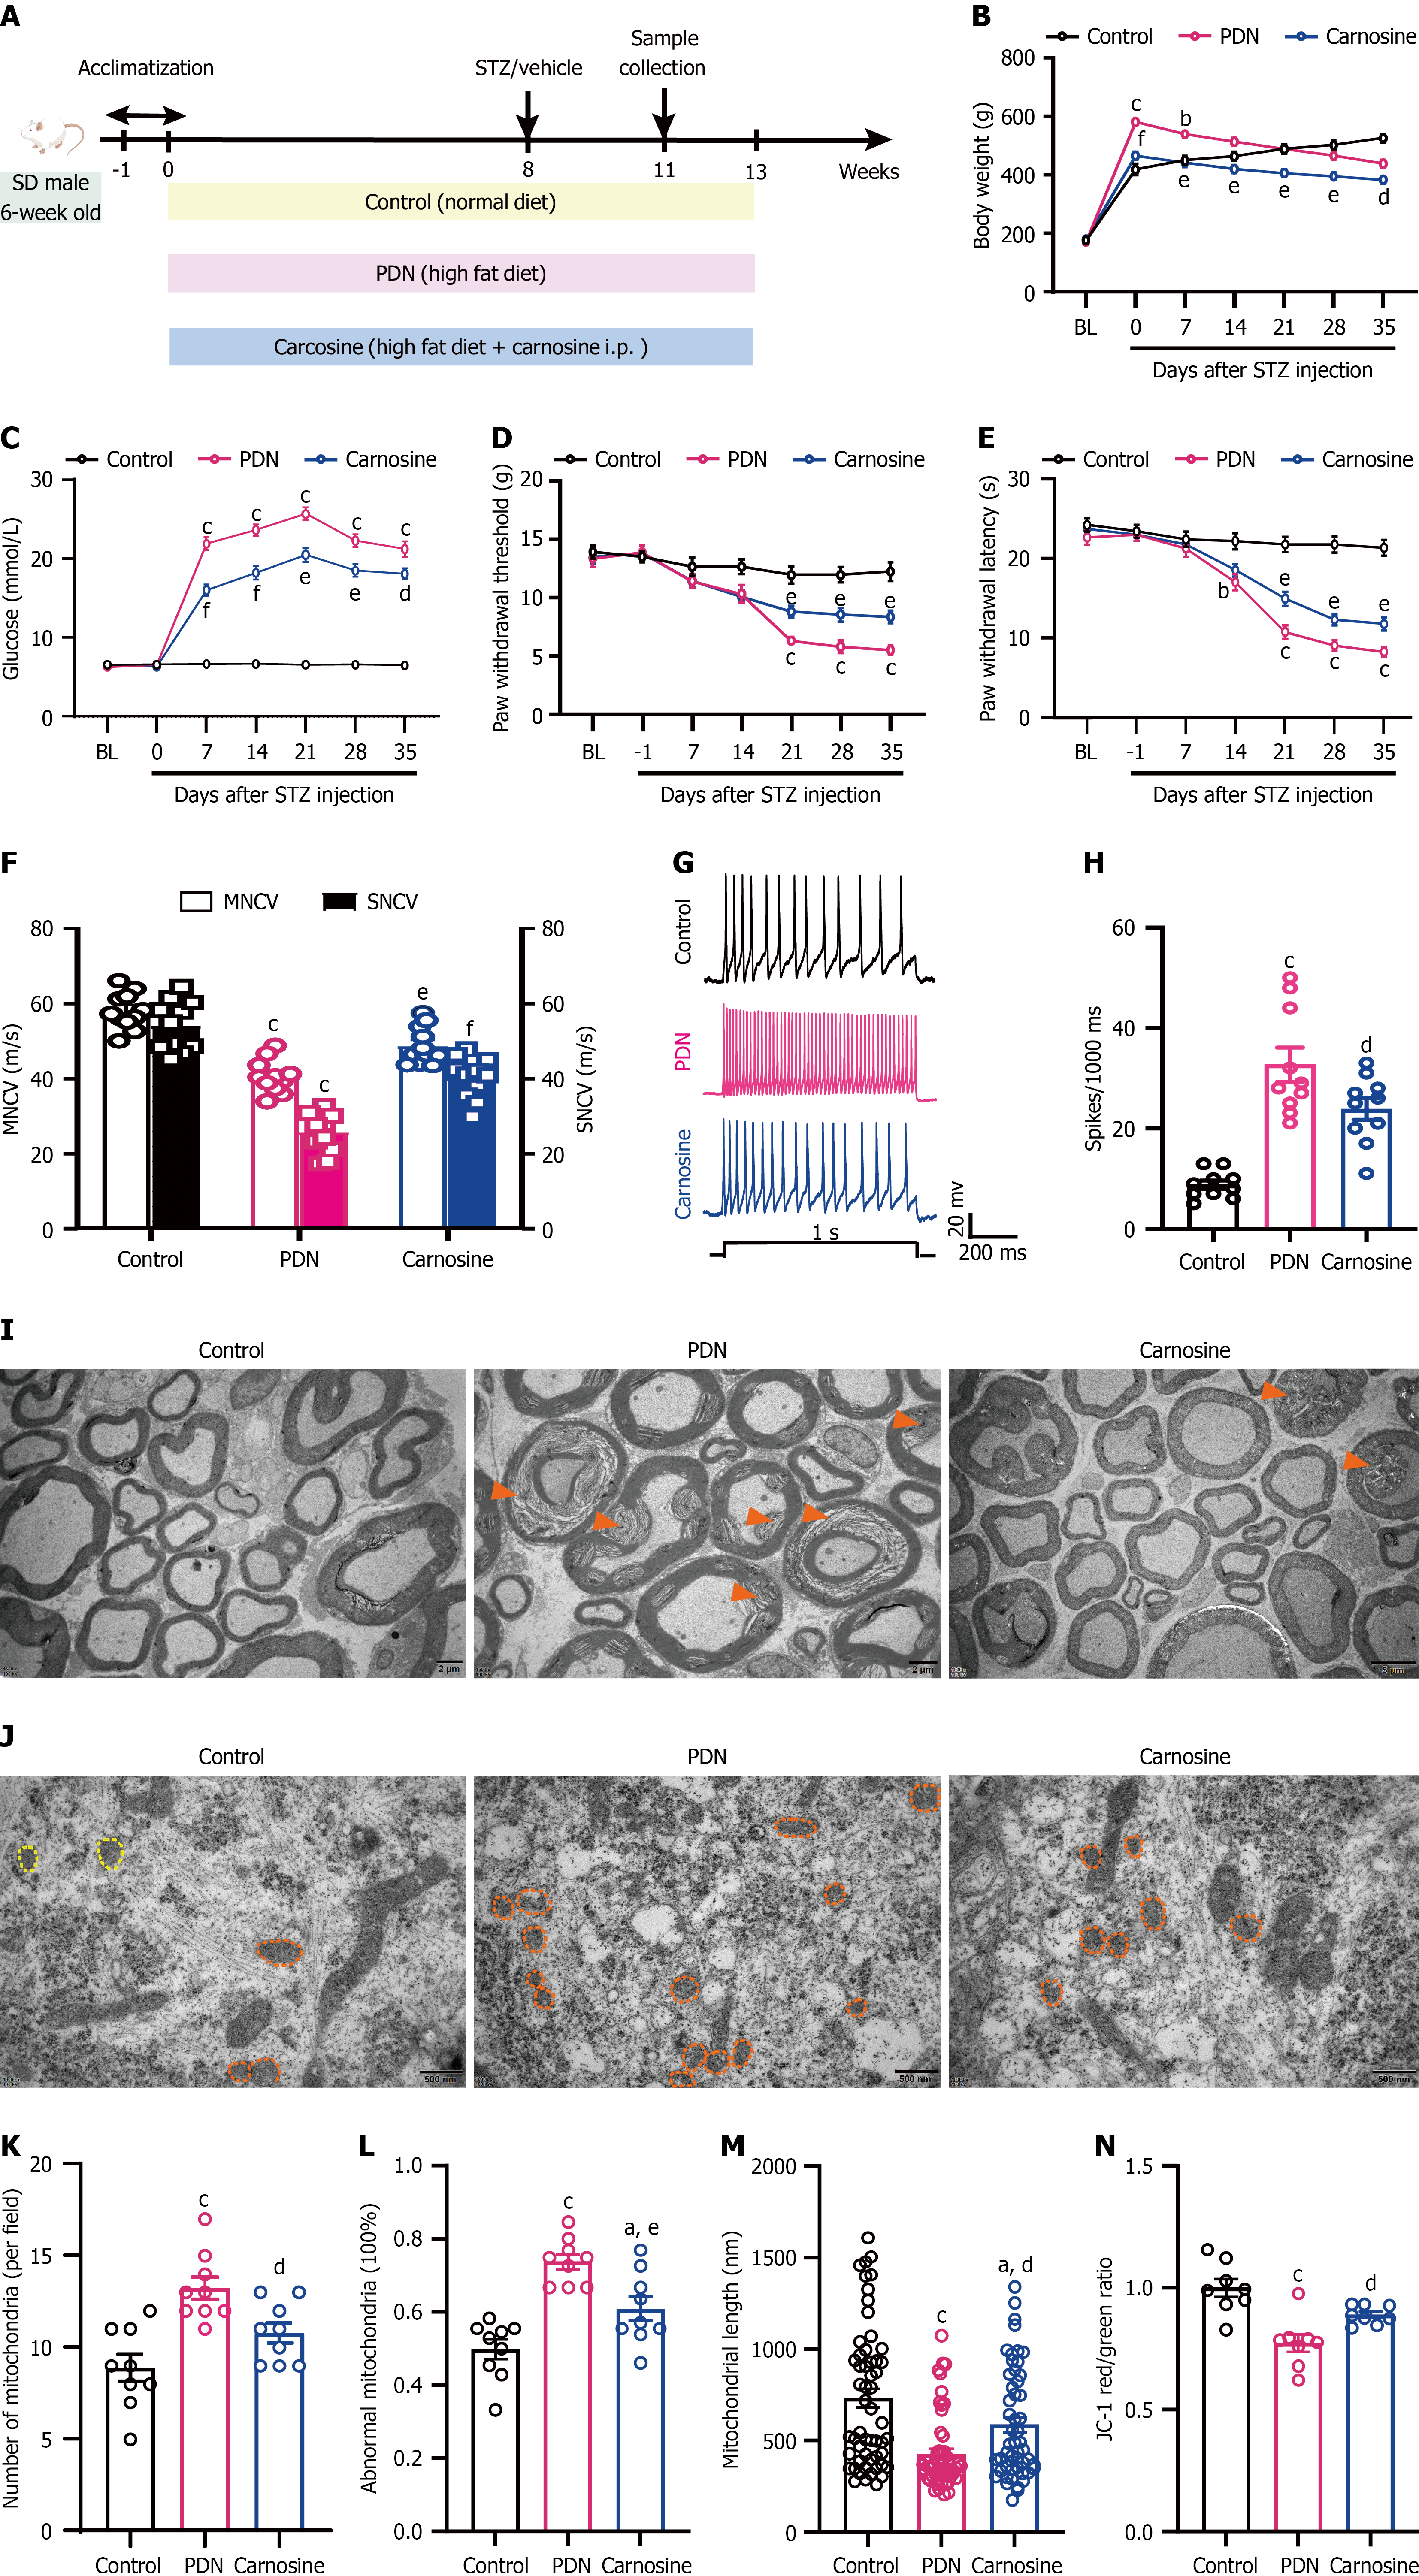
Figure 3 The impact of intraperitoneal injection of carnosine on behavioral, electrophysiological, ultrastructural, and neuronal functional abnormalities in painful diabetic neuropathy rats.
aP < 0.05, bP < 0.01, cP < 0.001 vs the control group; dP < 0.05, eP < 0.01, fP < 0.001 vs the painful diabetic neuropathy group. Two-way analysis of variance with Sidak’s multiple comparisons test for Figure 3B-E. One-way analysis of variance with Tukey’s multiple comparisons test for Figure 3F, H, and N; Linear mixed-effects models were used for statistical analyses of data shown in panels Figure 3K-M, with animal ID designated as the random intercept to account for clustered microscopic observations nested within individual rats. Bonferroni-adjusted pairwise comparisons were performed for intergroup comparisons across the three experimental groups. Figure 3B-F: n = 11; Figure 3G and H: n = 3; Figure 3I-M: n = 3 rats per group, with at least 50 mitochondria counted in 3 random fields per sample. For Figure 3K and L, each field was the statistical unit; for Figure 3M, each individual mitochondrion was the statistical unit for mitochondrial length quantification; Figure 3N: n = 8. A: Flowchart of the experiments; B: Changes in body weight after intraperitoneal carnosine injection; C: Changes in blood glucose level following intraperitoneal carnosine injection; D: Paw withdrawal threshold in rats post-intraperitoneal carnosine injection; E: Paw withdrawal latency in rats post-intraperitoneal carnosine injection; F: Motor nerve conduction velocity and sensory nerve conduction velocity in rats following intraperitoneal carnosine injection; G and H: Results of whole-cell patch-clamp recordings at week 3 after streptozotocin injection; G: Representative traces of neuronal action potential; H: Statistical analysis of the action potential number in dorsal root ganglia (DRG) neurons of rats (n = 3); I: Ultrastructural changes of the DRG post-intraperitoneal carnosine injection. Scale bar = 2 μm; J: Alterations in mitochondrial structure in the DRG post-intraperitoneal carnosine injection. Scale bar = 500 nm; K: The number of mitochondria per field; L: Proportion of abnormal mitochondria relative to the total mitochondrial count; M: Mitochondrial length; N: Changes in mitochondrial membrane potential in the DRG following intraperitoneal carnosine injection. PDN: Painful diabetic neuropathy; MNCV: Motor nerve conduction velocity; SNCV: Sensory nerve conduction velocity; STZ: Streptozotocin.
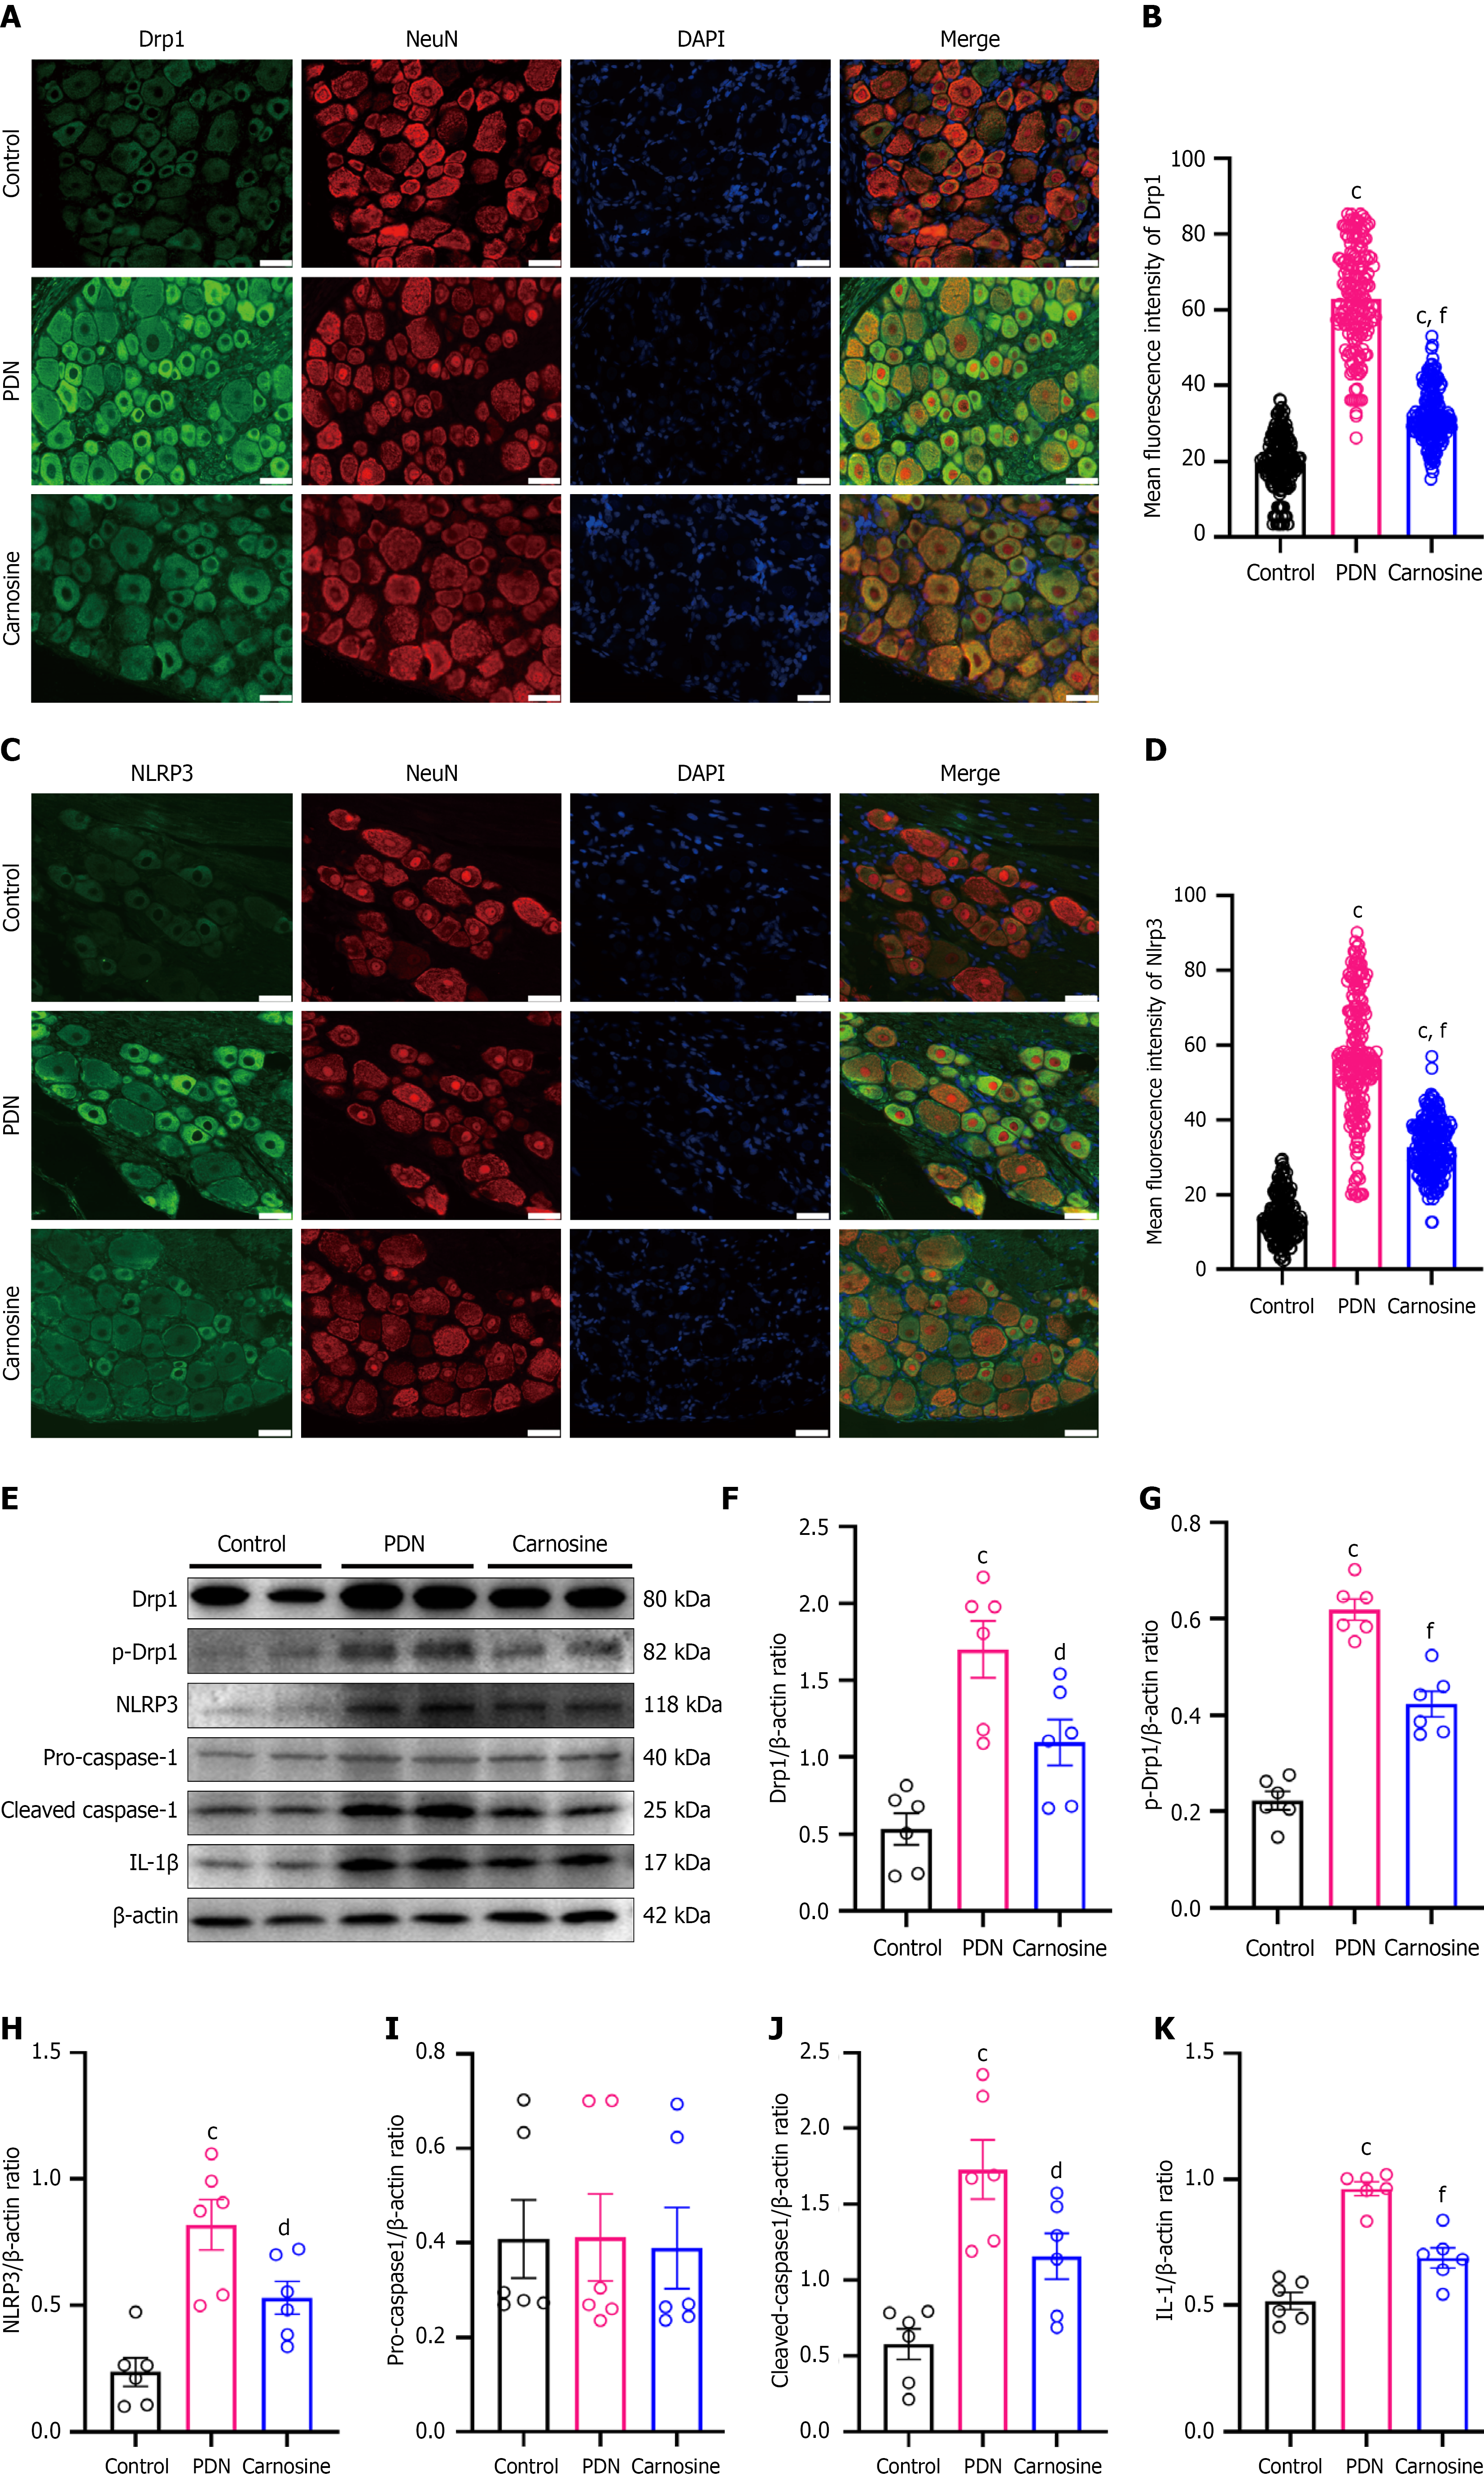
Figure 4 Impact of intraperitoneal carnosine injection on mitochondrial fission and NOD-like receptor pyrin domain-containing protein 3 inflammasome activation in rats with painful diabetic neuropathy.
cP < 0.001 vs the control group; dP < 0.05, fP < 0.001 vs the painful diabetic neuropathy (PDN) group; Linear mixed-effects models were used for the analyses in Figure 4B and D, with animal ID included as a random intercept to account for neurons nested within individual rats. Bonferroni-adjusted pairwise comparisons were performed for post hoc analyses. One-way analysis of variance followed by Tukey’s multiple comparisons test was used for Figure 4F-K. For Figure 4A-D, n = 3 rats per group. Multiple image fields and neurons were analyzed for each animal. For Figure 4E-K, n = 6 rats per group. A: Representative immunofluorescence images of dynamin-related protein 1 and neuronal marker neuronal nuclear antigen in the dorsal root ganglia (DRG) of control rats, rats with PDN, and carnosine-treated PDN rats. Scale bar = 20 μm; B: Variations in immunofluorescence intensity of dynamin-related protein 1 in DRG neurons among control, PDN, and carnosine-treated PDN rats; C: Representative immunofluorescence images of NOD-like receptor pyrin domain-containing protein 3 (NLRP3) and neuronal marker neuronal nuclear antigen in the DRG of control, PDN, and carnosine-treated PDN rats. Scale bar = 20 μm; D: Changes in immunofluorescence intensity of NLRP3 in DRG neurons among control, PDN, and carnosine-treated PDN rats; E-K: Western blotting indicating the expression levels of proteins associated with mitochondrial fission and NLRP3 inflammasome pathway, including representative electrophoresis bands and relative expression levels. NLRP3: NOD-like receptor pyrin domain-containing protein 3; Drp1: Dynamin-related protein 1; PDN: Painful diabetic neuropathy; DAPI: 4’,6-diamidino-2-phenylindole; NeuN: Neuronal nuclear antigen; IL: Interleukin.
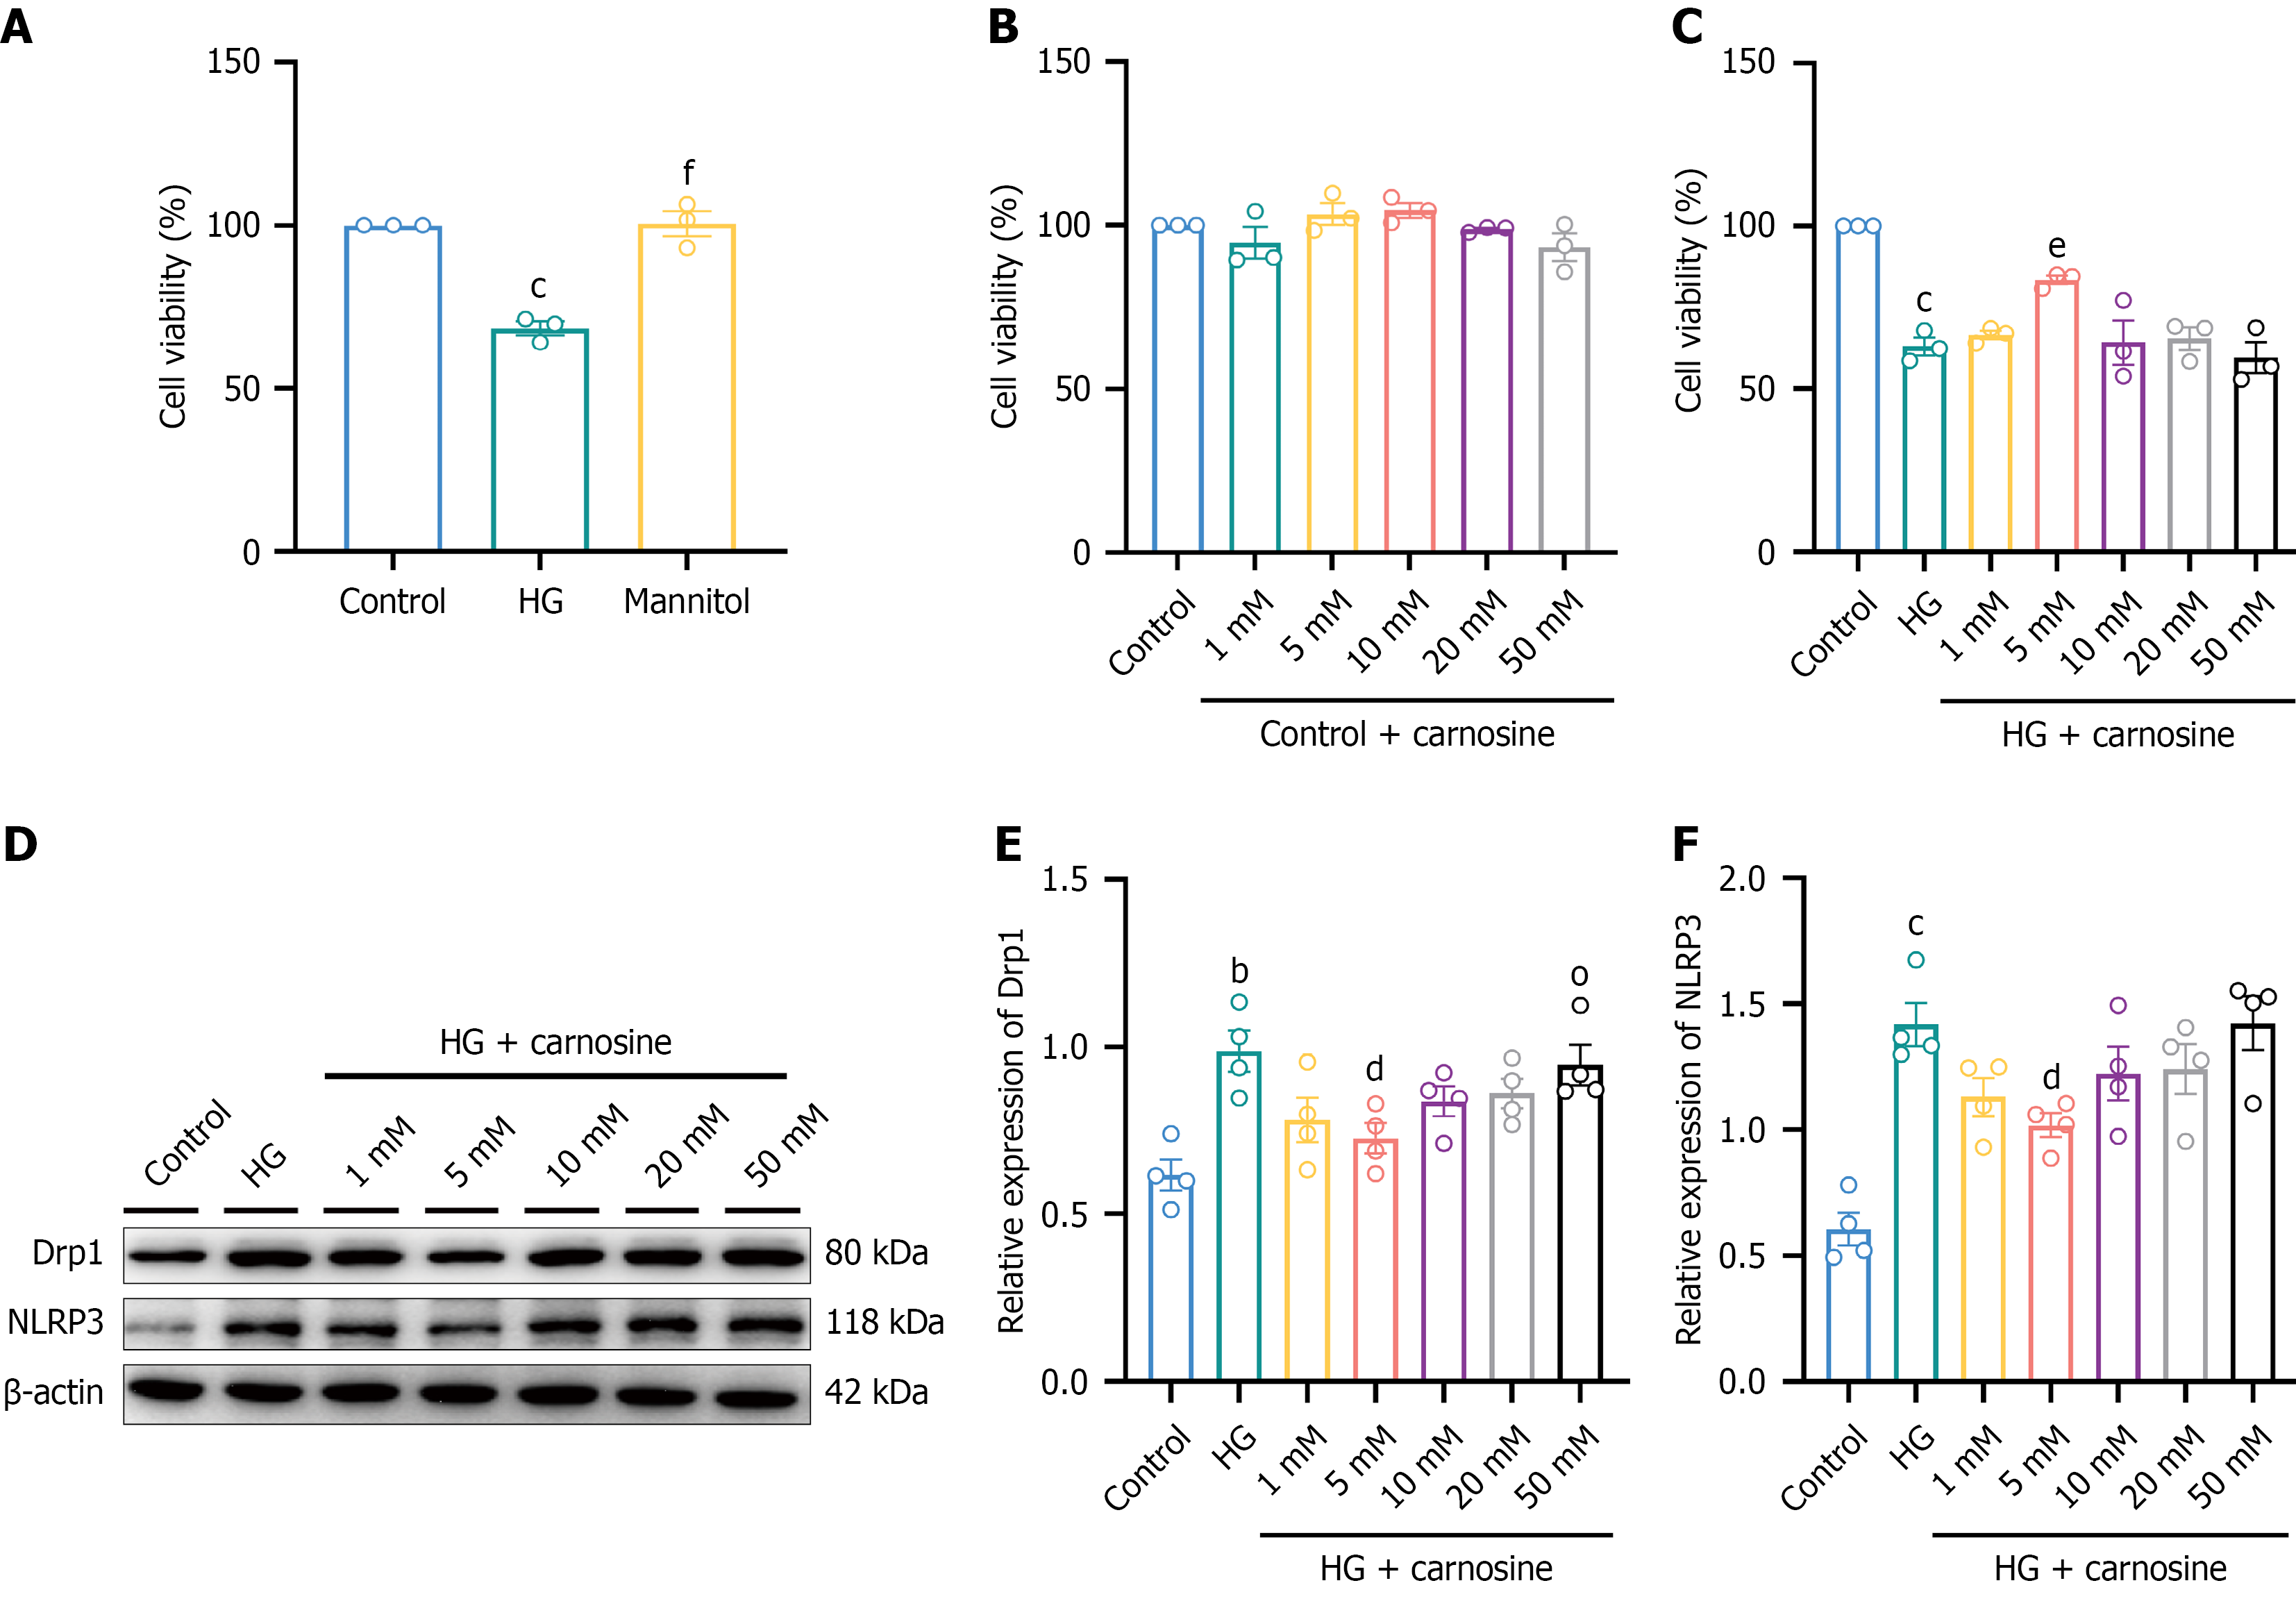
Figure 5 The screening of optimal carnosine concentration in PC12 cells.
bP < 0.01, cP < 0.001 vs the control group; dP < 0.05, eP < 0.01, fP < 0.001 vs the high-glucose (HG) group. One-way analysis of variance with Tukey’s multiple comparisons test for Figure 5A-C, E and F. For Figure 5A-C, n = 3; for Figure 5D-F, n = 4. A: Cell counting kit-8 (CCK-8) assay of viability in PC12 cells treated with HG and mannitol; B: CCK-8 assay of viability in PC12 cells treated with various concentrations of carnosine in a standard culture medium; C: CCK-8 assay of viability in PC12 cells treated with different concentrations of carnosine in a HG culture medium; D-F: Western blotting indicating changes in the expression levels of mitochondrial fission protein dynamin-related protein 1 and NOD-like receptor pyrin domain-containing protein 3 inflammasome in PC12 cells treated with various concentrations of carnosine in a HG culture medium. NLRP3: NOD-like receptor pyrin domain-containing protein 3; Drp1: Dynamin-related protein 1; HG: High-glucose.
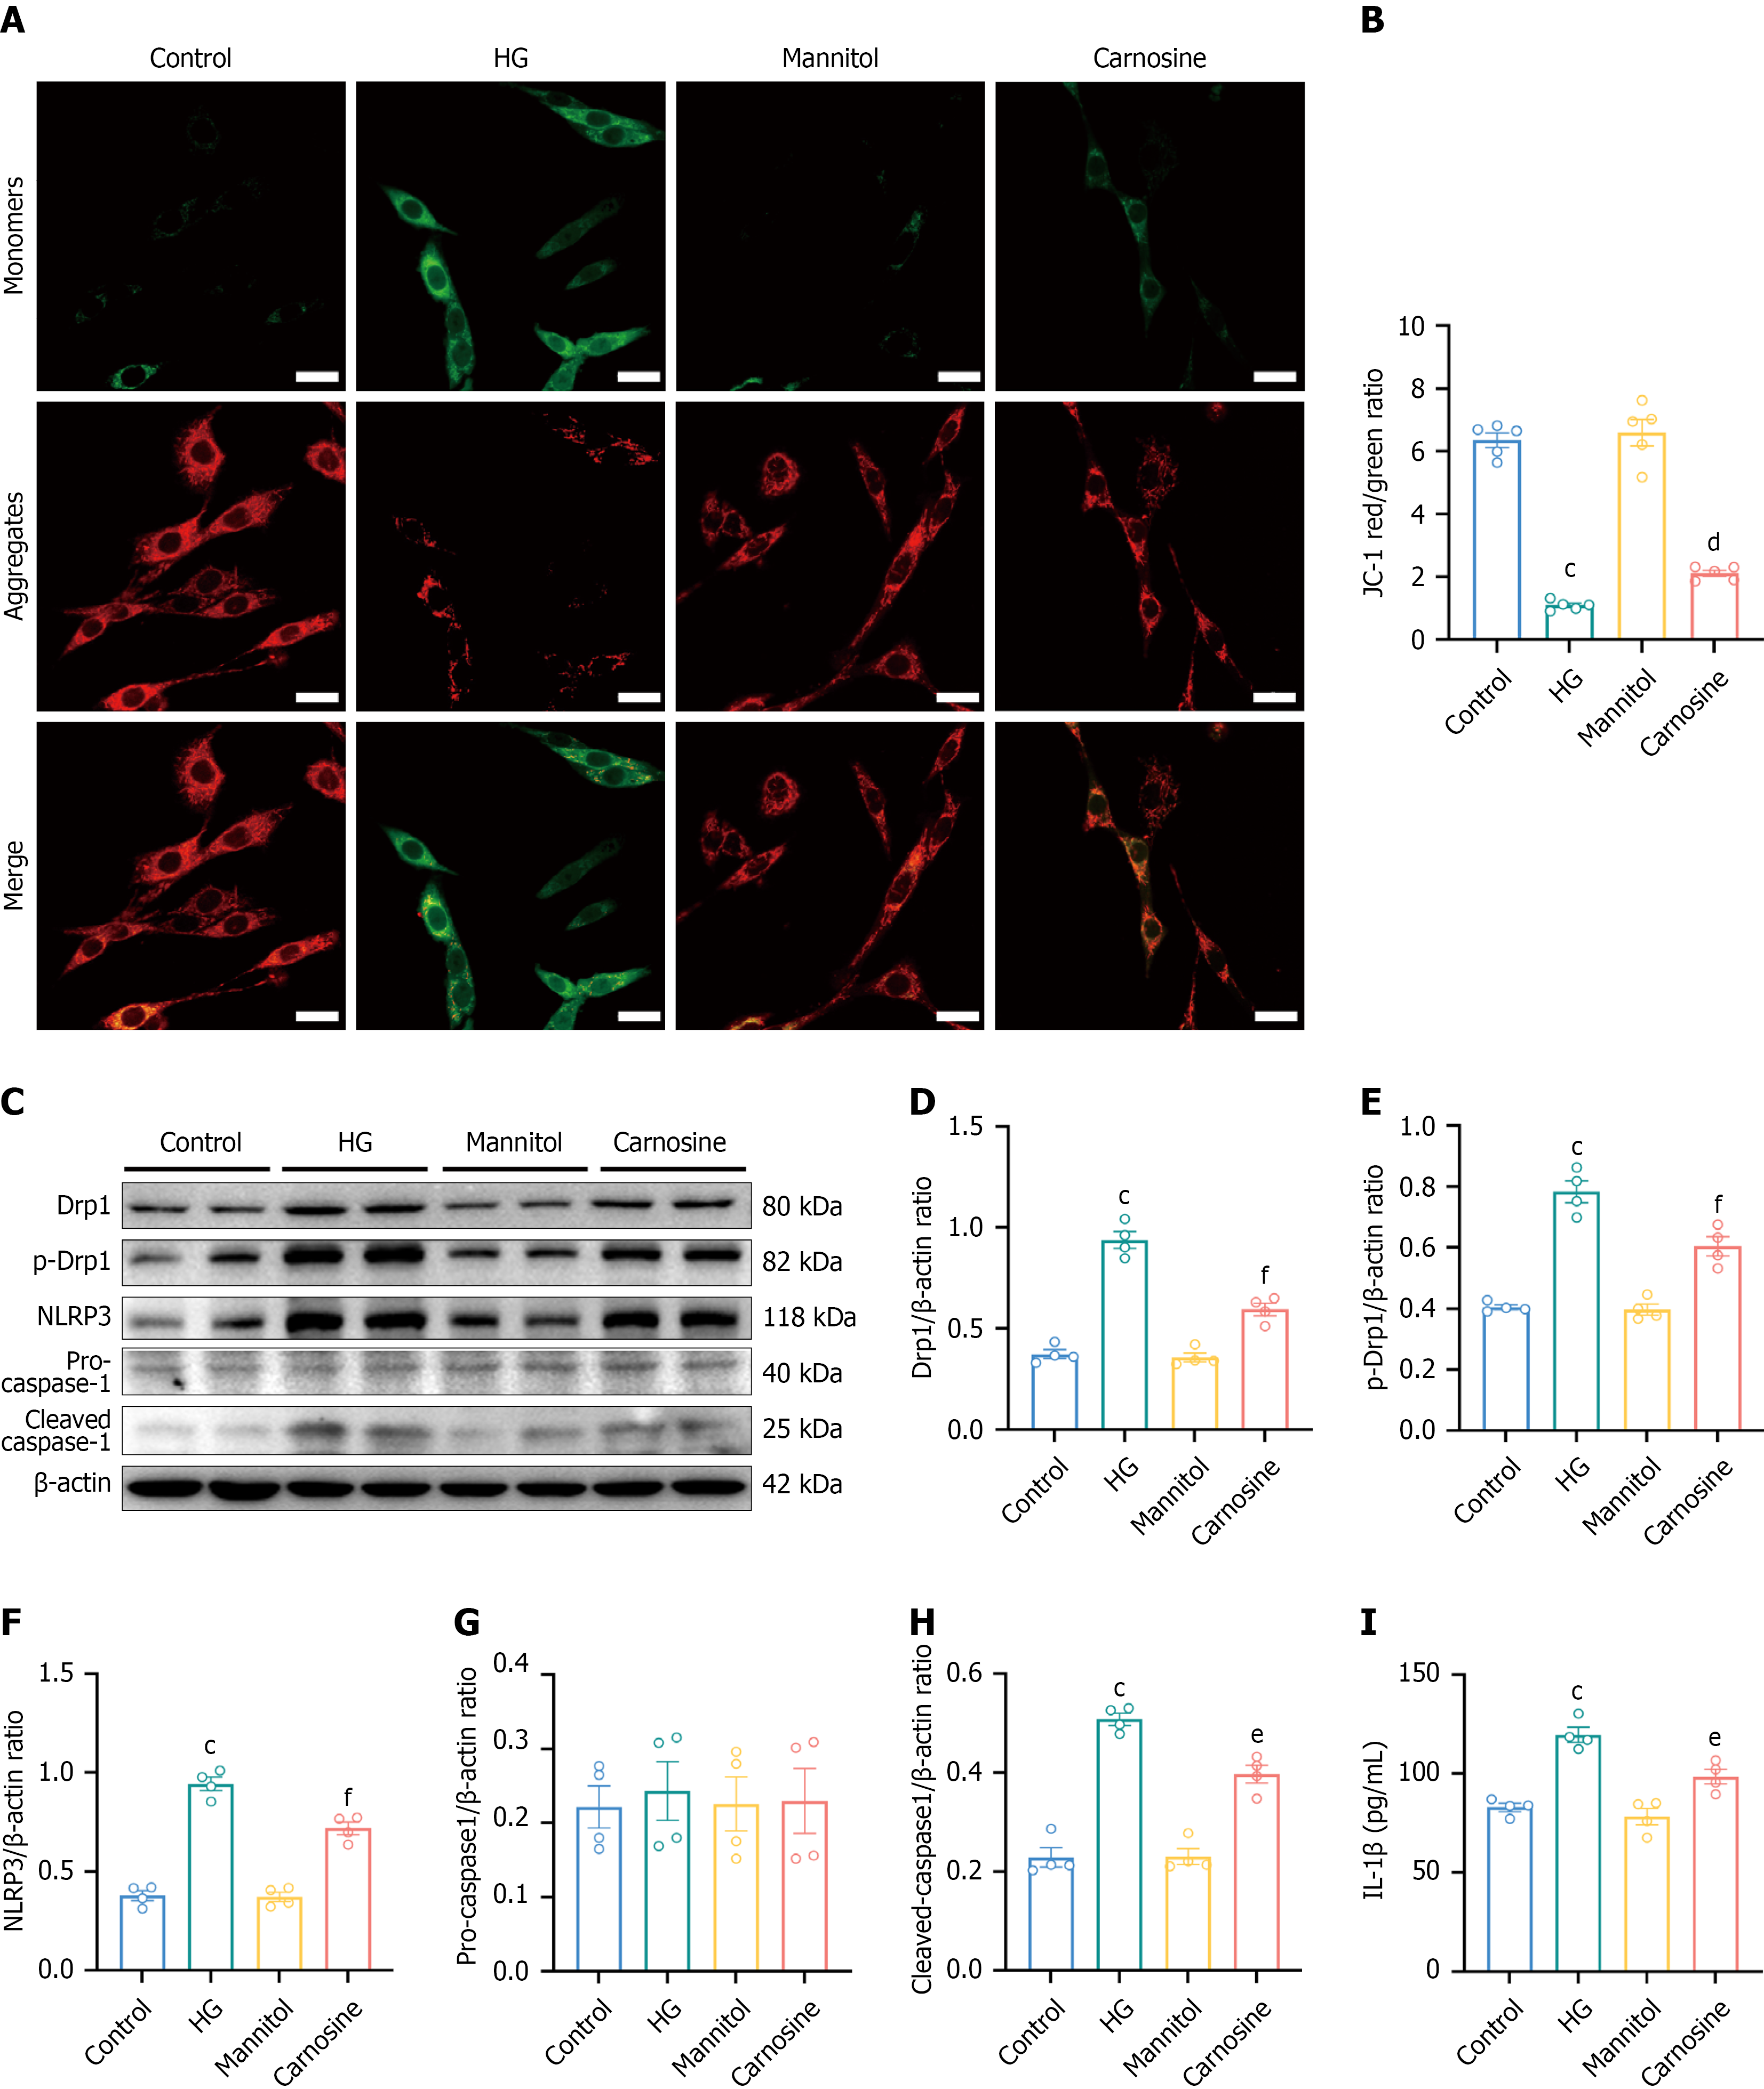
Figure 6 Effects of carnosine intervention on mitochondrial membrane potential, mitochondrial fission, and NOD-like receptor pyrin domain-containing protein 3 inflammasome activation in PC12 cells.
cP < 0.001 vs the control group; dP < 0.05, eP < 0.01, fP < 0.001 vs the high-glucose group. One-way analysis of variance with Tukey’s multiple comparisons test for Figure 6B, D-I. For Figure 6A and B, n = 5; for Figure 6C-I, n = 4. A: Representative fluorescence images of JC-1 monomers/aggregates in PC12 cells. Scale bar = 20 μm; B: Mitochondrial membrane potential level in PC12 cells; C-H: Impact on the expression levels of proteins related to mitochondrial fission and NOD-like receptor pyrin domain-containing protein 3 inflammasome activation in PC12 cells, including representative electrophoresis bands and relative expression levels; I: Enzyme-linked immunosorbent assay showing the effect on interleukin-1β expression level in PC12 cells. NLRP3: NOD-like receptor pyrin domain-containing protein 3; Drp1: Dynamin-related protein 1; HG: High-glucose; IL-1β: Interleukin-1β.
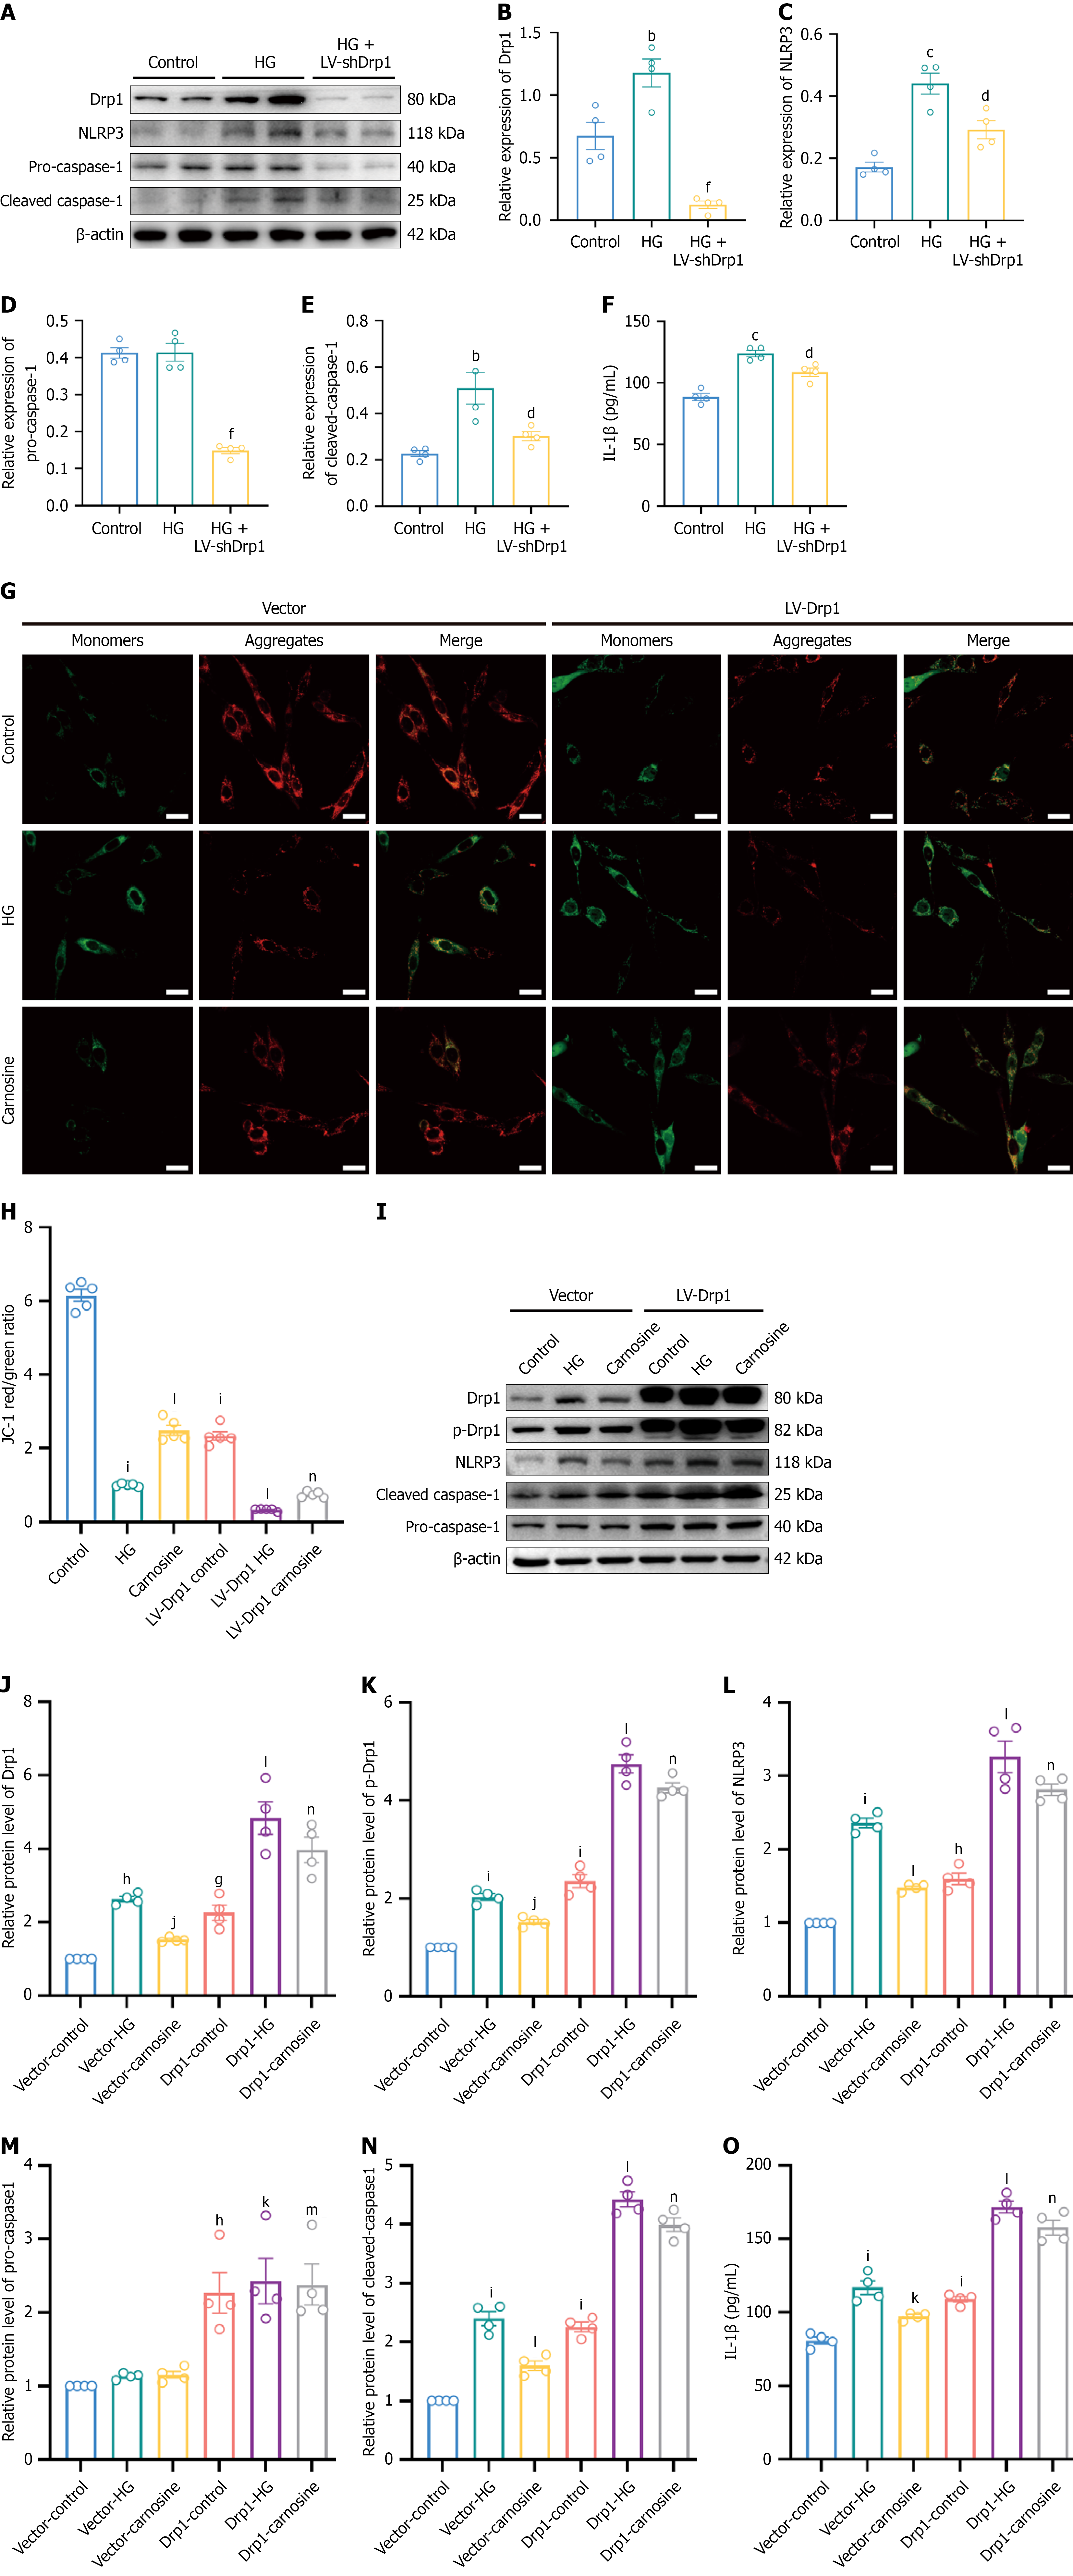
Figure 7 dynamin-related protein 1 knockdown inhibits high glucose-induced NOD-like receptor pyrin domain-containing protein 3 inflammasome activation, whereas dynamin-related protein 1 overexpression attenuates the inhibitory effect of carnosine in PC12 cells.
For Figure 7A-F, bP < 0.01 vs the control group; cP < 0.001 vs the control group; dP < 0.05 vs the high-glucose (HG) group; fP < 0.001 vs the HG group. For panels H-O, gP < 0.05 vs the vector control group, hP < 0.01 compared with the vector control group, iP < 0.001 vs the vector control group; jP < 0.05 vs the vector HG group, kP < 0.01 vs the vector HG group, lP < 0.001 vs the vector HG group; mP < 0.01 vs vector carnosine group, nP < 0.001 vs vector carnosine group. One-way analysis of variance with Tukey’s multiple comparisons test for Figure 7B-F, H, J-O. For Figure 7A-F, I-O, n = 4, G-H, n = 5. A-E: Western blotting of mitochondrial fission and NOD-like receptor pyrin domain-containing protein 3 inflammasome activation-related protein expression following lentivirus-short hairpin RNA targeting dynamin-related protein 1 knockdown, including representative electrophoresis bands and relative expression levels; F: Enzyme-linked immunosorbent assay showing interleukin-1β expression level; G: Representative fluorescence images of JC-1 monomers/aggregates in PC12 cells. Scale bar = 20 μm; H: Mitochondrial membrane potential level in PC12 cells; I-N: Western blotting of mitochondrial fission and NOD-like receptor pyrin domain-containing protein 3 inflammasome activation-related protein expression after lentivirus-dynamin-related protein 1 overexpression, including representative electrophoresis bands and relative expression levels; O: Enzyme-li O: Enzyme-linked immunosorbent assay indicating interleukin-1β expression level in PC12 cells. NLRP3: NOD-like receptor pyrin domain-containing protein 3; Drp1: Dynamin-related protein 1; HG: High-glucose; IL-1β: Interleukin-1β; LV-shDrp1: Lentivirus-short hairpin RNA targeting dynamin-related protein 1.
- Citation: Yu ZY, Yang J, Jiang Y, Han YZ, Wei M, Shou JY, Shen SX, Lyu YH, Li XS, Chen Q, Zhao XR, Xing GG, Ma DQ, Li M. Preventive carnosine supplementation attenuates painful diabetic neuropathy via restoring mitochondrial function and suppressing inflammasome activation. World J Diabetes 2026; 17(10): 123730
- URL: https://www.wjgnet.com/1948-9358/full/v17/i10/123730.htm
- DOI: https://dx.doi.org/10.4239/wjd.123730