Copyright
©The Author(s) 2025.
World J Diabetes. Feb 15, 2025; 16(2): 98438
Published online Feb 15, 2025. doi: 10.4239/wjd.v16.i2.98438
Published online Feb 15, 2025. doi: 10.4239/wjd.v16.i2.98438
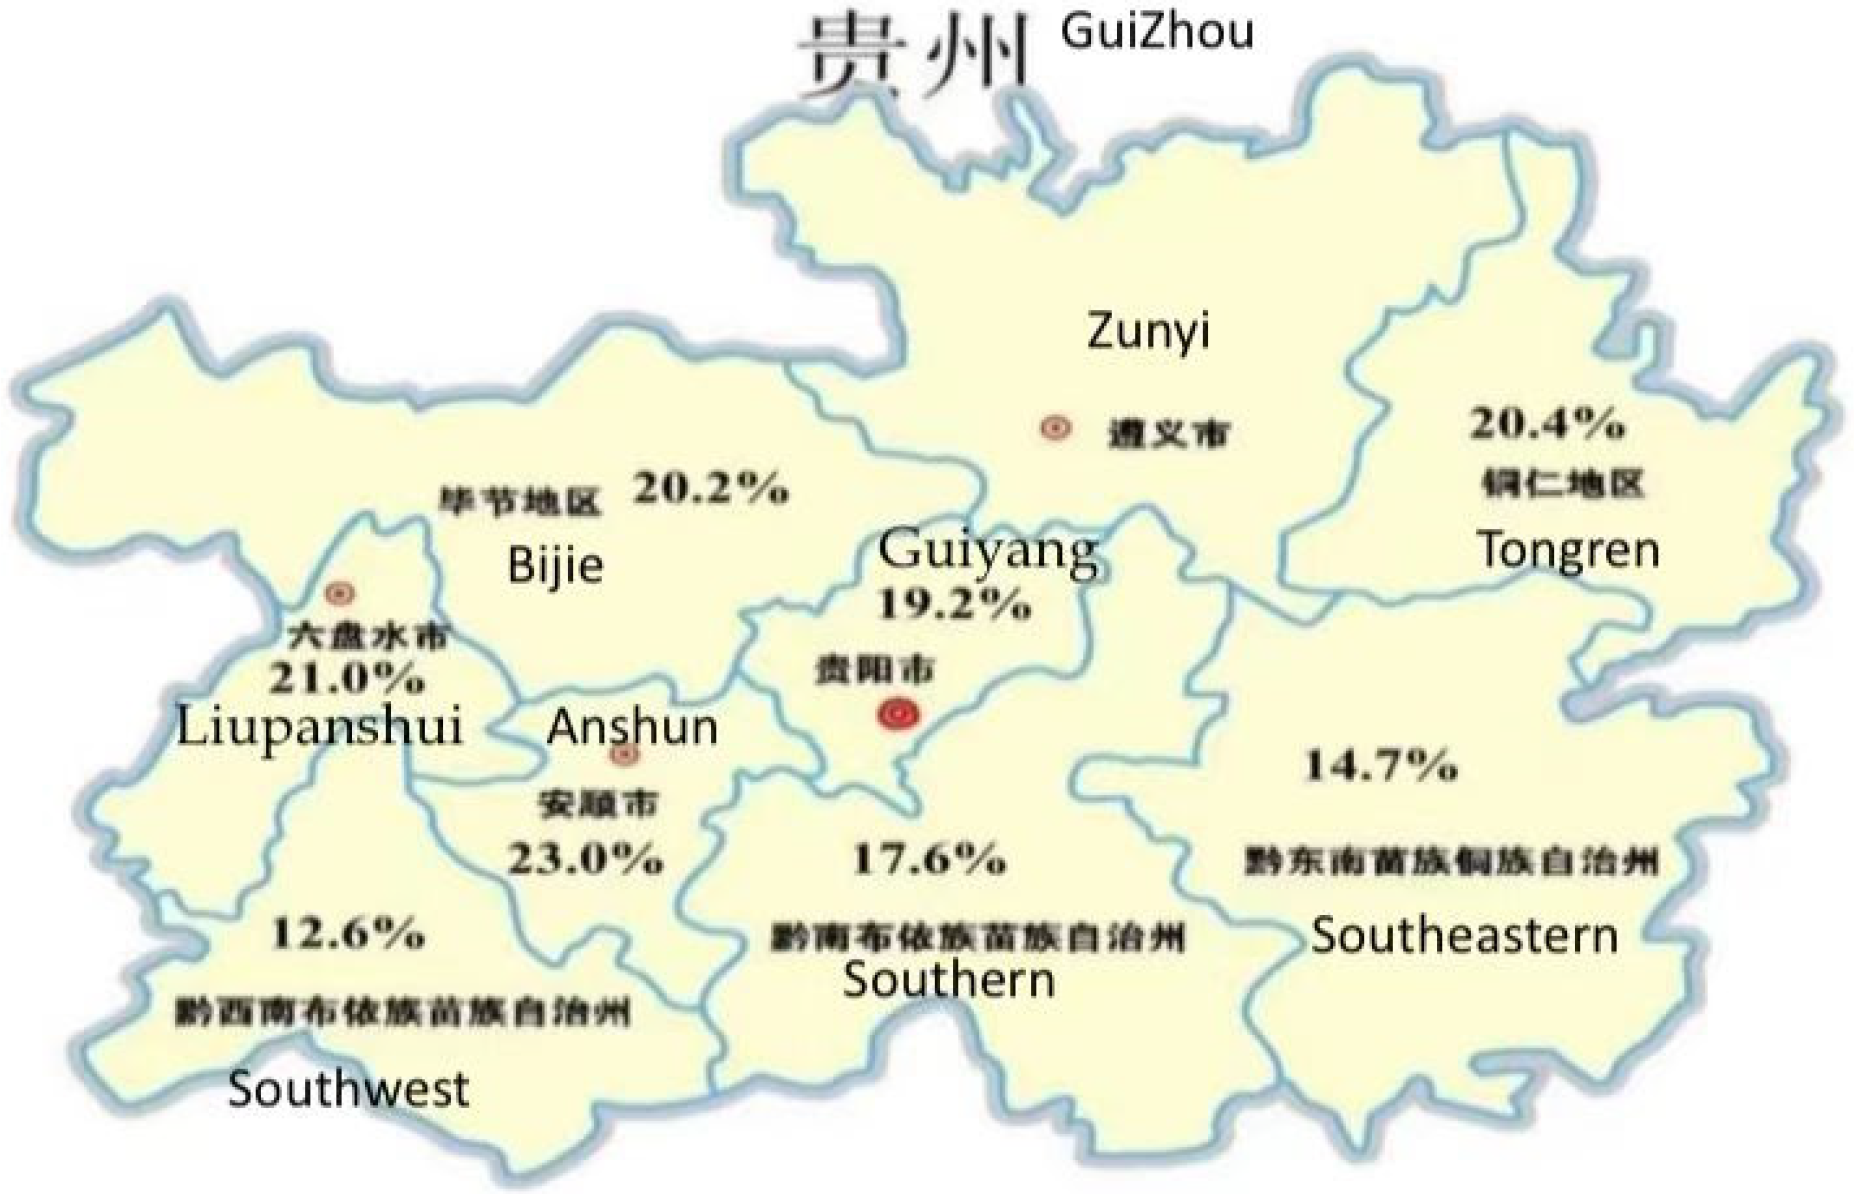
Figure 1 Statistics on the incidence of gestational diabetes mellitus in different regions of Guizhou Province in 2021.
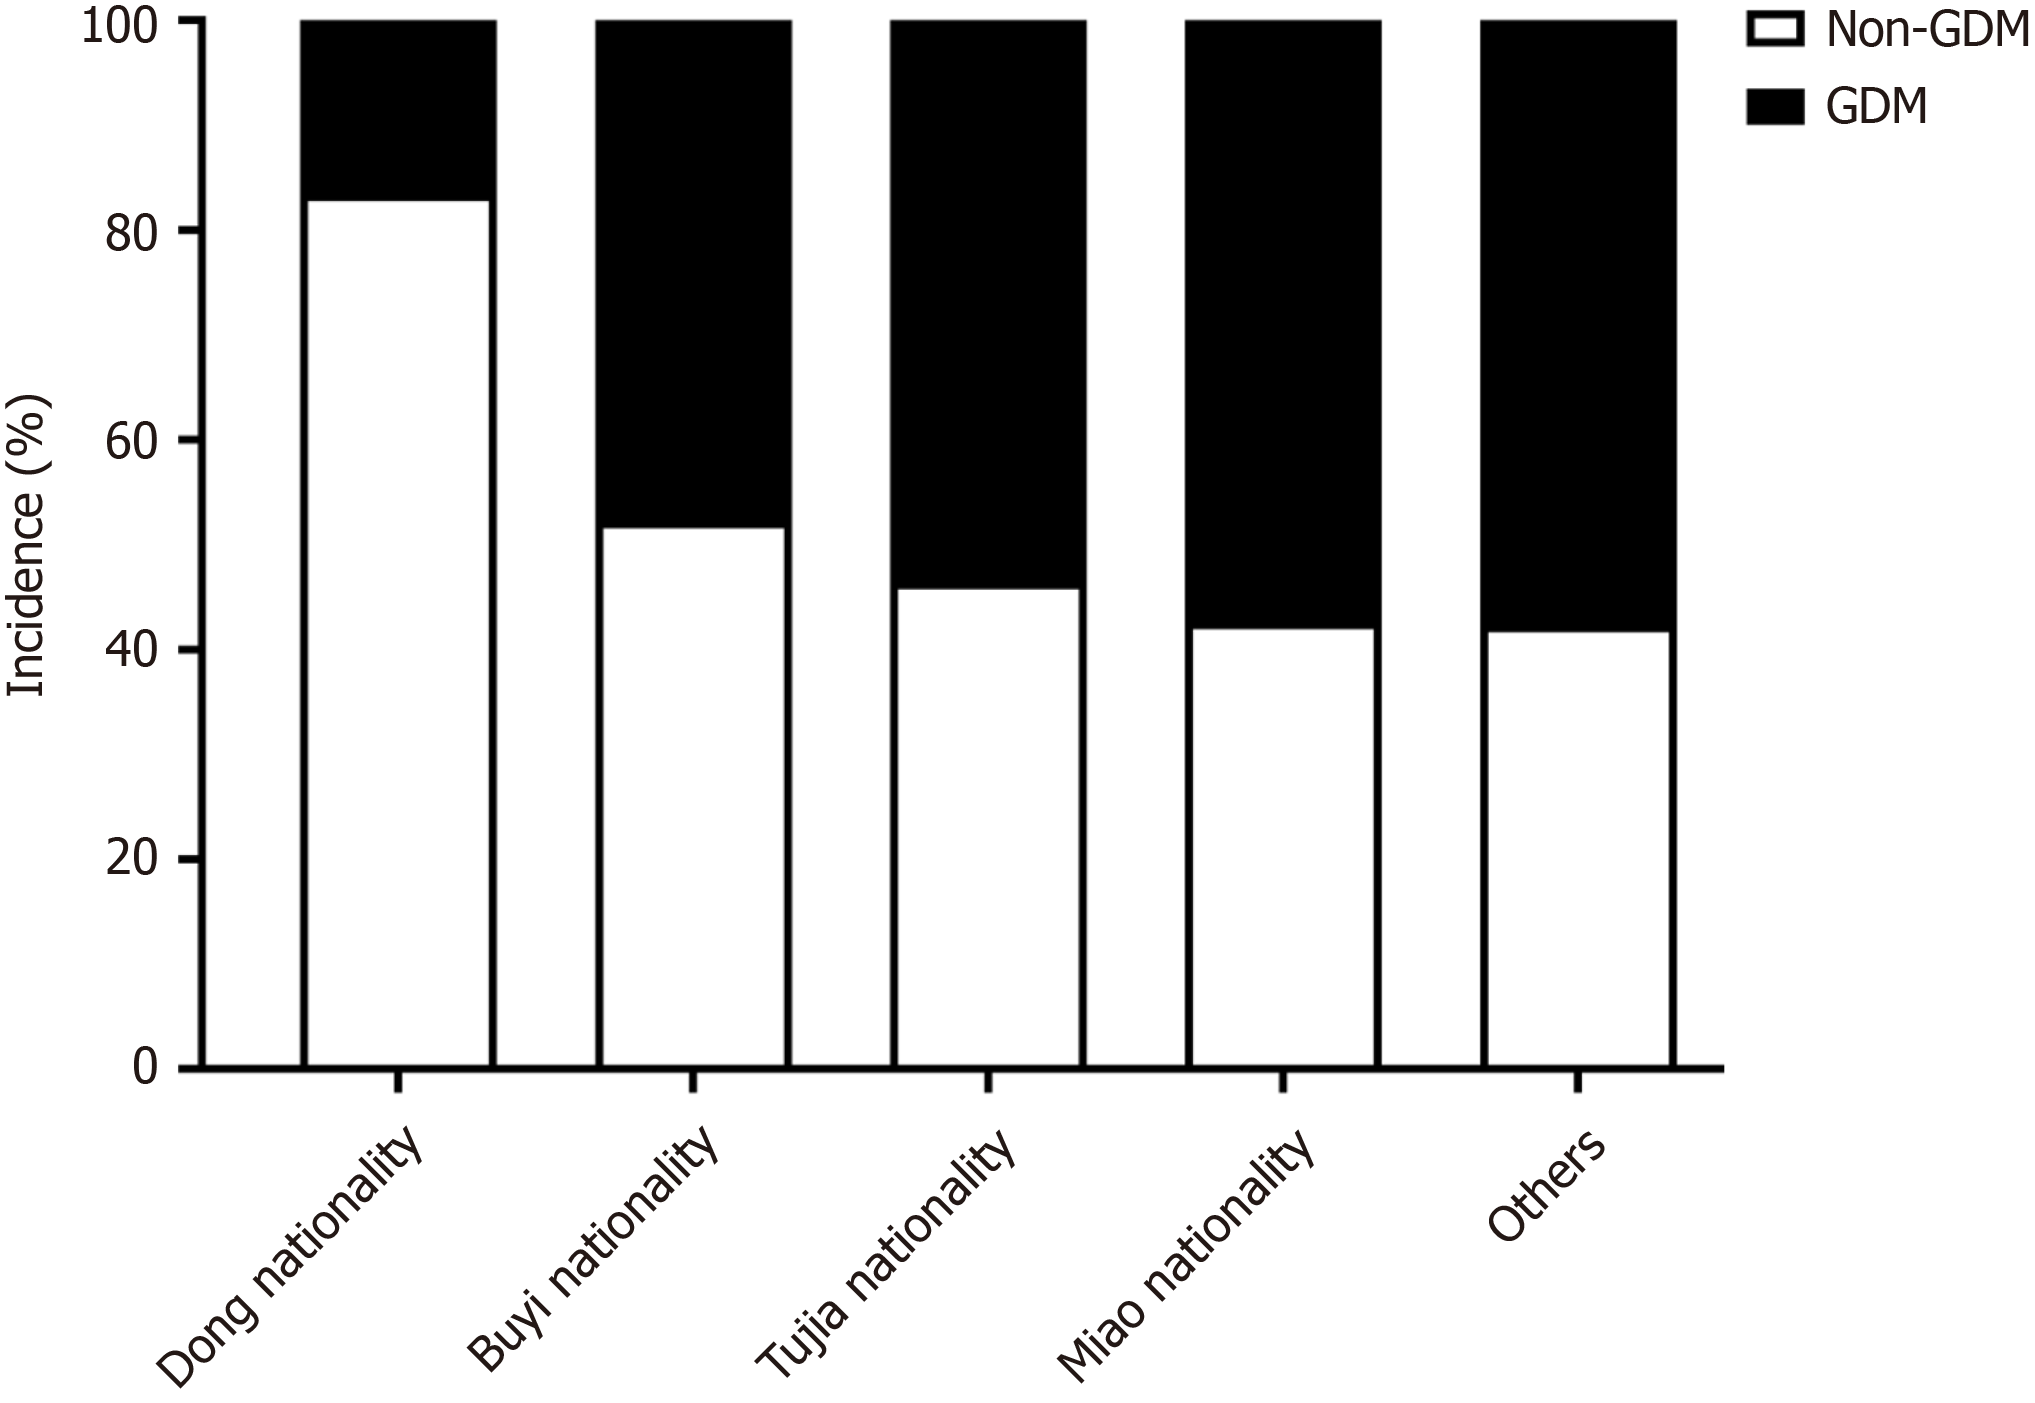
Figure 2 Comparison of the incidence of gestational diabetes among different ethnic minorities in Guizhou.
GDM: Gestational diabetes mellitus.
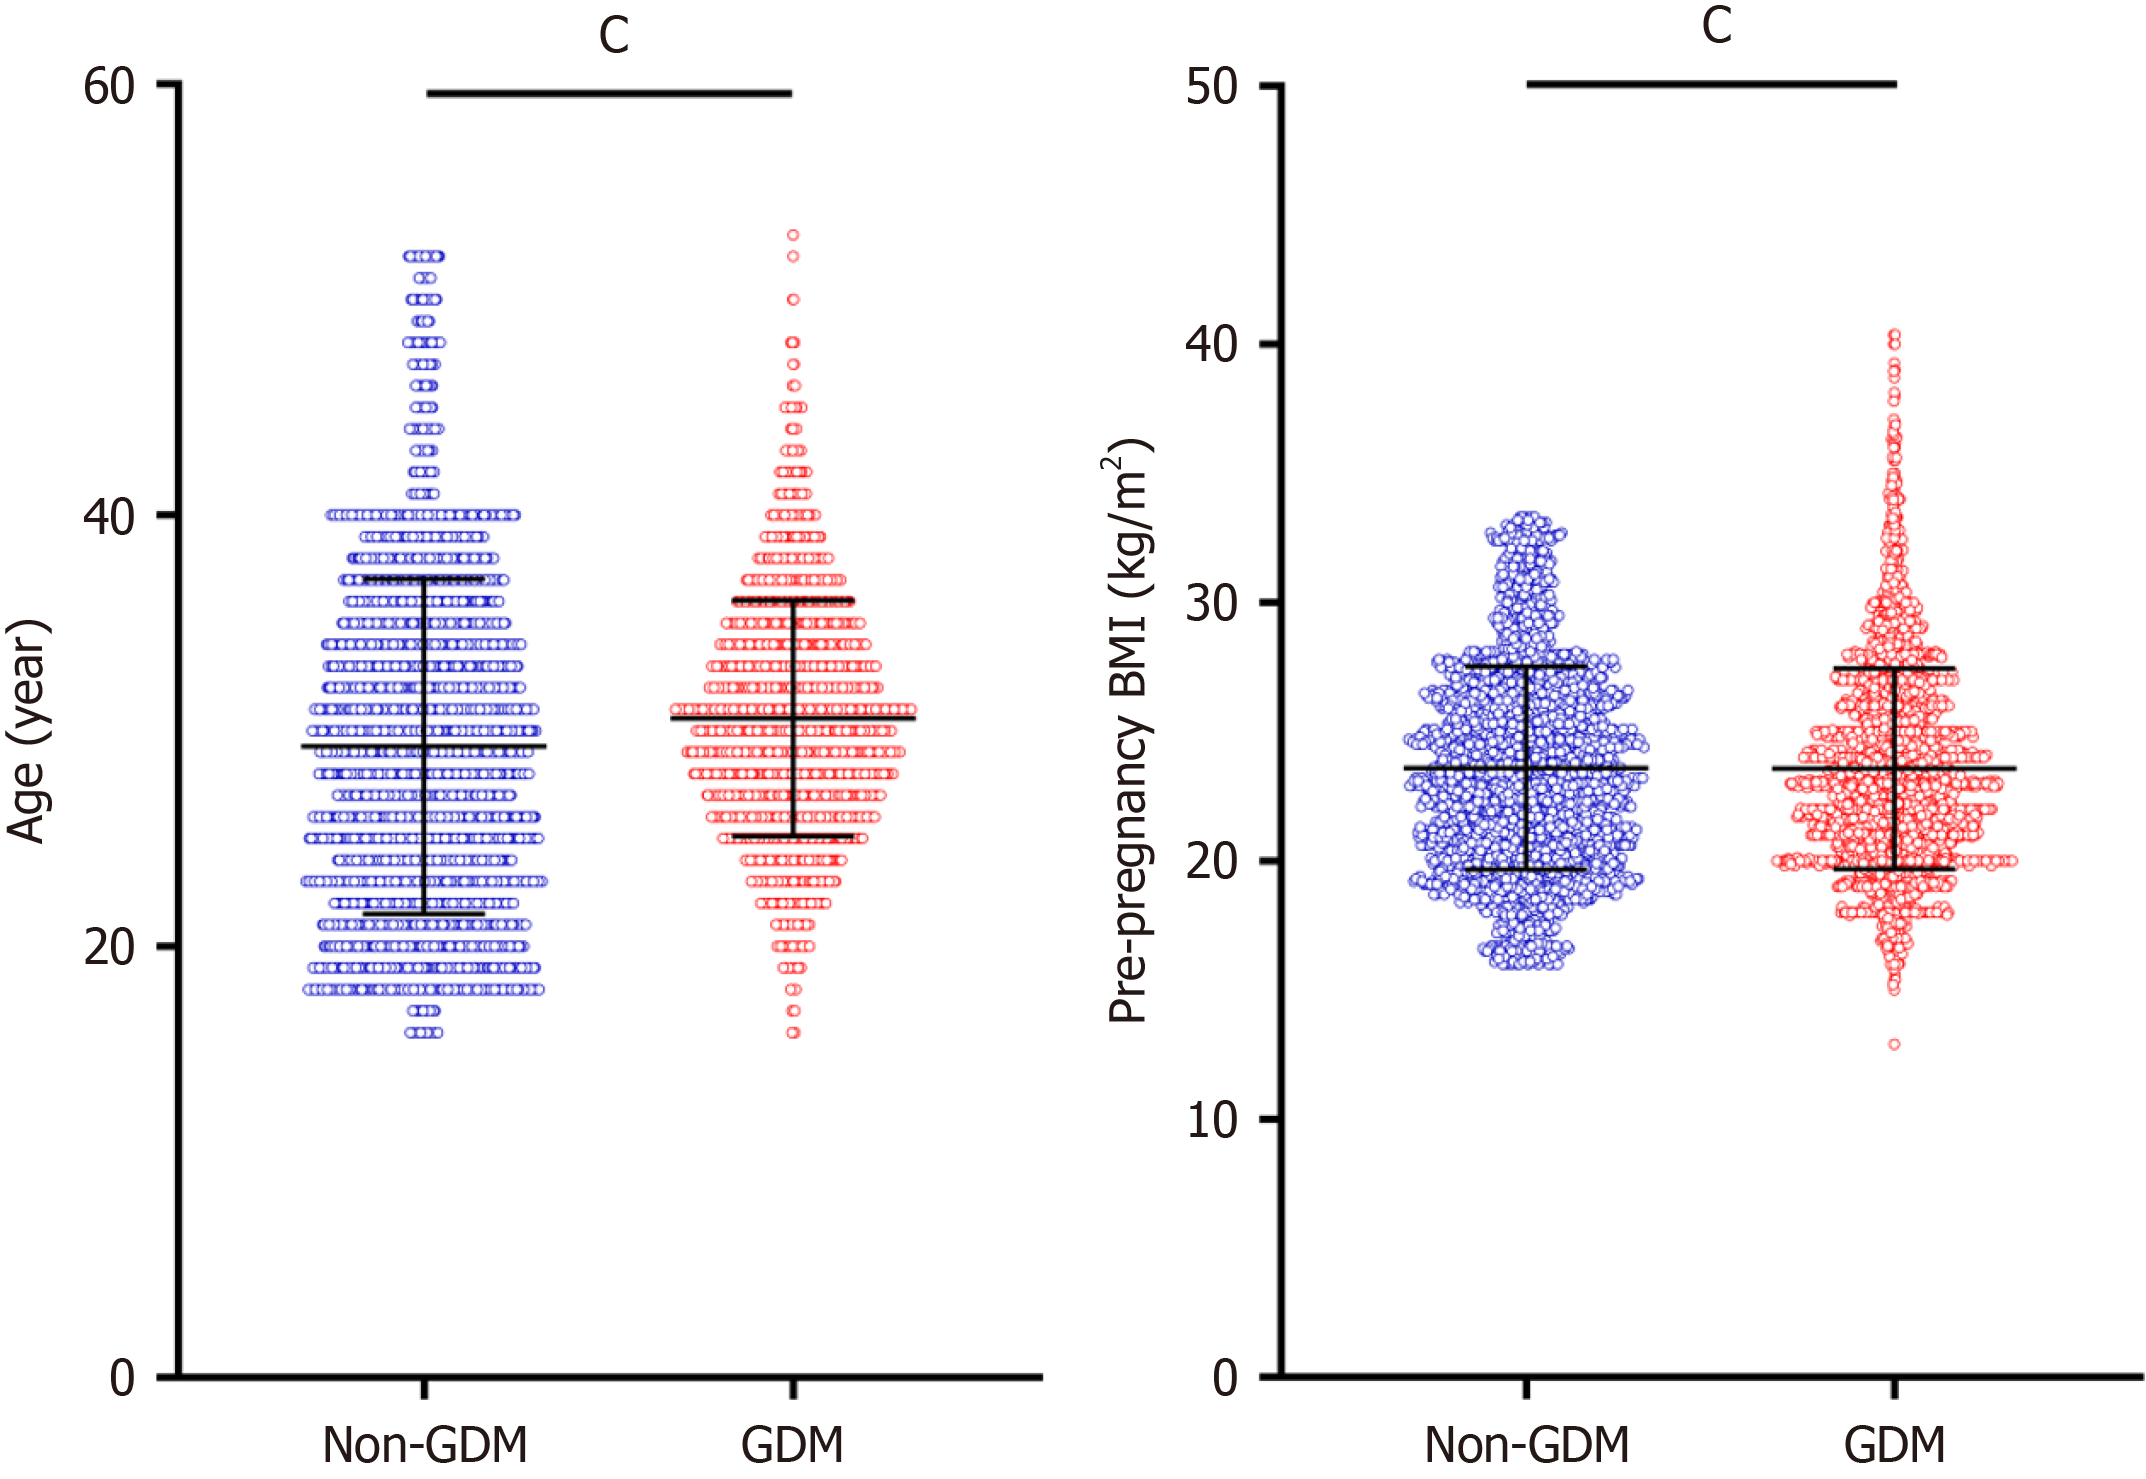
Figure 3 The mean standard deviation of the scattered point of the general data affecting the occurrence of gestational diabetes mellitus.
cP < 0.001. GDM: Gestational diabetes mellitus; BMI: Body mass index.
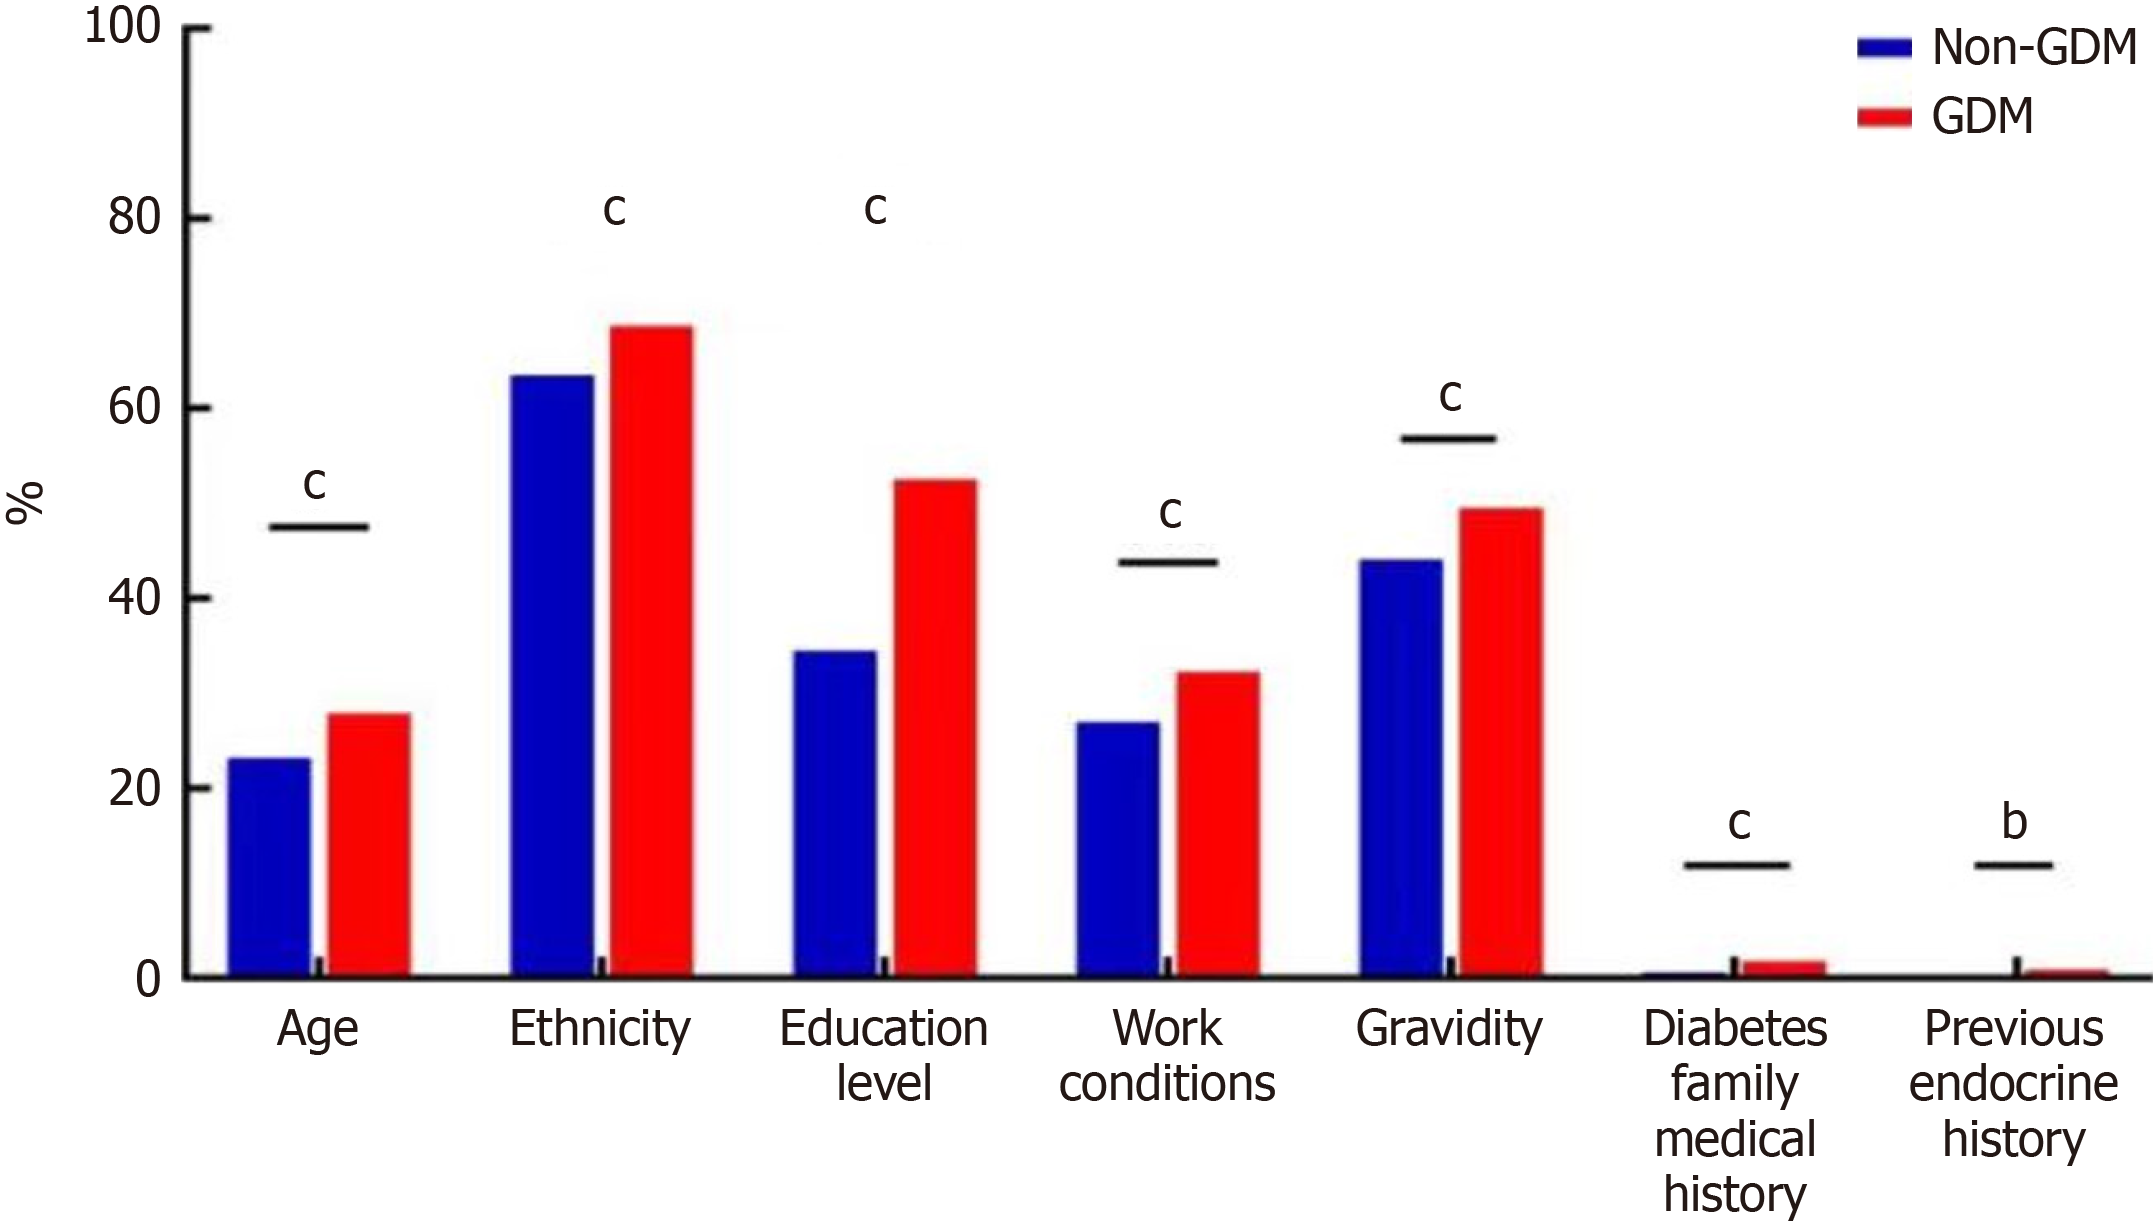
Figure 4 General data bonograms affecting gestational diabetes mellitus.
bP < 0.01. cP < 0.001. GDM: Gestational diabetes mellitus.
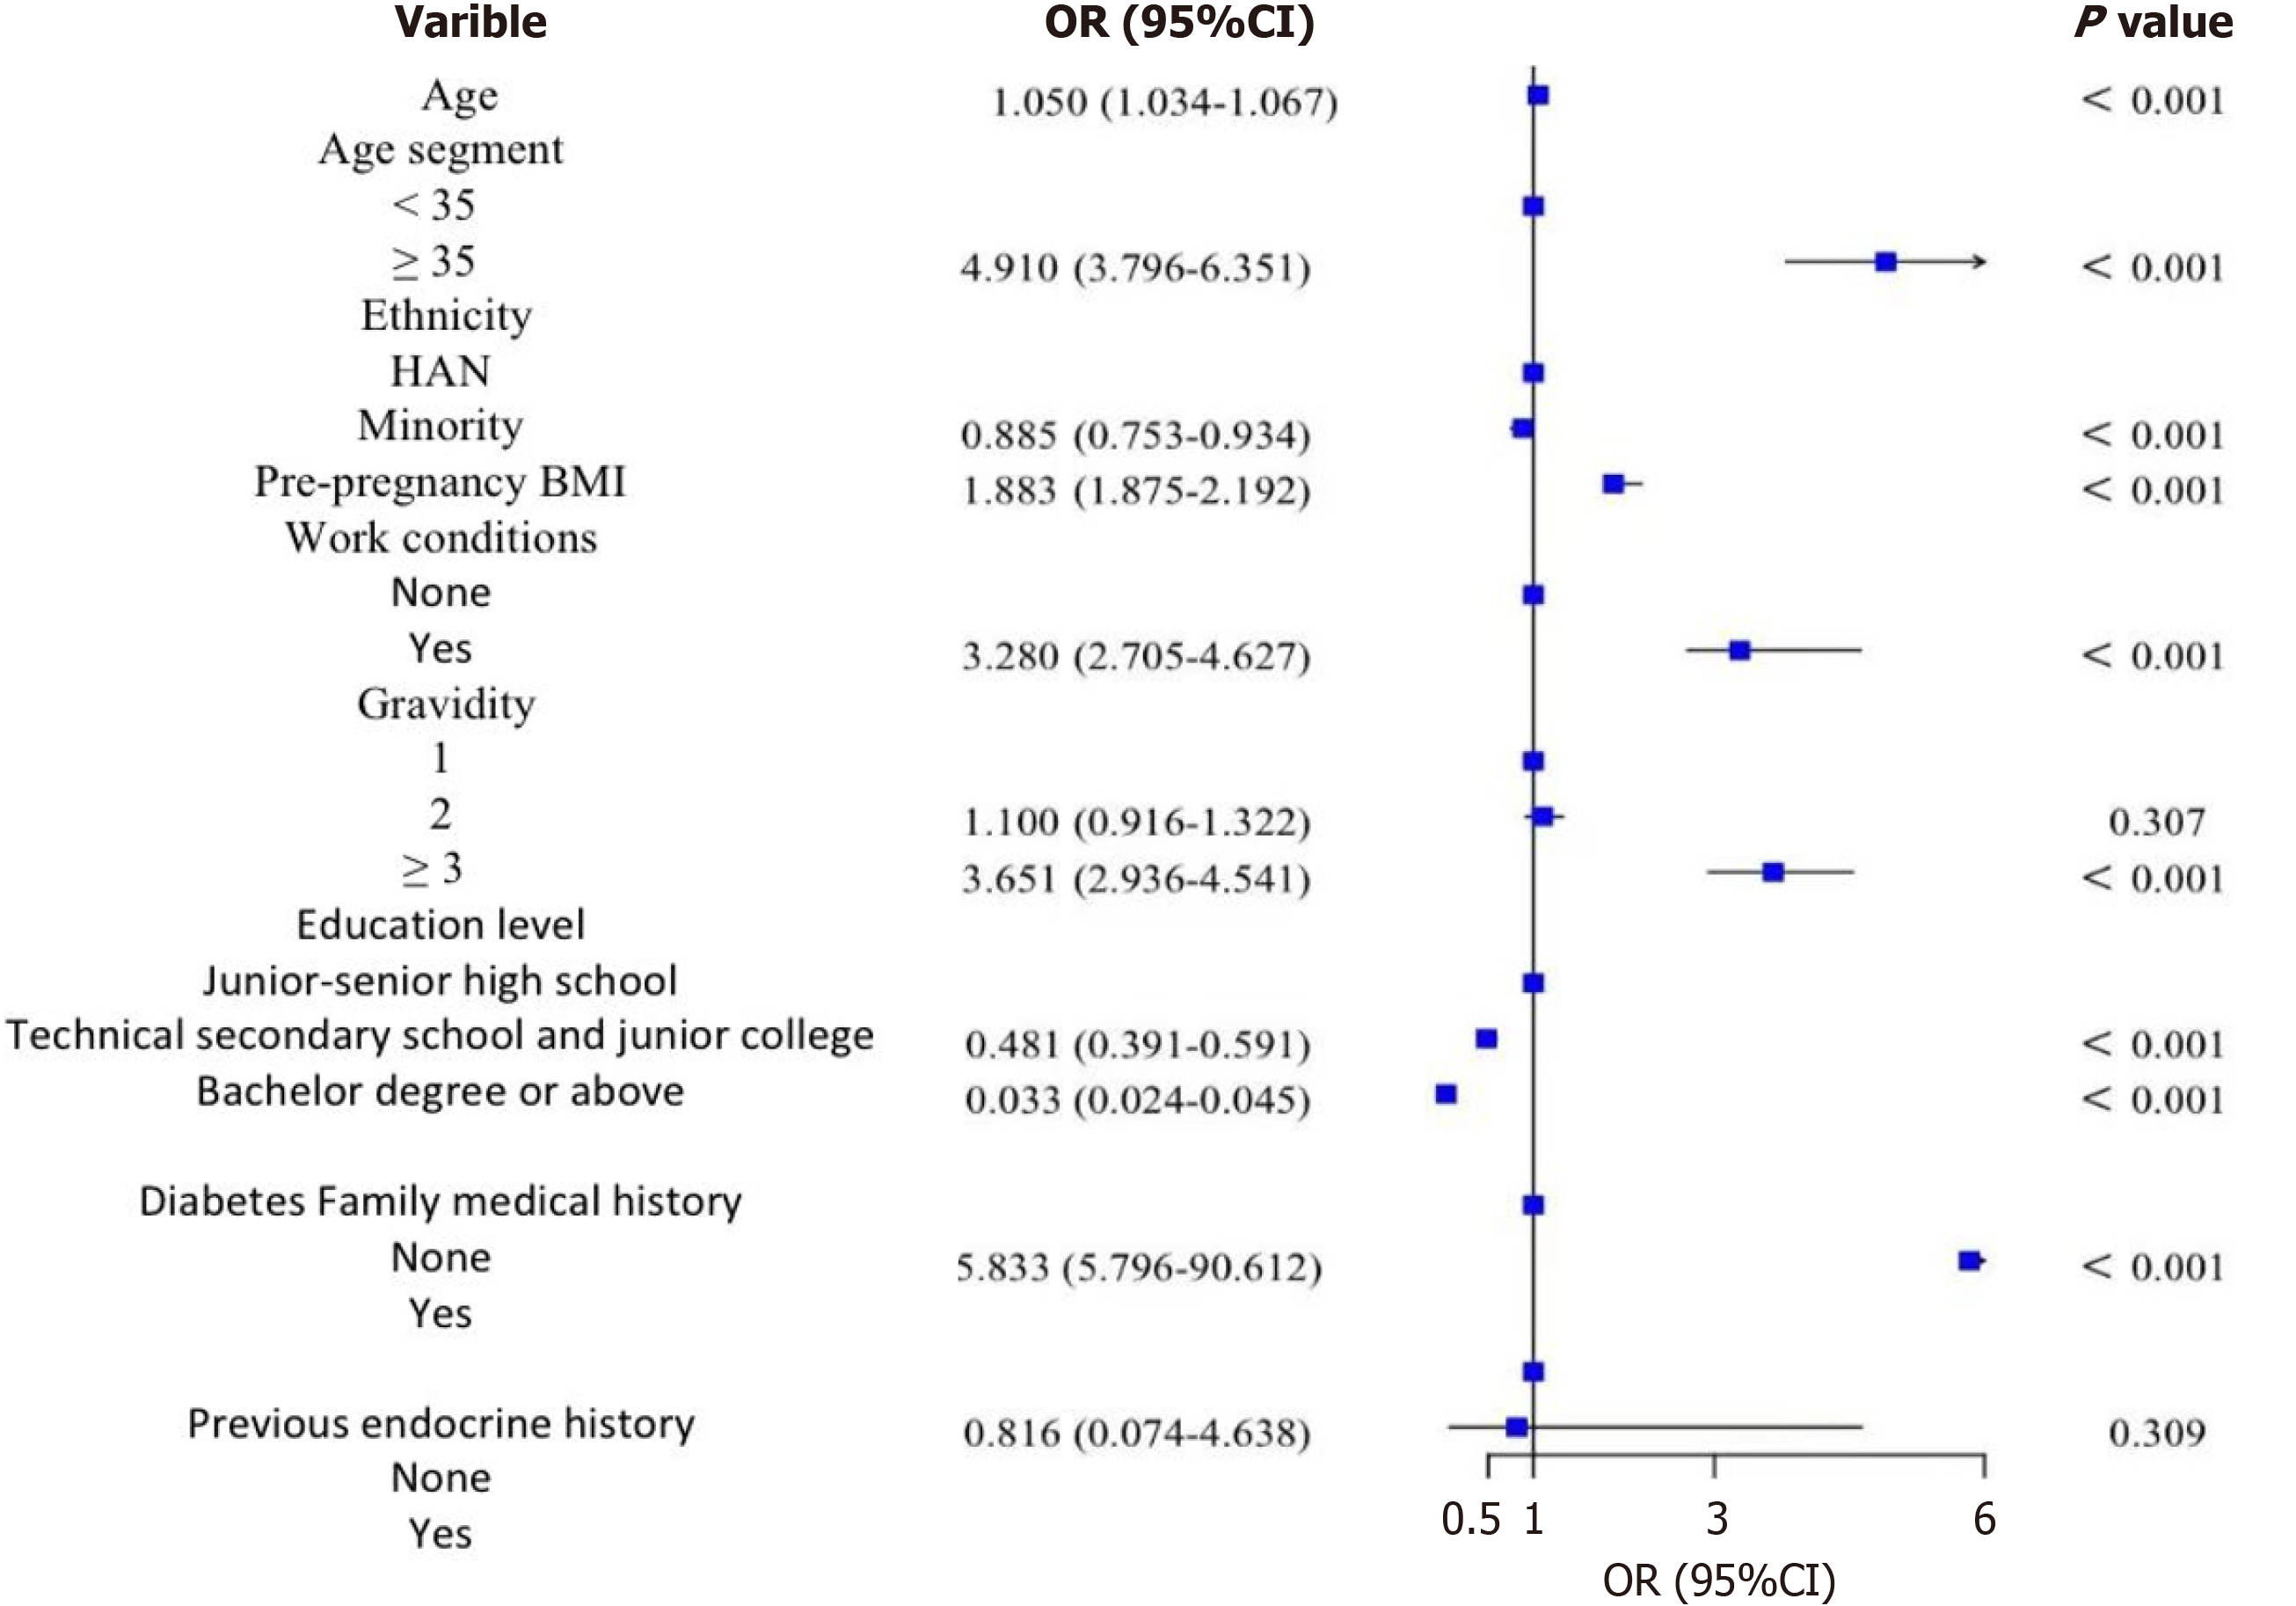
Figure 5 Forest map of binary logistic regression model that affects gestational diabetes mellitus general data.
OR: Odds ratio; CI: Confidence interval; BMI: Body mass index.
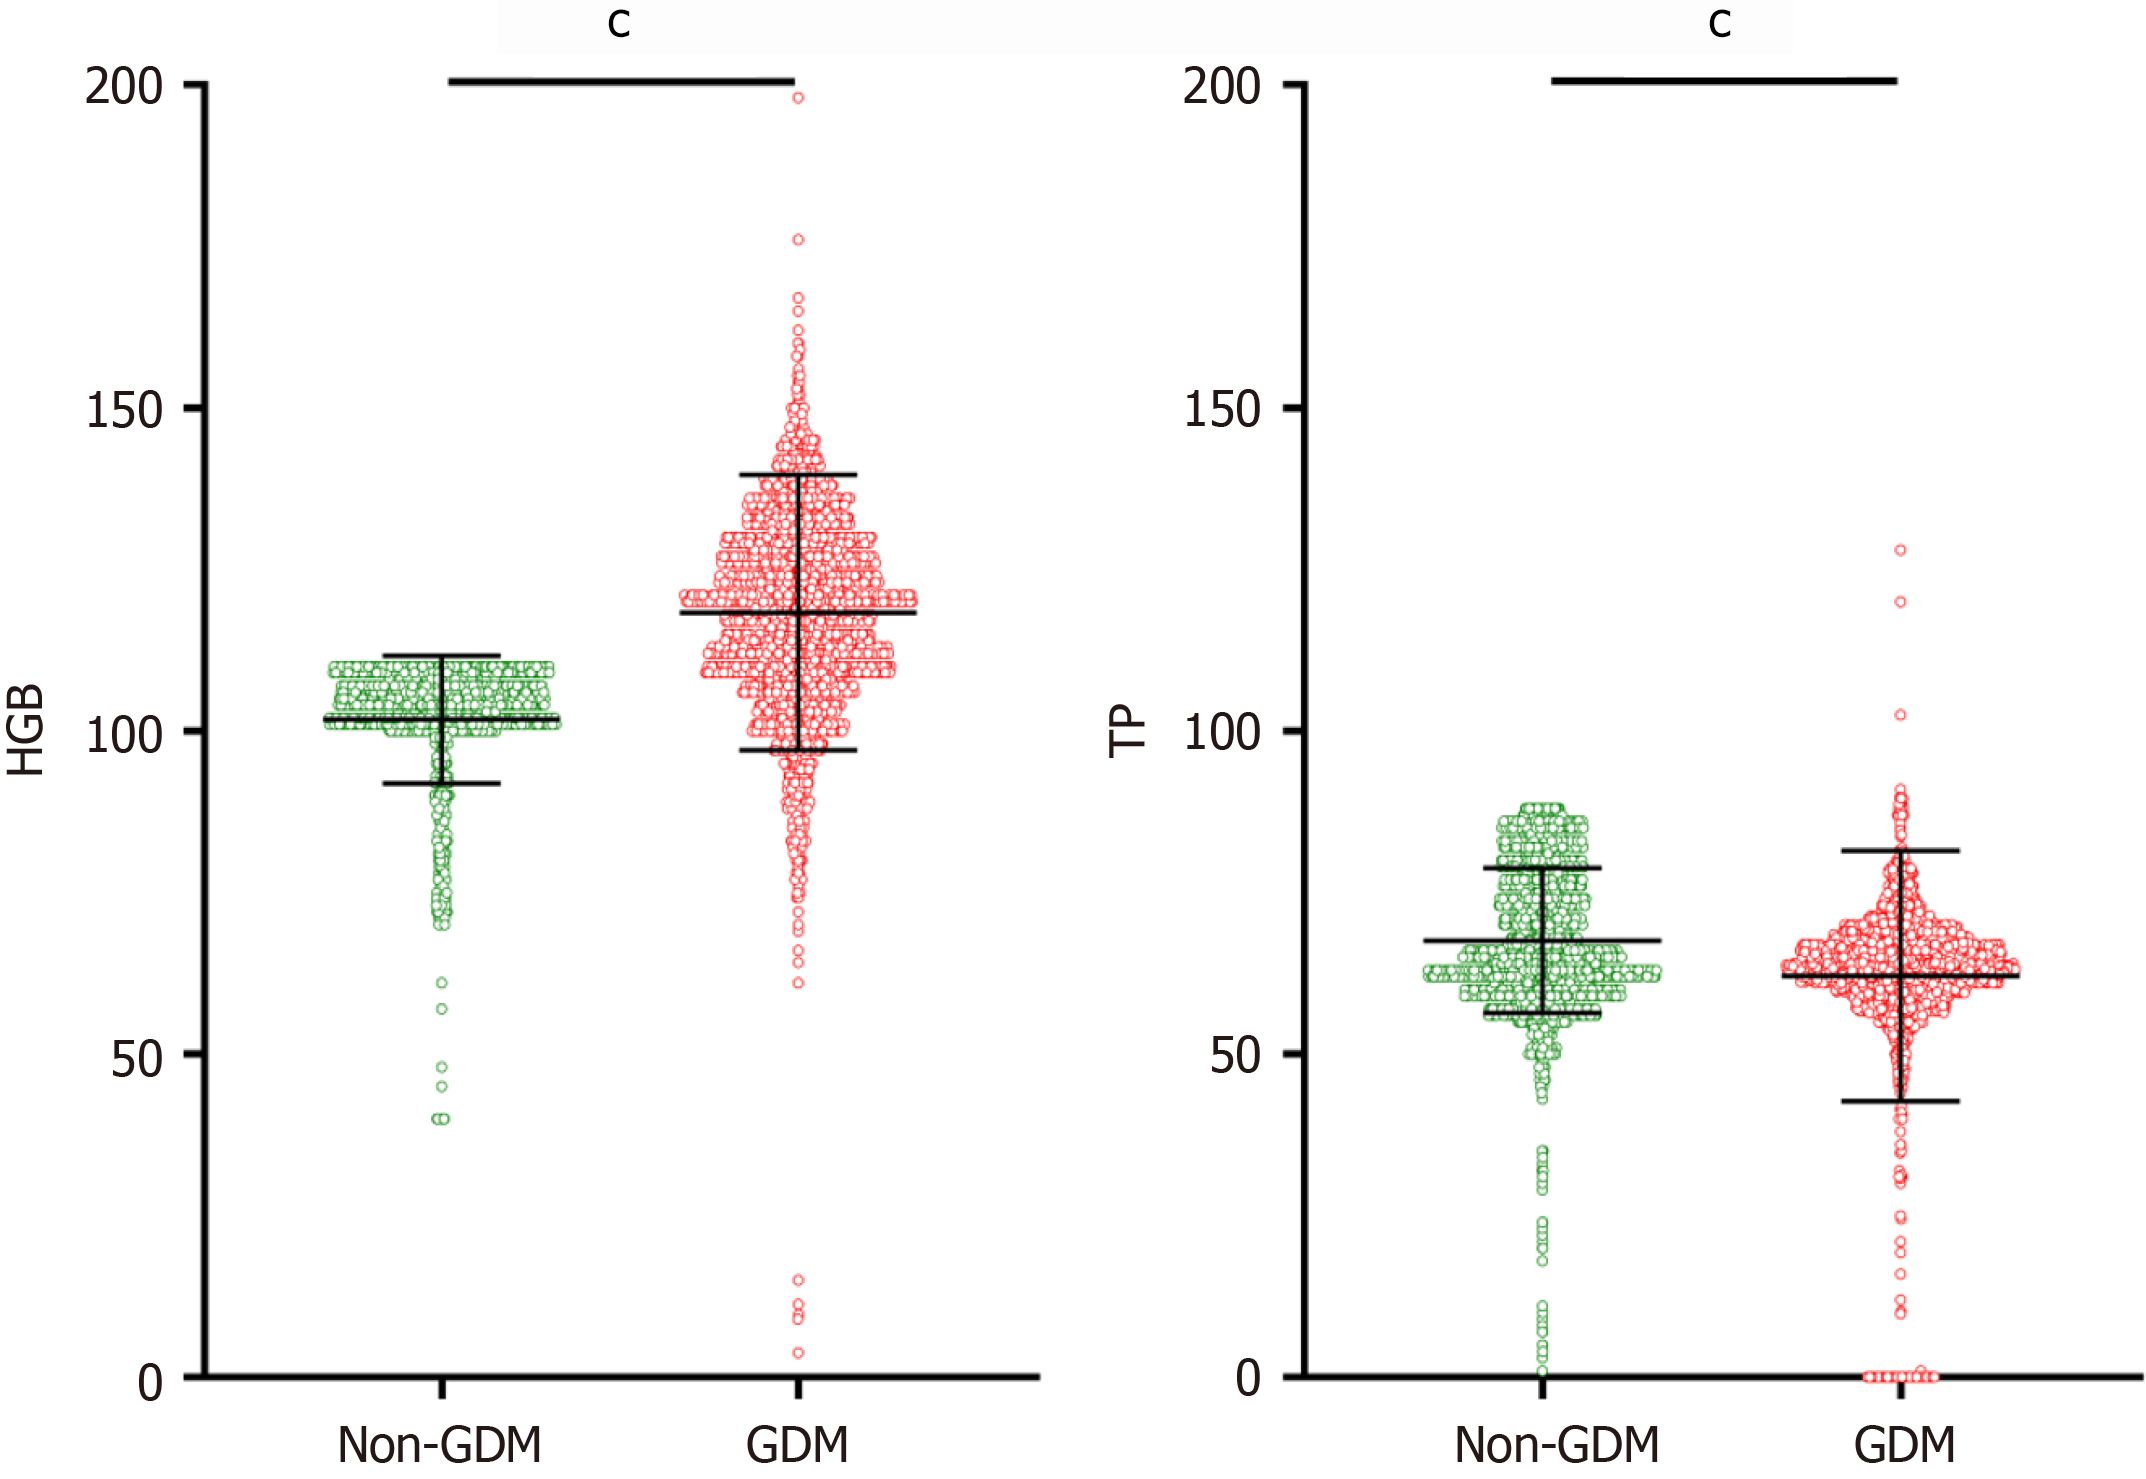
Figure 6 Mean standard deviation diagram of scattered points in laboratory data affecting gestational diabetes mellitus.
cP < 0.001. GDM: Gestational diabetes mellitus; HGB: Hemoglobin; TP: Total protein.
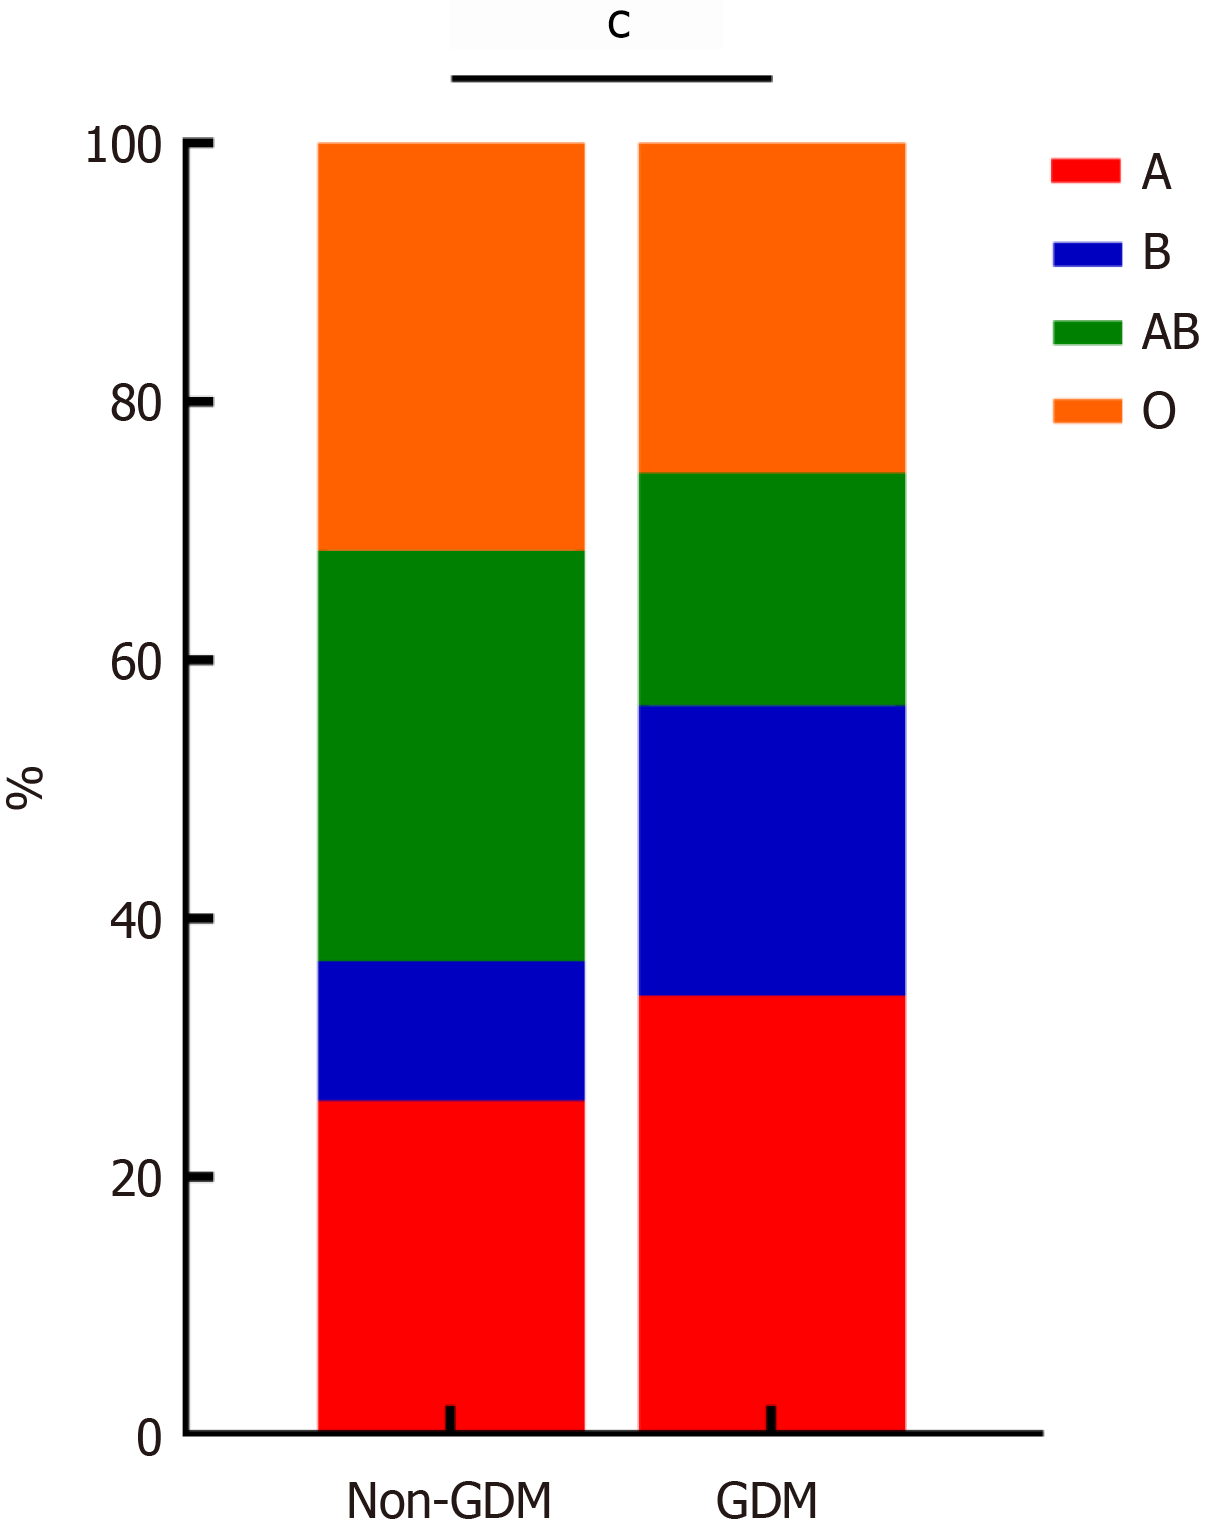
Figure 7 Laboratory data accumulation bar chart (blood type) affecting gestational diabetes mellitus.
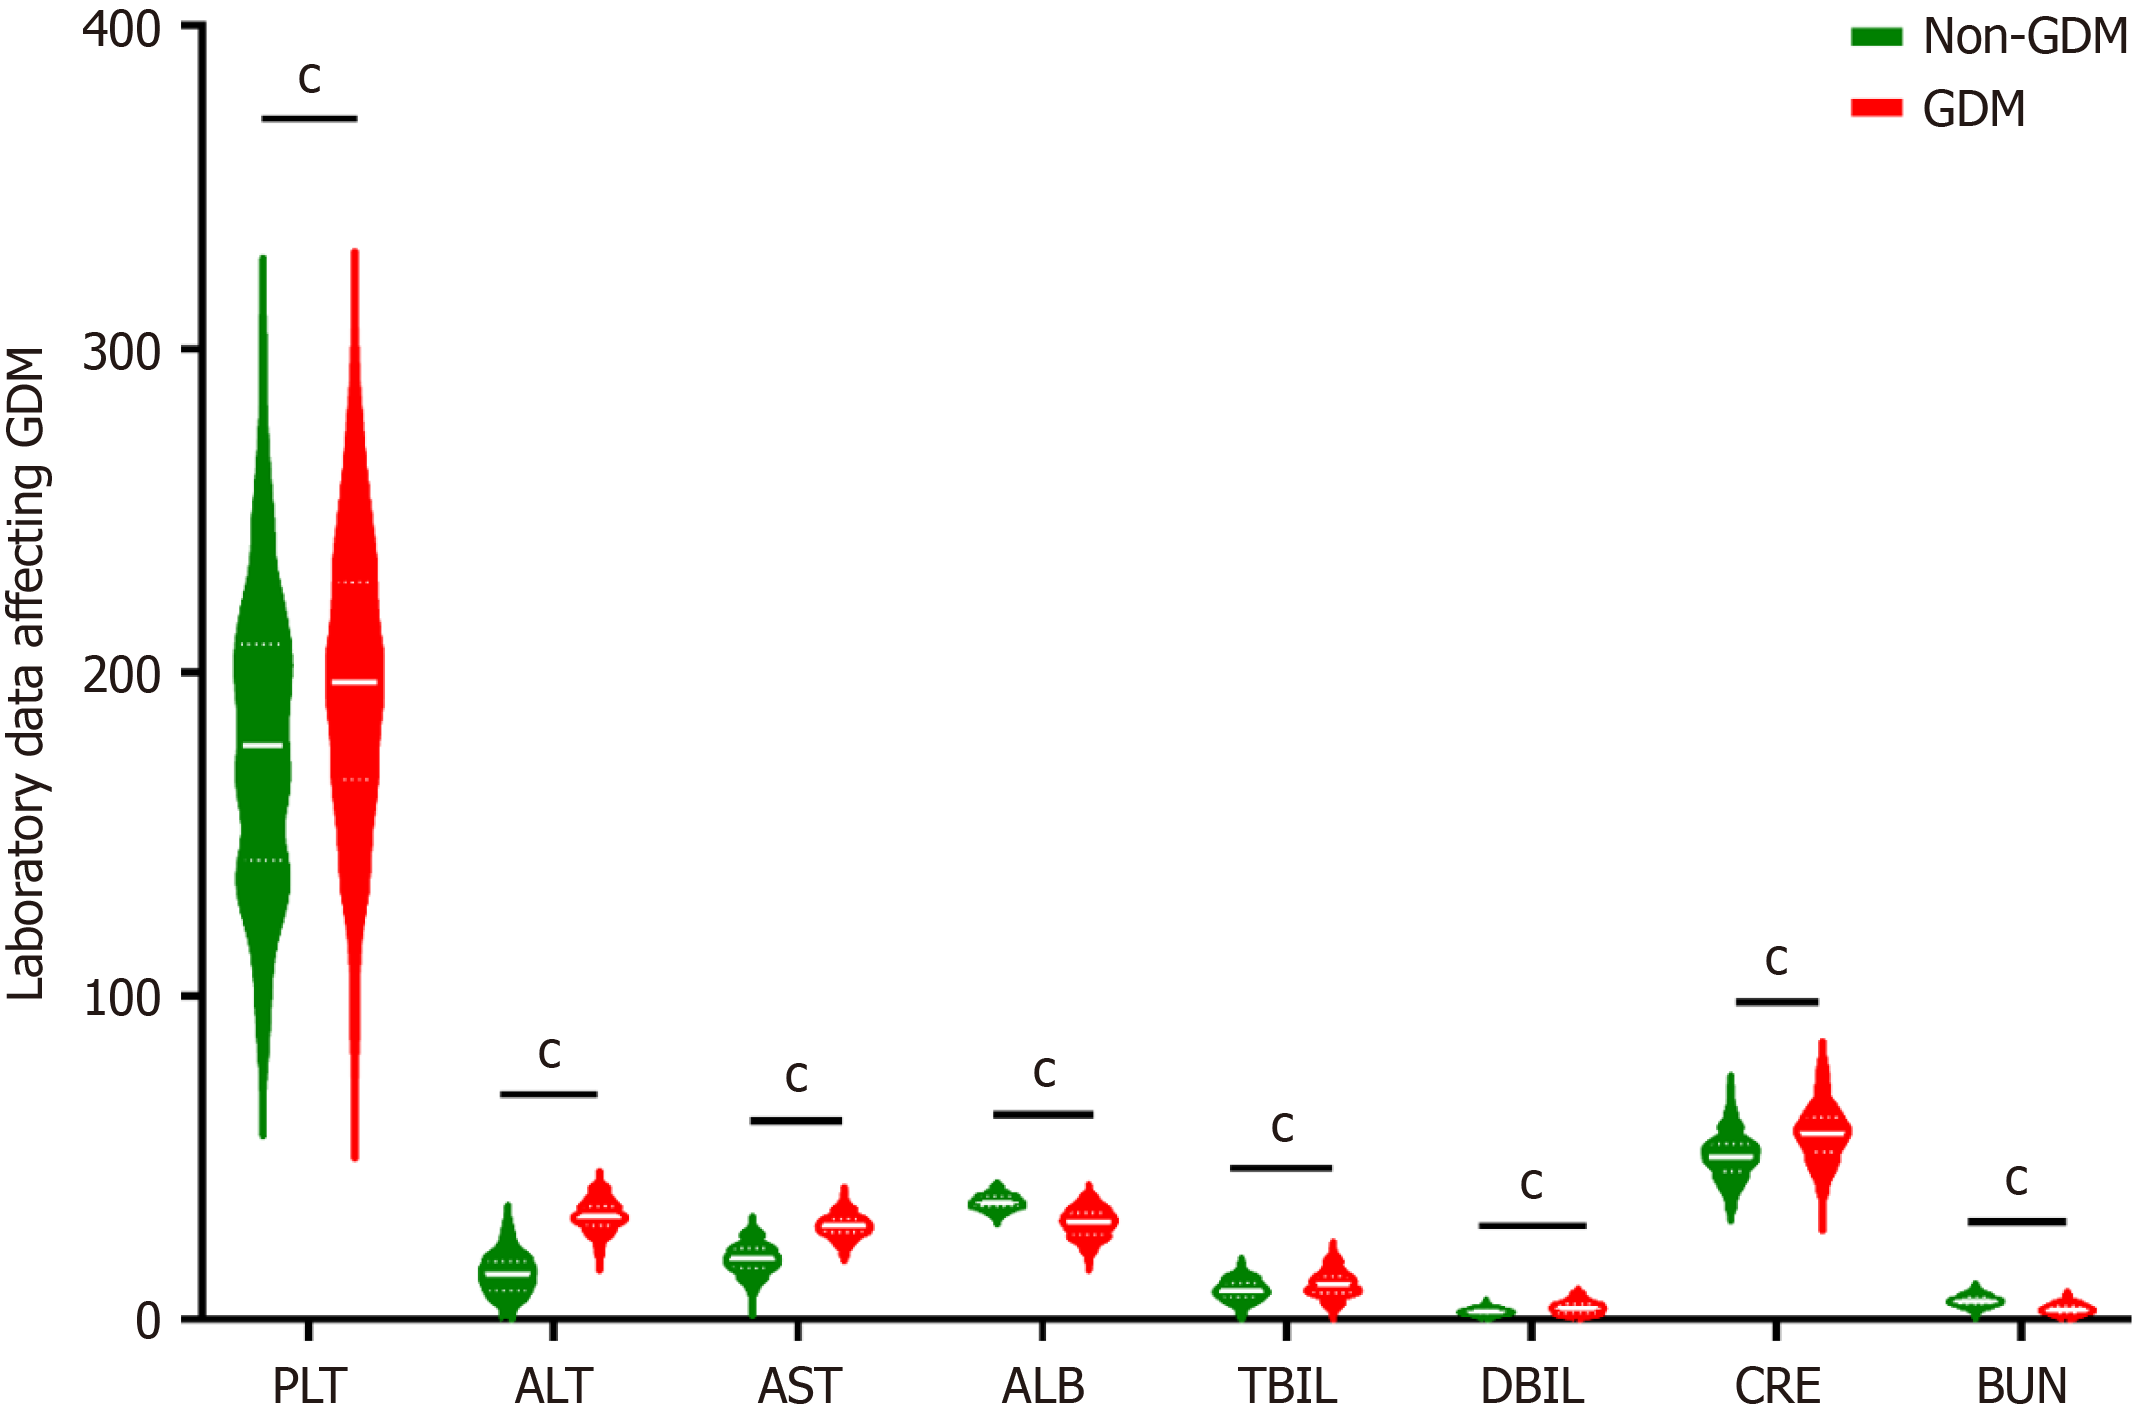
Figure 8 Violin diagram of laboratory data affecting gestational diabetes mellitus.
PLT: Platelet; ALT: Alanine aminotransferase; AST: Aspartate aminotransferase; TBIL: Total bilirubin; DBIL: Direct bilirubin; ALB: Albumin; CRE: Creatinine; BUN: Blood urea nitrogen; GDM: Gestational diabetes mellitus.
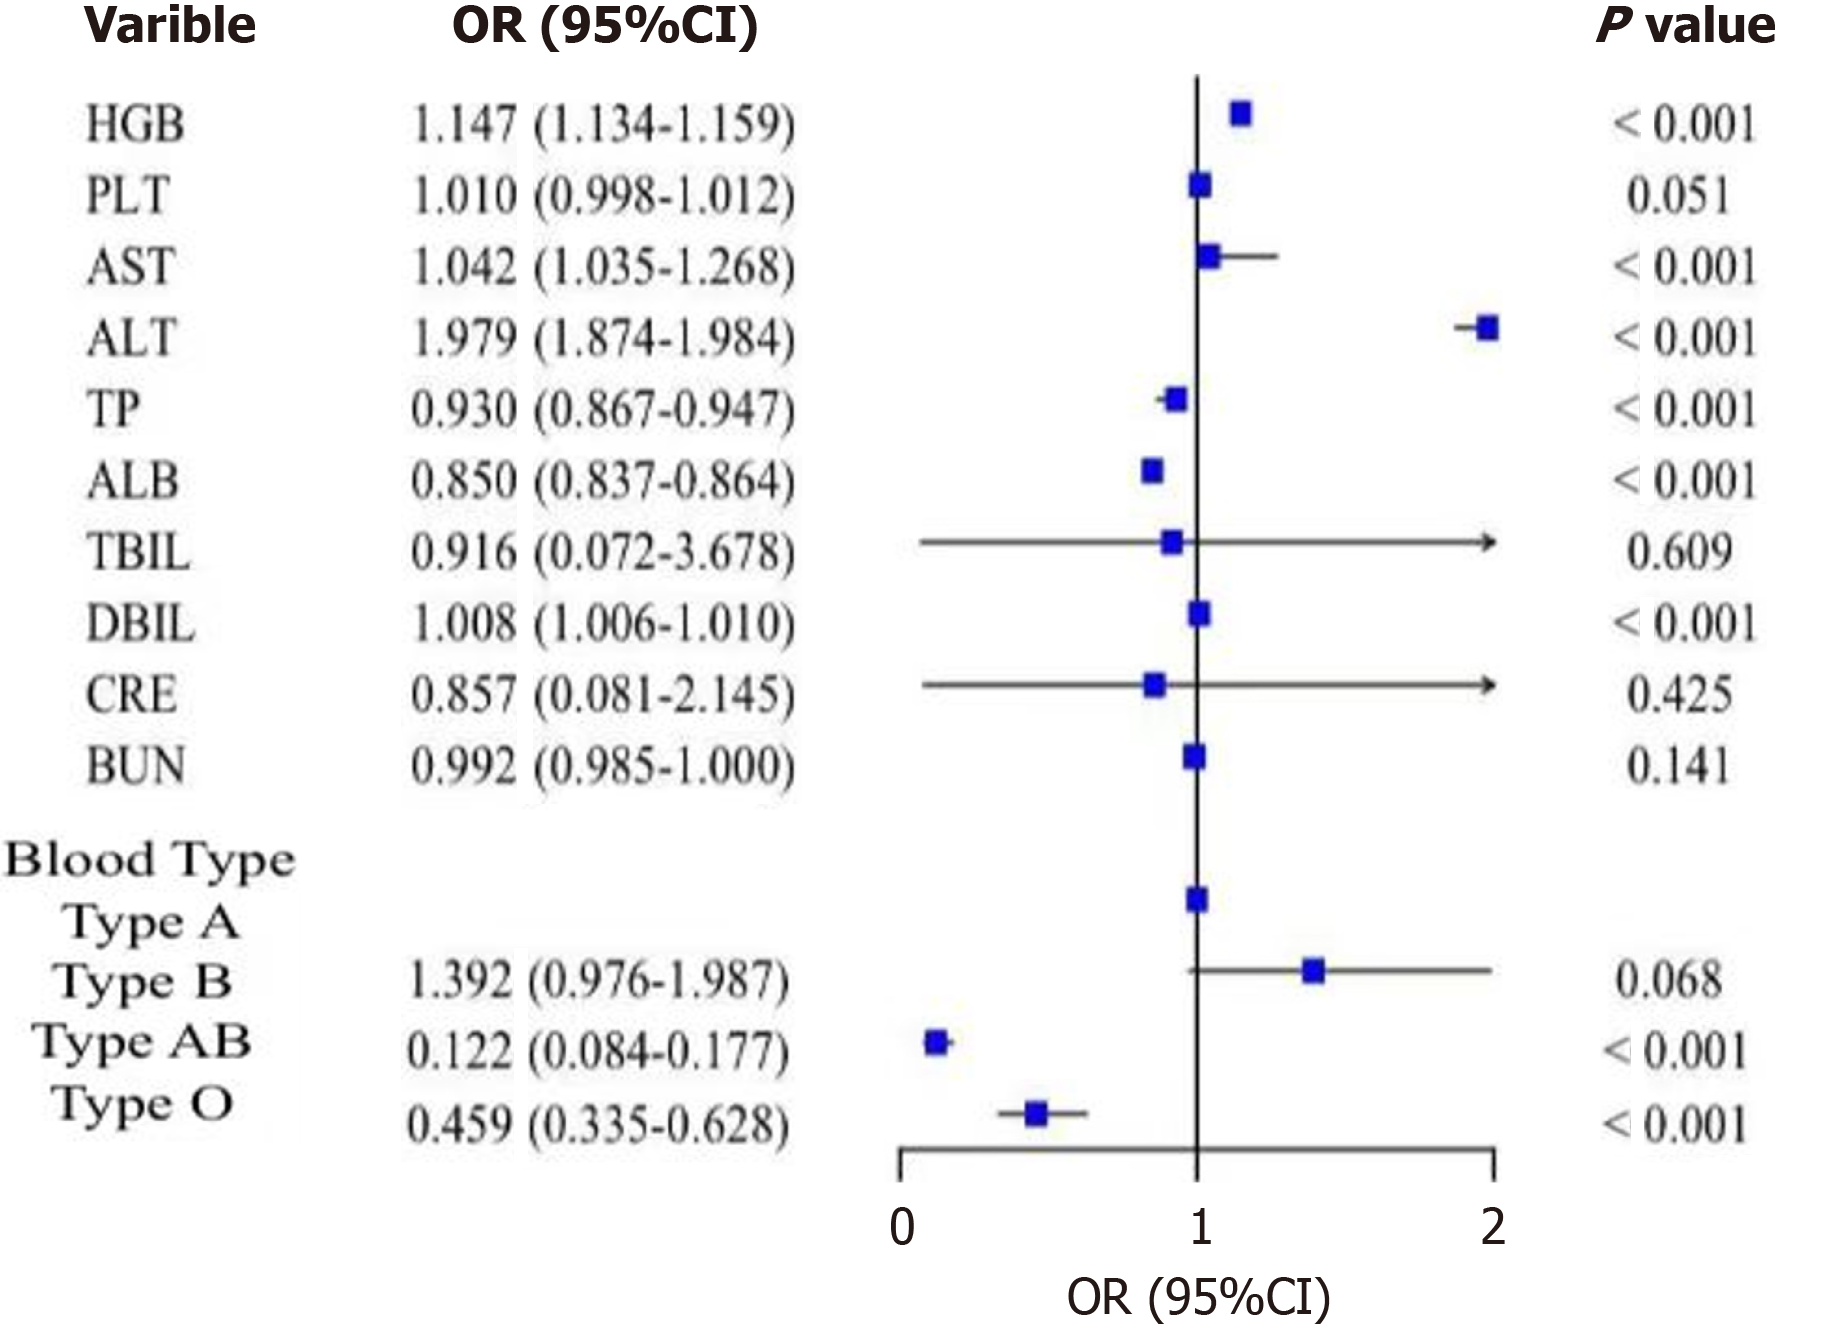
Figure 9 Forest map of a binary logistic regression model of laboratory data affecting gestational diabetes mellitus.
OR: Odds ratio; CI: Confidence interval; PLT: Platelet; ALT: Alanine aminotransferase; AST: Aspartate aminotransferase; TBIL: Total bilirubin; DBIL: Direct bilirubin; ALB: Albumin; CRE: Creatinine; BUN: Blood urea nitrogen; HGB: Hemoglobin; TP: Total protein.
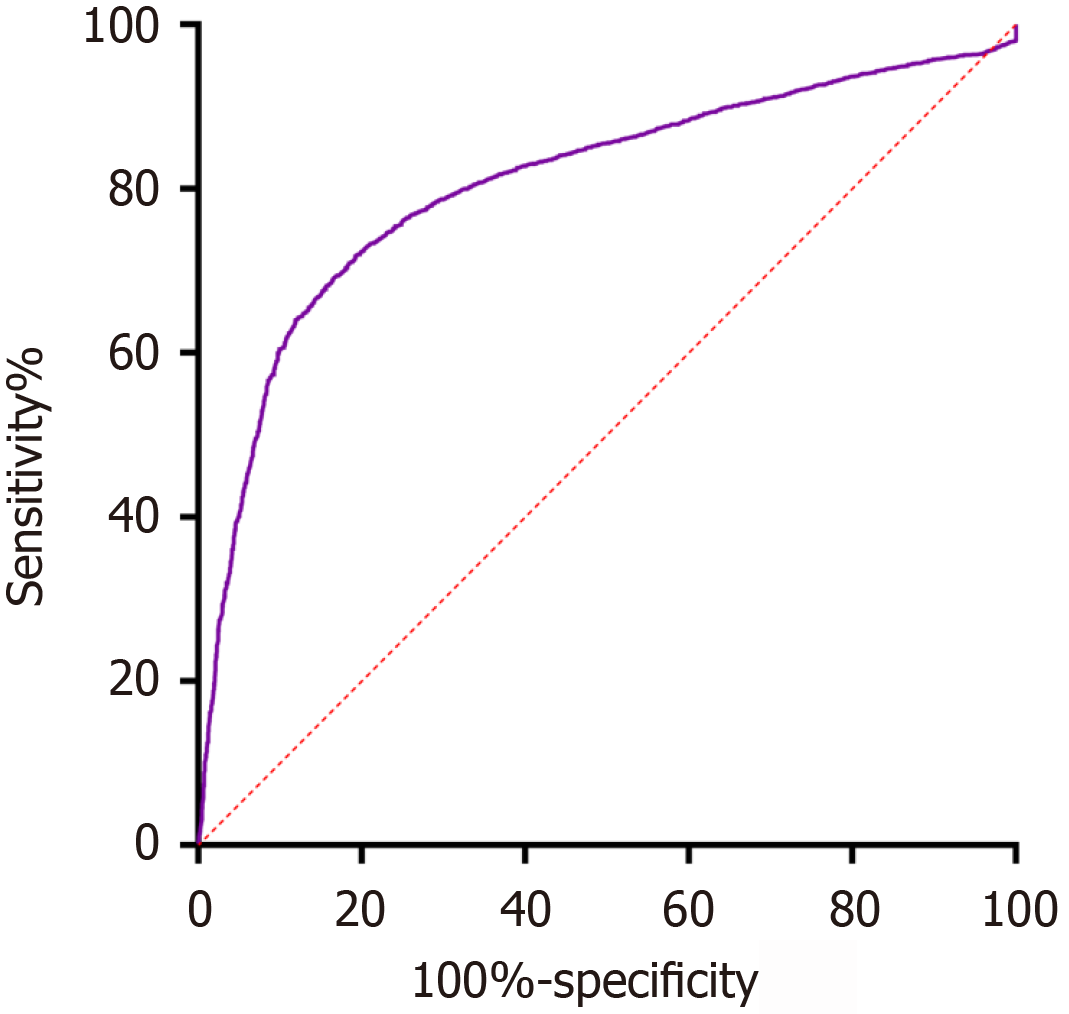
Figure 10 Receiver operating characteristic curve of the predictive efficiency of the model.
- Citation: Dong L, Zhong W, Qiao T, Wang Z, Liang Y, Zhao DQ. Investigation and study on the epidemiology of gestational diabetes mellitus in Guizhou. World J Diabetes 2025; 16(2): 98438
- URL: https://www.wjgnet.com/1948-9358/full/v16/i2/98438.htm
- DOI: https://dx.doi.org/10.4239/wjd.v16.i2.98438


