©The Author(s) 2020.
World J Gastrointest Oncol. Jun 15, 2020; 12(6): 687-698
Published online Jun 15, 2020. doi: 10.4251/wjgo.v12.i6.687
Published online Jun 15, 2020. doi: 10.4251/wjgo.v12.i6.687
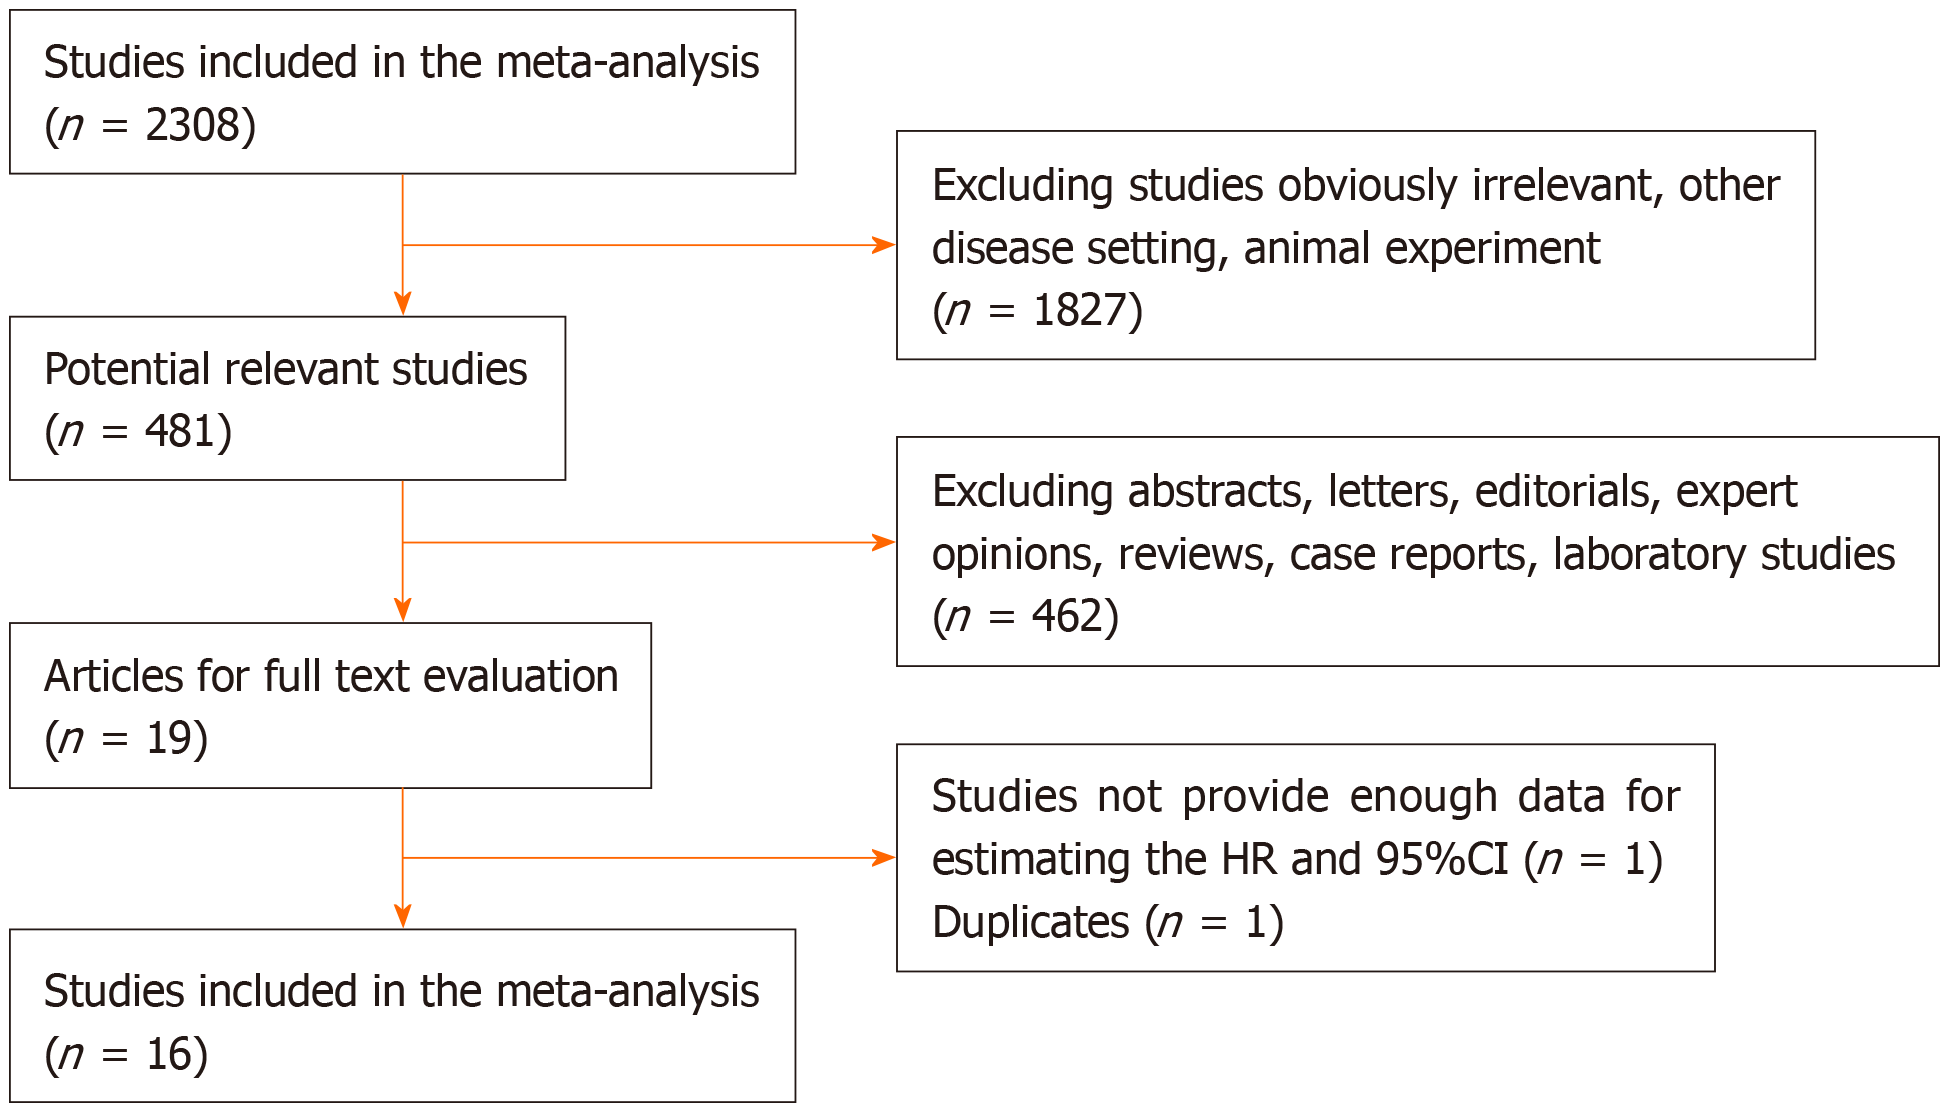
Figure 1 Flow chart of study selection.
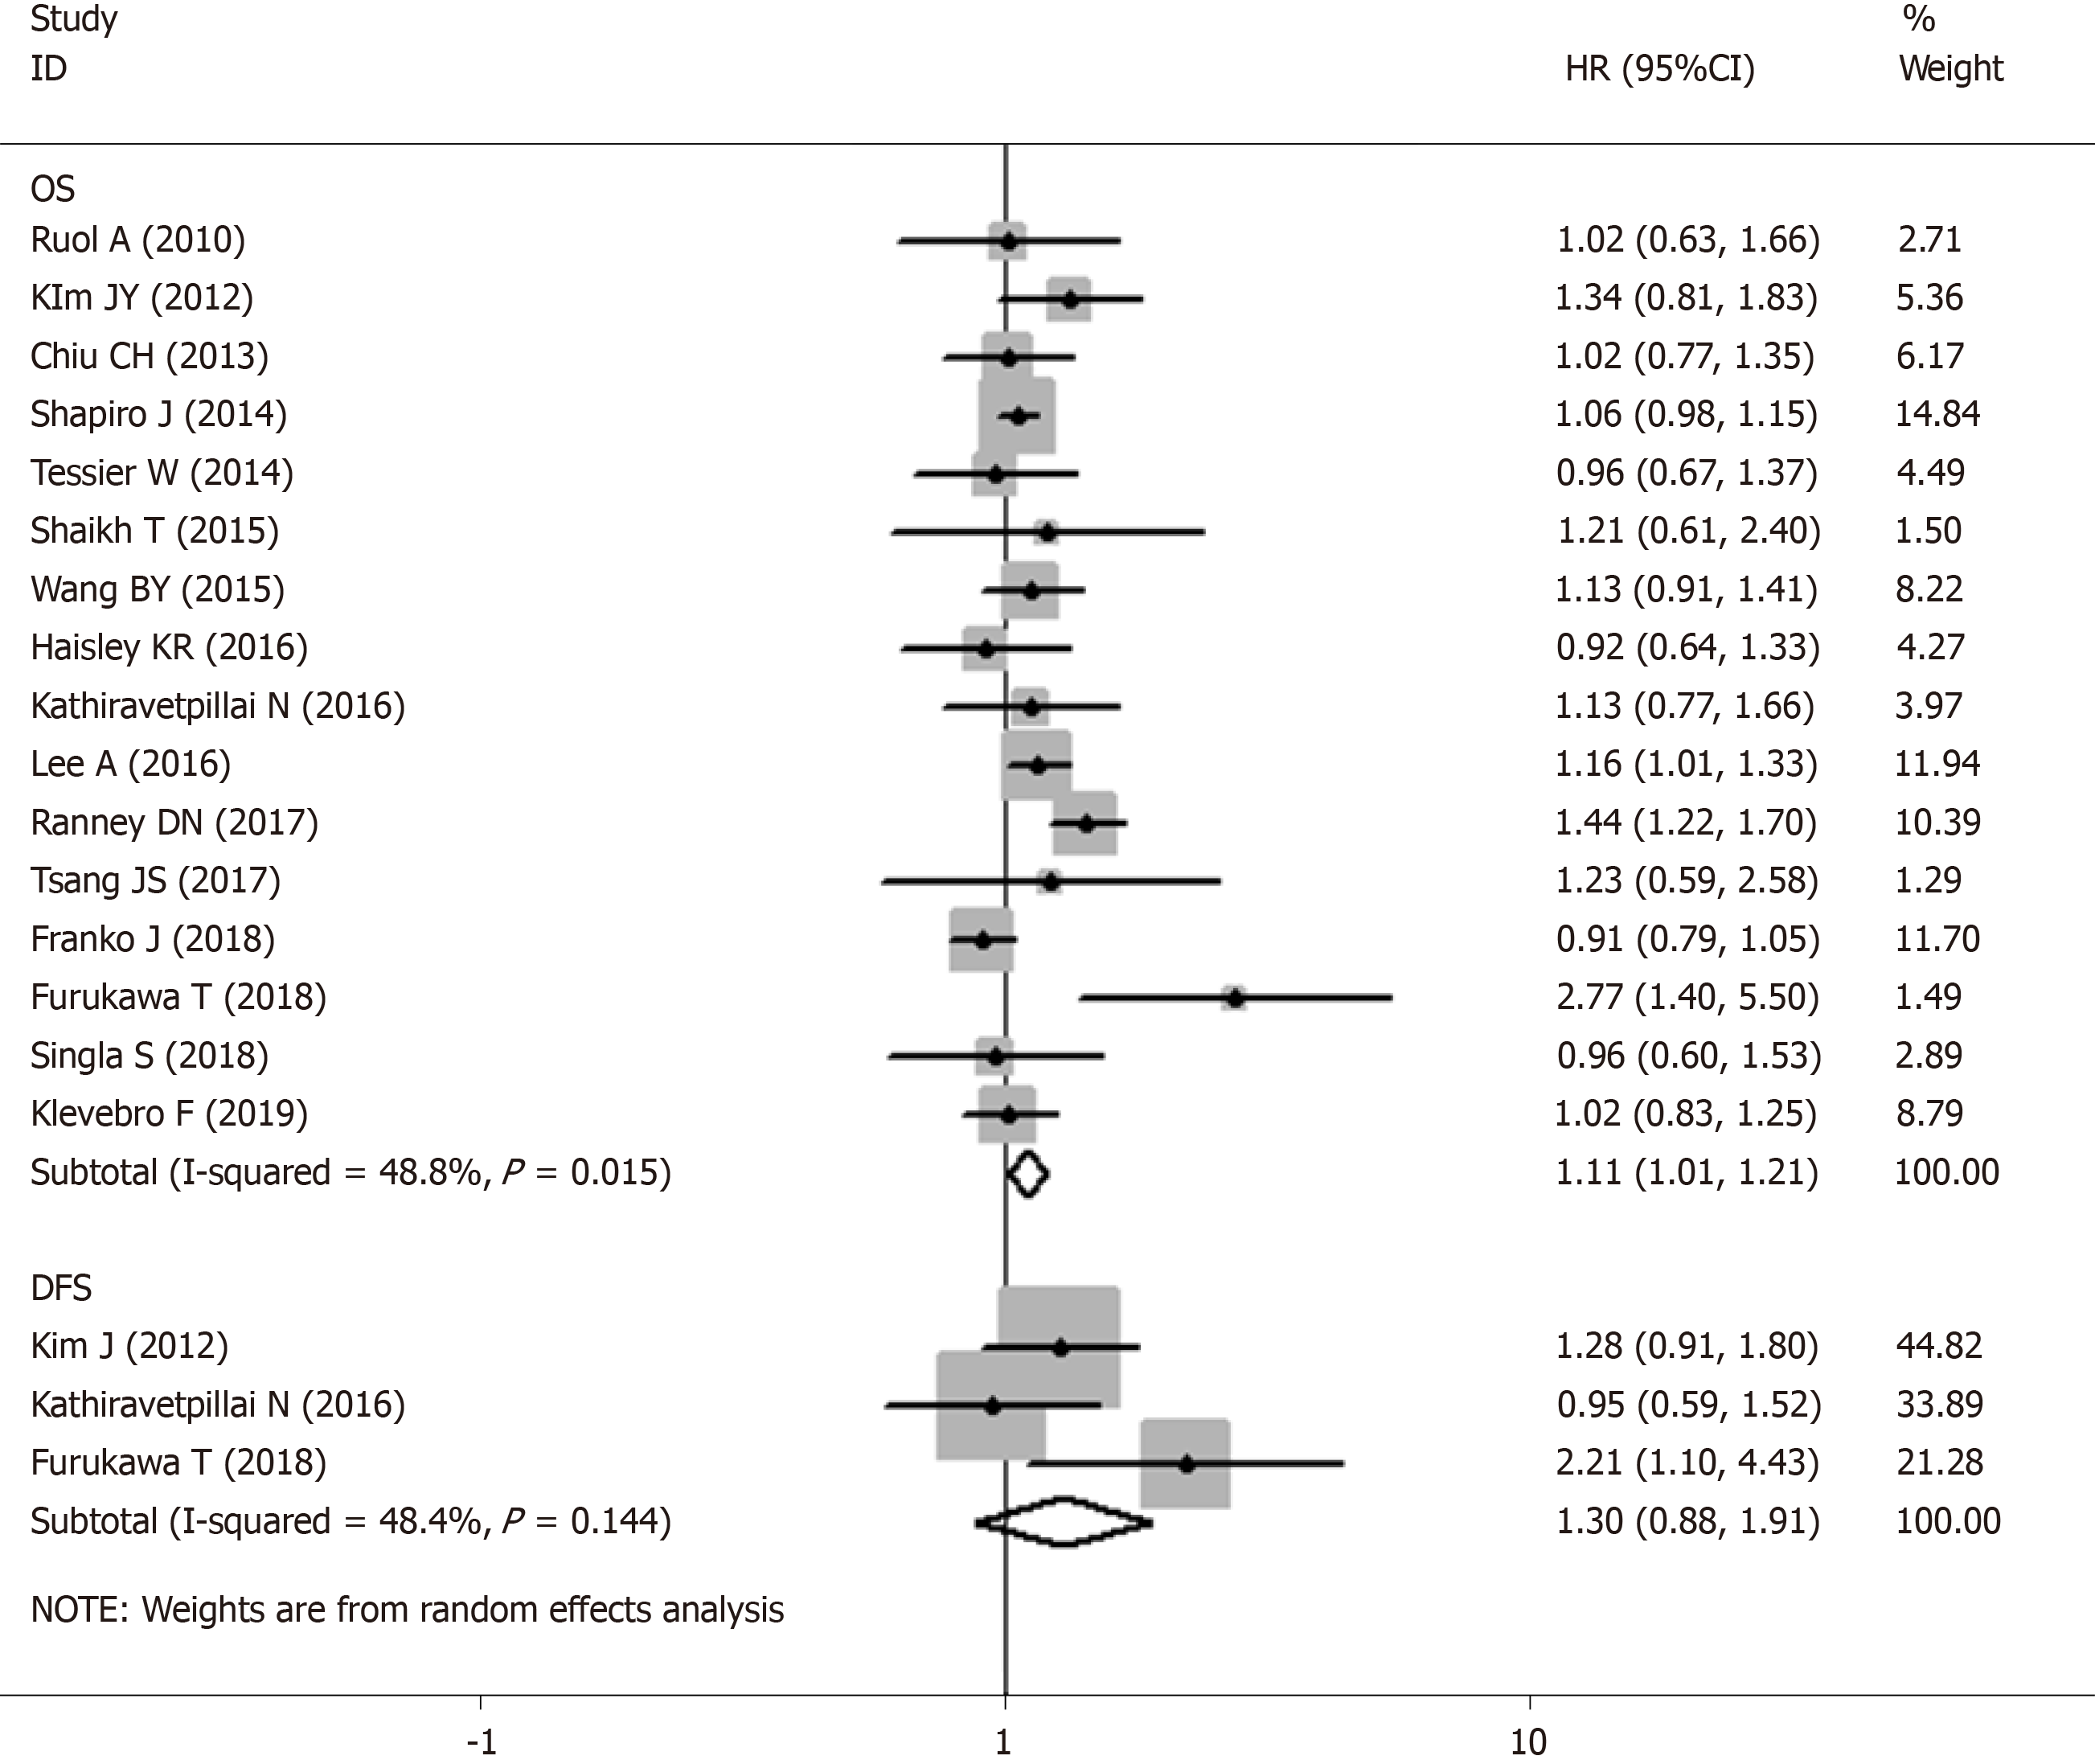
Figure 2 Forest plot of the association between time interval and overall survival/progression-free survival of esophageal cancer patients.
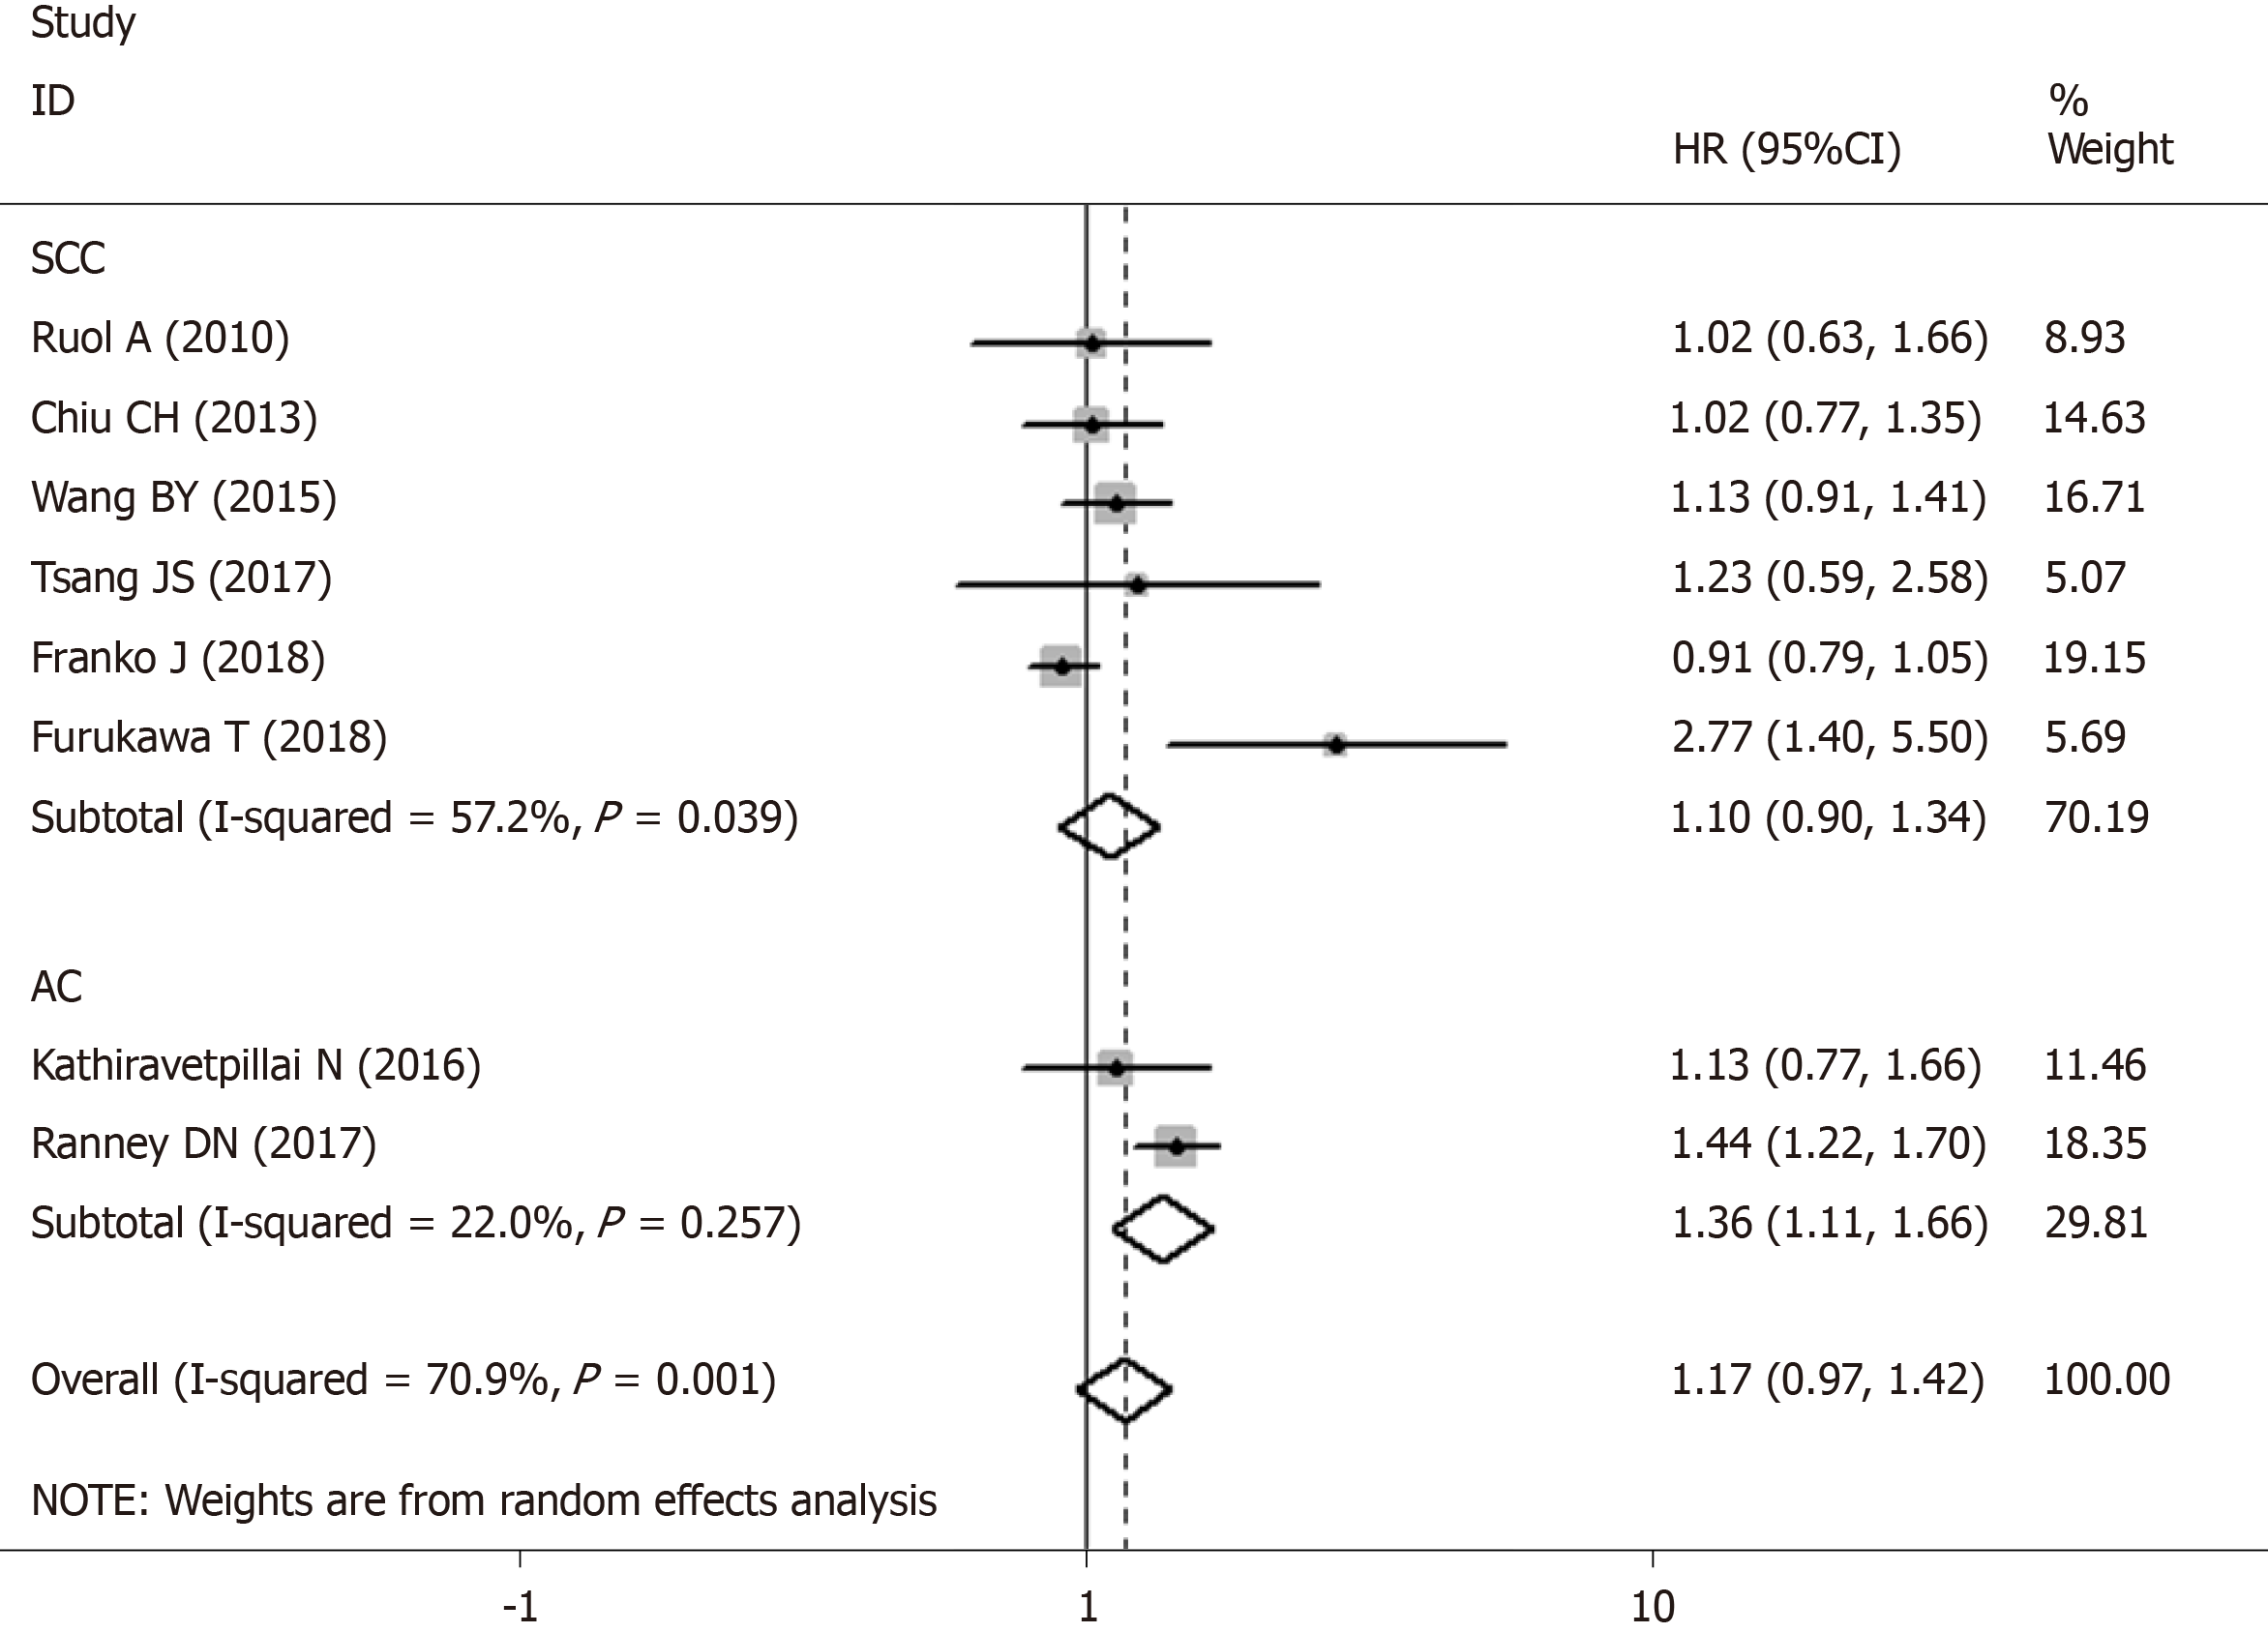
Figure 3 Forest plot of the association between time interval and overall survival of patients with squamous cell carcinoma and adenocarcinoma.
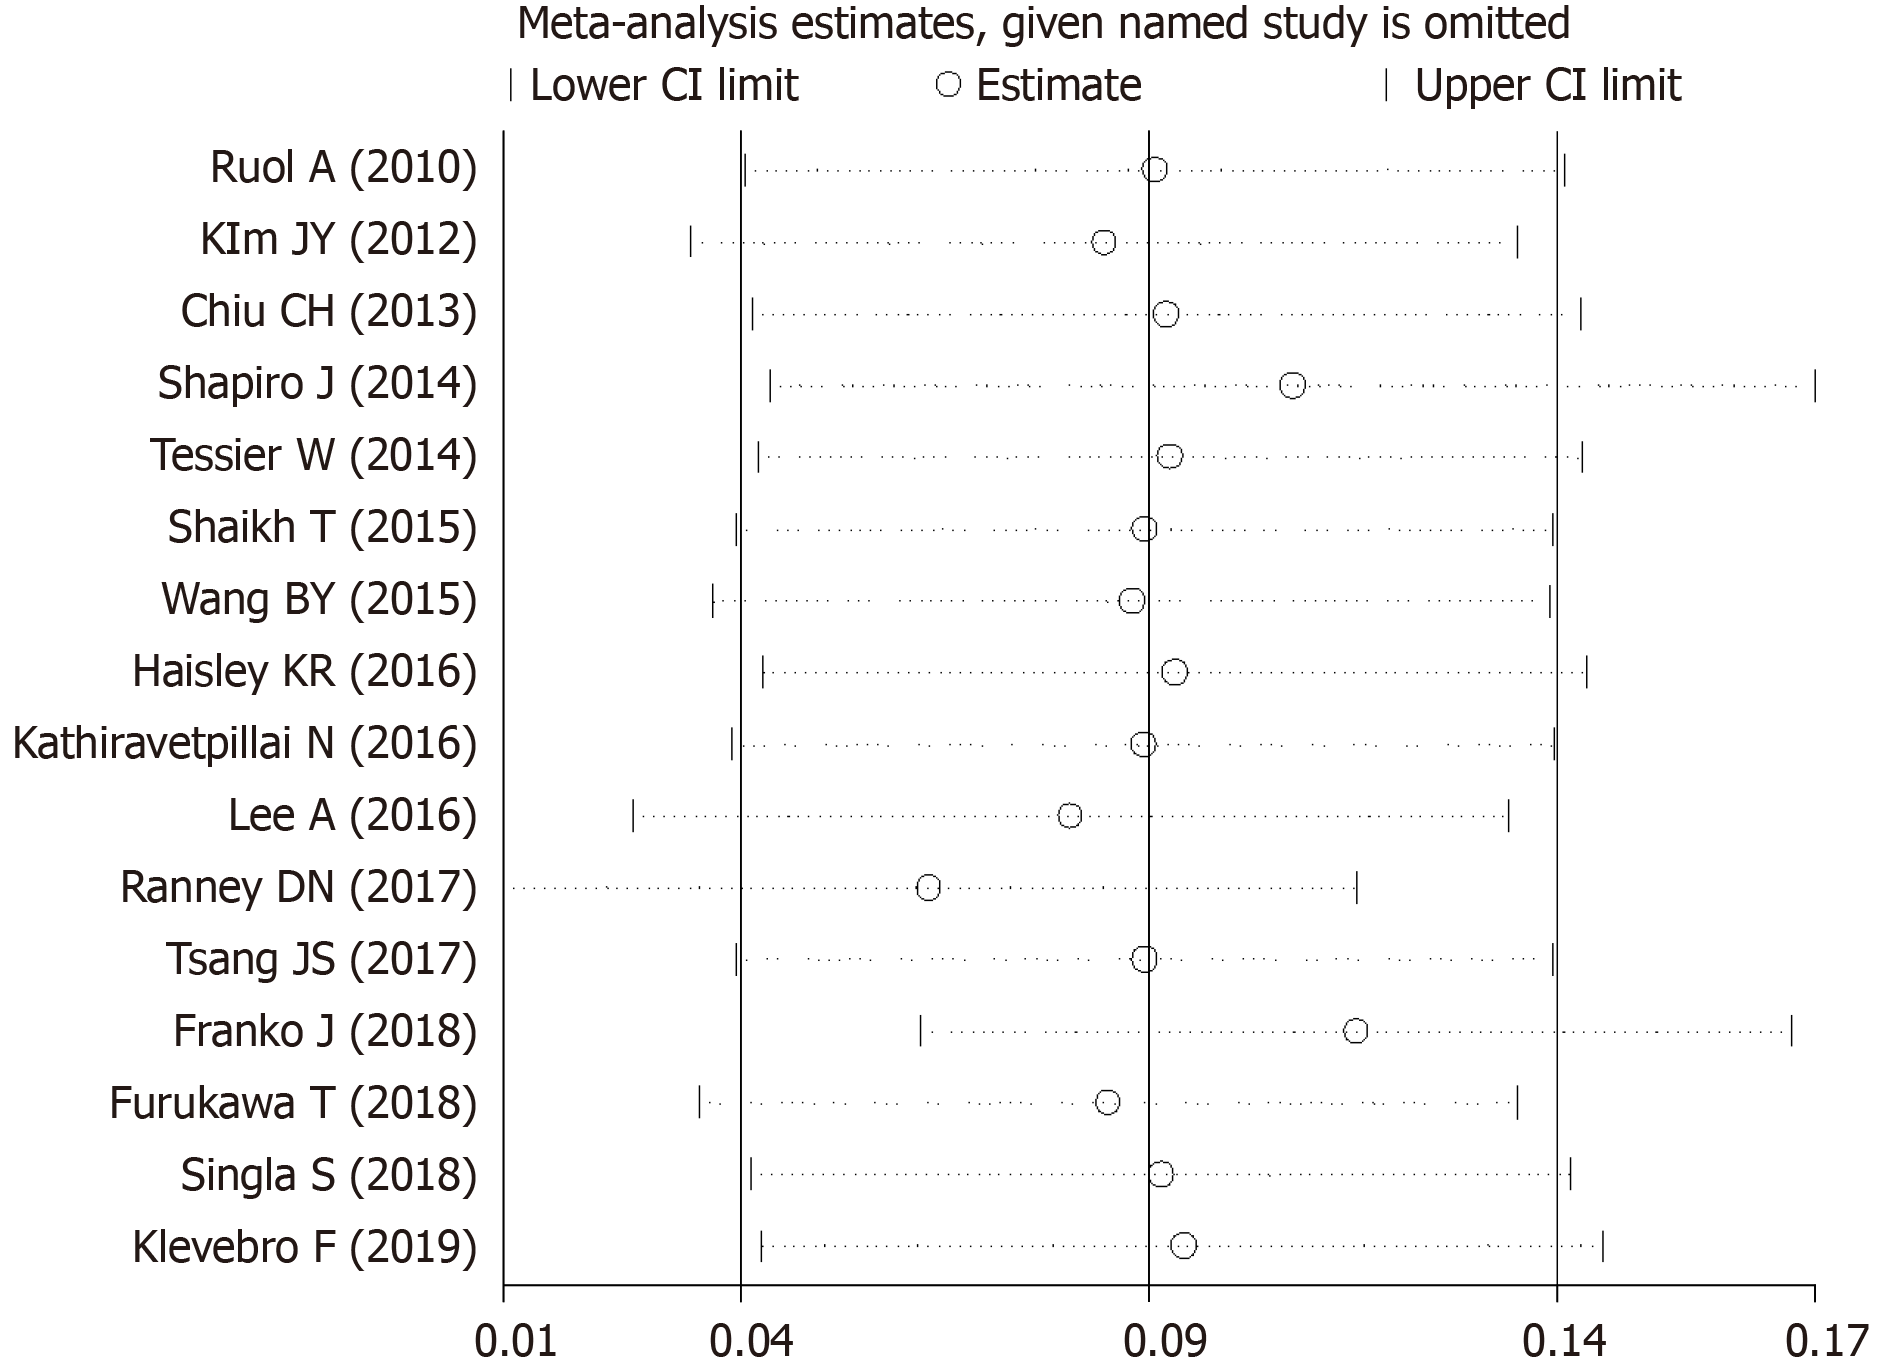
Figure 4 Sensitivity analysis of the association between time interval and overall survival.
Combined results were still stable after the exclusion of any single study.
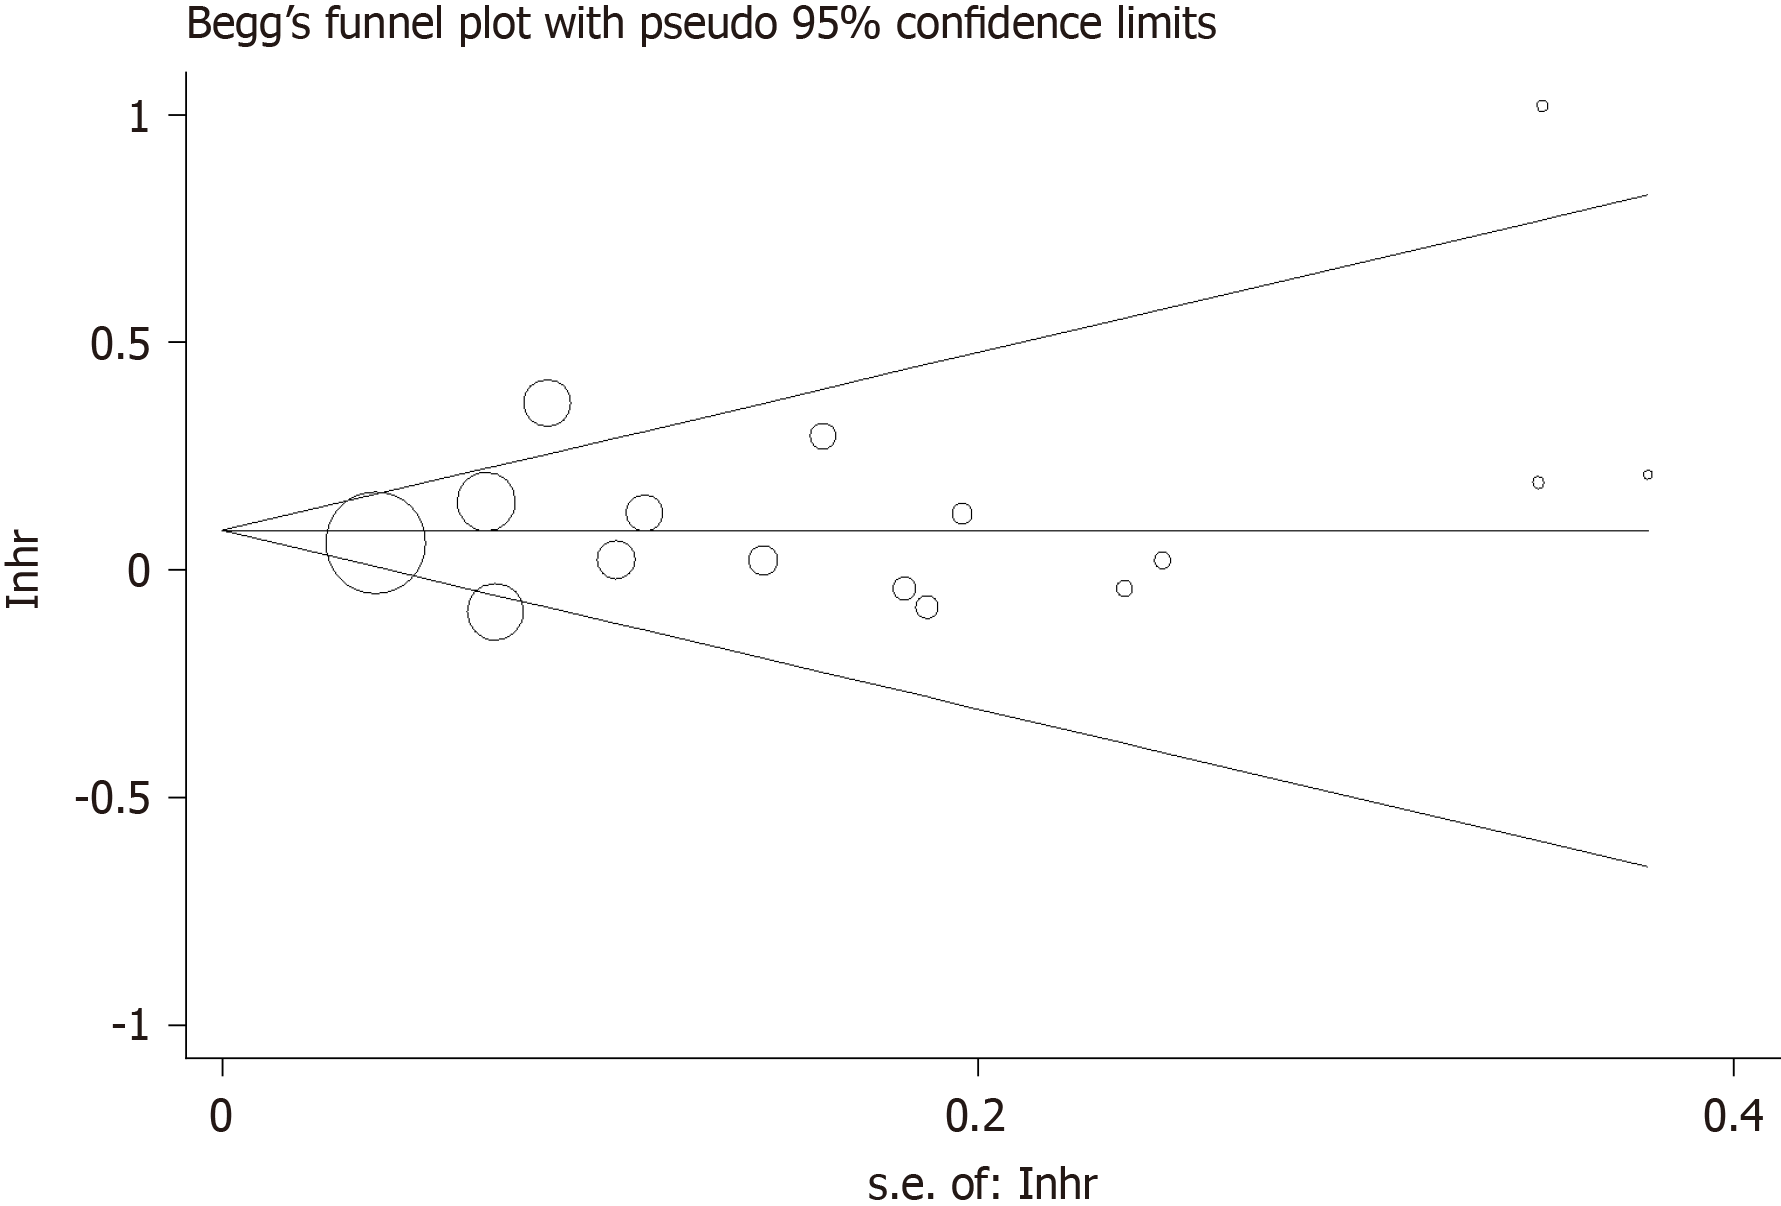
Figure 5 Begg’s funnel plot of the association between time interval and overall survival.
The Begg’s funnel plot did not indicate publication bias in the meta-analyses on the association between time to surgery and overall survival (Pr >|z| = 0.344 for Begg’s test).
- Citation: Shang QX, Yang YS, Gu YM, Zeng XX, Zhang HL, Hu WP, Wang WP, Chen LQ, Yuan Y. Timing of surgery after neoadjuvant chemoradiotherapy affects oncologic outcomes in patients with esophageal cancer. World J Gastrointest Oncol 2020; 12(6): 687-698
- URL: https://www.wjgnet.com/1948-5204/full/v12/i6/687.htm
- DOI: https://dx.doi.org/10.4251/wjgo.v12.i6.687


