©The Author(s) 2015.
World J Gastrointest Endosc. Aug 10, 2015; 7(10): 928-949
Published online Aug 10, 2015. doi: 10.4253/wjge.v7.i10.928
Published online Aug 10, 2015. doi: 10.4253/wjge.v7.i10.928
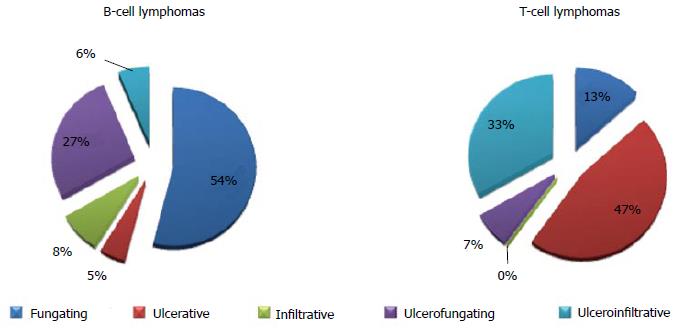
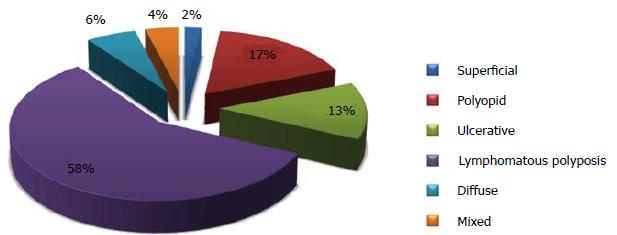
Figure 1 Differences in endoscopic pattern between B-cell and T-cell lymphomas of the gastrointestinal tract.
Data extrapolated from Kim et al[19] 2005.
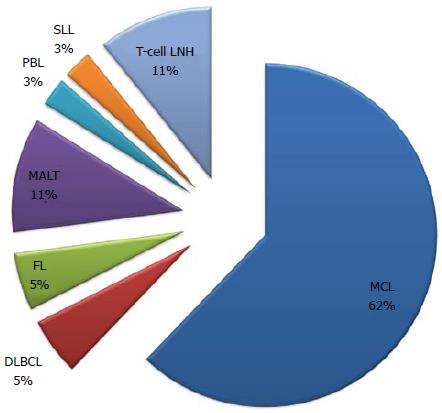
Figure 2 Pie chart describing the distribution of lymphomatous polyposis as a presenting gastrointestinal feature in gastrointestinal non-Hodgkin’s lymphomas according to histotype.
SLL: Small lymphocytic lymphoma; PBL: Plasmablastic B-cell lymphoma; DLBCL: Diffuse large B-cell lymphoma; MCL: Mantle cell lymphoma.
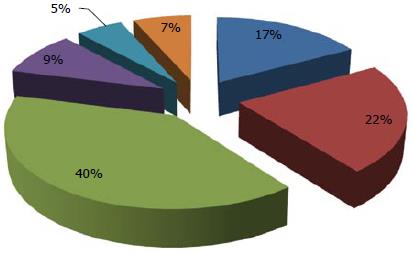
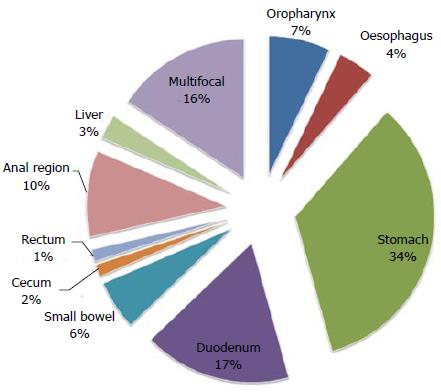
Figure 3 Pie chart describing the most involved gastrointestinal site in lymphomatous polyposis.
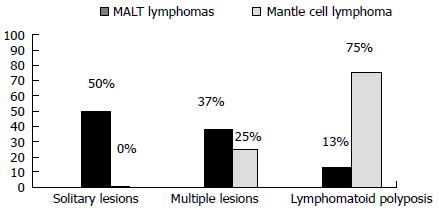
Figure 4 Frequency of lymphomatous polyposis at ileum in mucosa-associated lymphoid tissue lymphoma and mantle cell lymphoma.
Adapted from Saito et al[143], 2005.
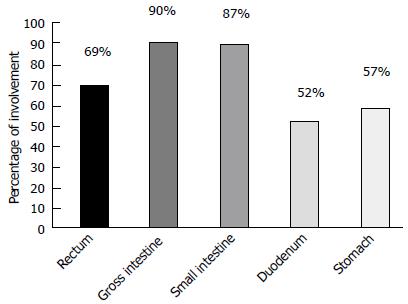
Figure 5 Frequency of the sites involved in mantle cell lymphoma.
Adapted from Ruskoné-Fourmestraux et al[101], 2010.
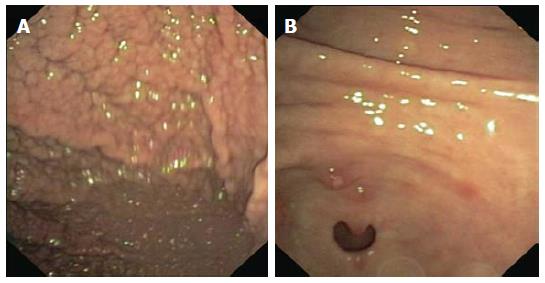
Figure 6 Endoscopy stomach: Granular pattern of the fundus and body of the stomach (A) and polyps in the antrum (B).
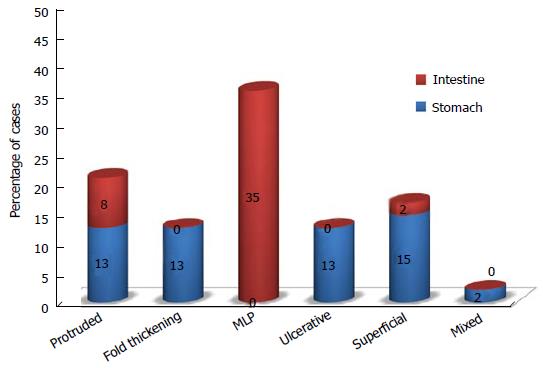
Figure 7 Endoscopic lesions in mantle cell lymphomas according to the gastric and intestinal localization.
Adapted from Iwamuro et al[144], 2010.
Figure 8 Endoscopic ultrasonography (radial scanning): Marked thickening of the muscularis propria and increased wall thickness (12 mm) in the angulus (A); antrum (B); body (C).
Figure 9 Ileoscopy revealing the presence of hyperemic mucosa with whitish polypoid nodularity.
The subsequent diagnosis was a grade 2A follicular lymphoma.
Figure 10 Endoscopic features of follicular gastrointestinal lymphomas.
Adapted from Yanai et al[163], 2011.
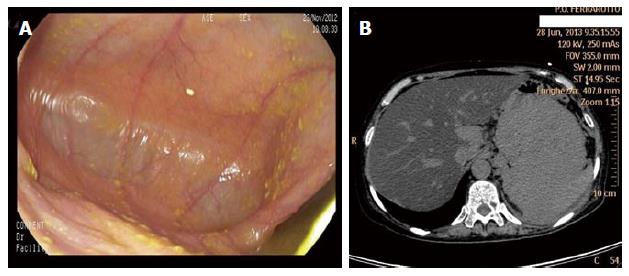
Figure 11 Extra-medullary plasmacytoma with gastric localization arising after treatment for multiple myeloma.
A: Gastroscopy resulted negative for tumor detection; B: CT scan analysis of the upper abdomen showing a bulky mass departing from the stomach.
Figure 12 Frequency of the involved gastrointestinal tract in human immunodeficiency virus-related gastrointestinal lymphomas.
Adapted from Heise[206], 2010.
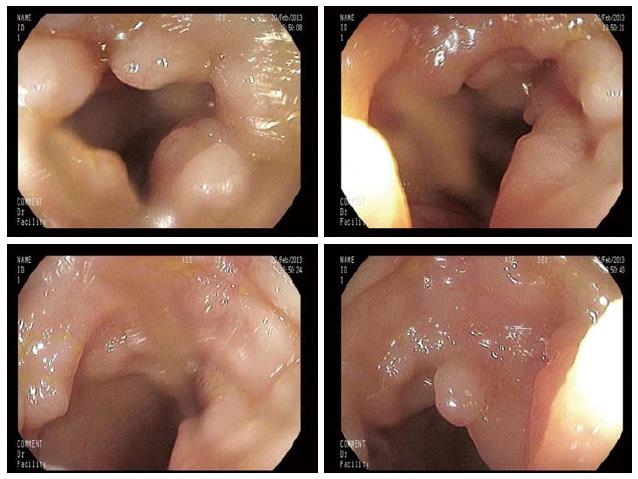
Figure 13 Exophytic erythematous circumferential non-ulcerated mass determining a stenosis of the ileocecal region.
The mass arises from the deep layer and the mucosa presents reddish areas suggestive for lymphomatous infiltration of the cecum (A, B, C).
- Citation: Vetro C, Bonanno G, Giulietti G, Romano A, Conticello C, Chiarenza A, Spina P, Coppolino F, Cunsolo R, Raimondo FD. Rare gastrointestinal lymphomas: The endoscopic investigation. World J Gastrointest Endosc 2015; 7(10): 928-949
- URL: https://www.wjgnet.com/1948-5190/full/v7/i10/928.htm
- DOI: https://dx.doi.org/10.4253/wjge.v7.i10.928


