©The Author(s) 2025.
World J Gastrointest Endosc. Jul 16, 2025; 17(7): 108541
Published online Jul 16, 2025. doi: 10.4253/wjge.v17.i7.108541
Published online Jul 16, 2025. doi: 10.4253/wjge.v17.i7.108541
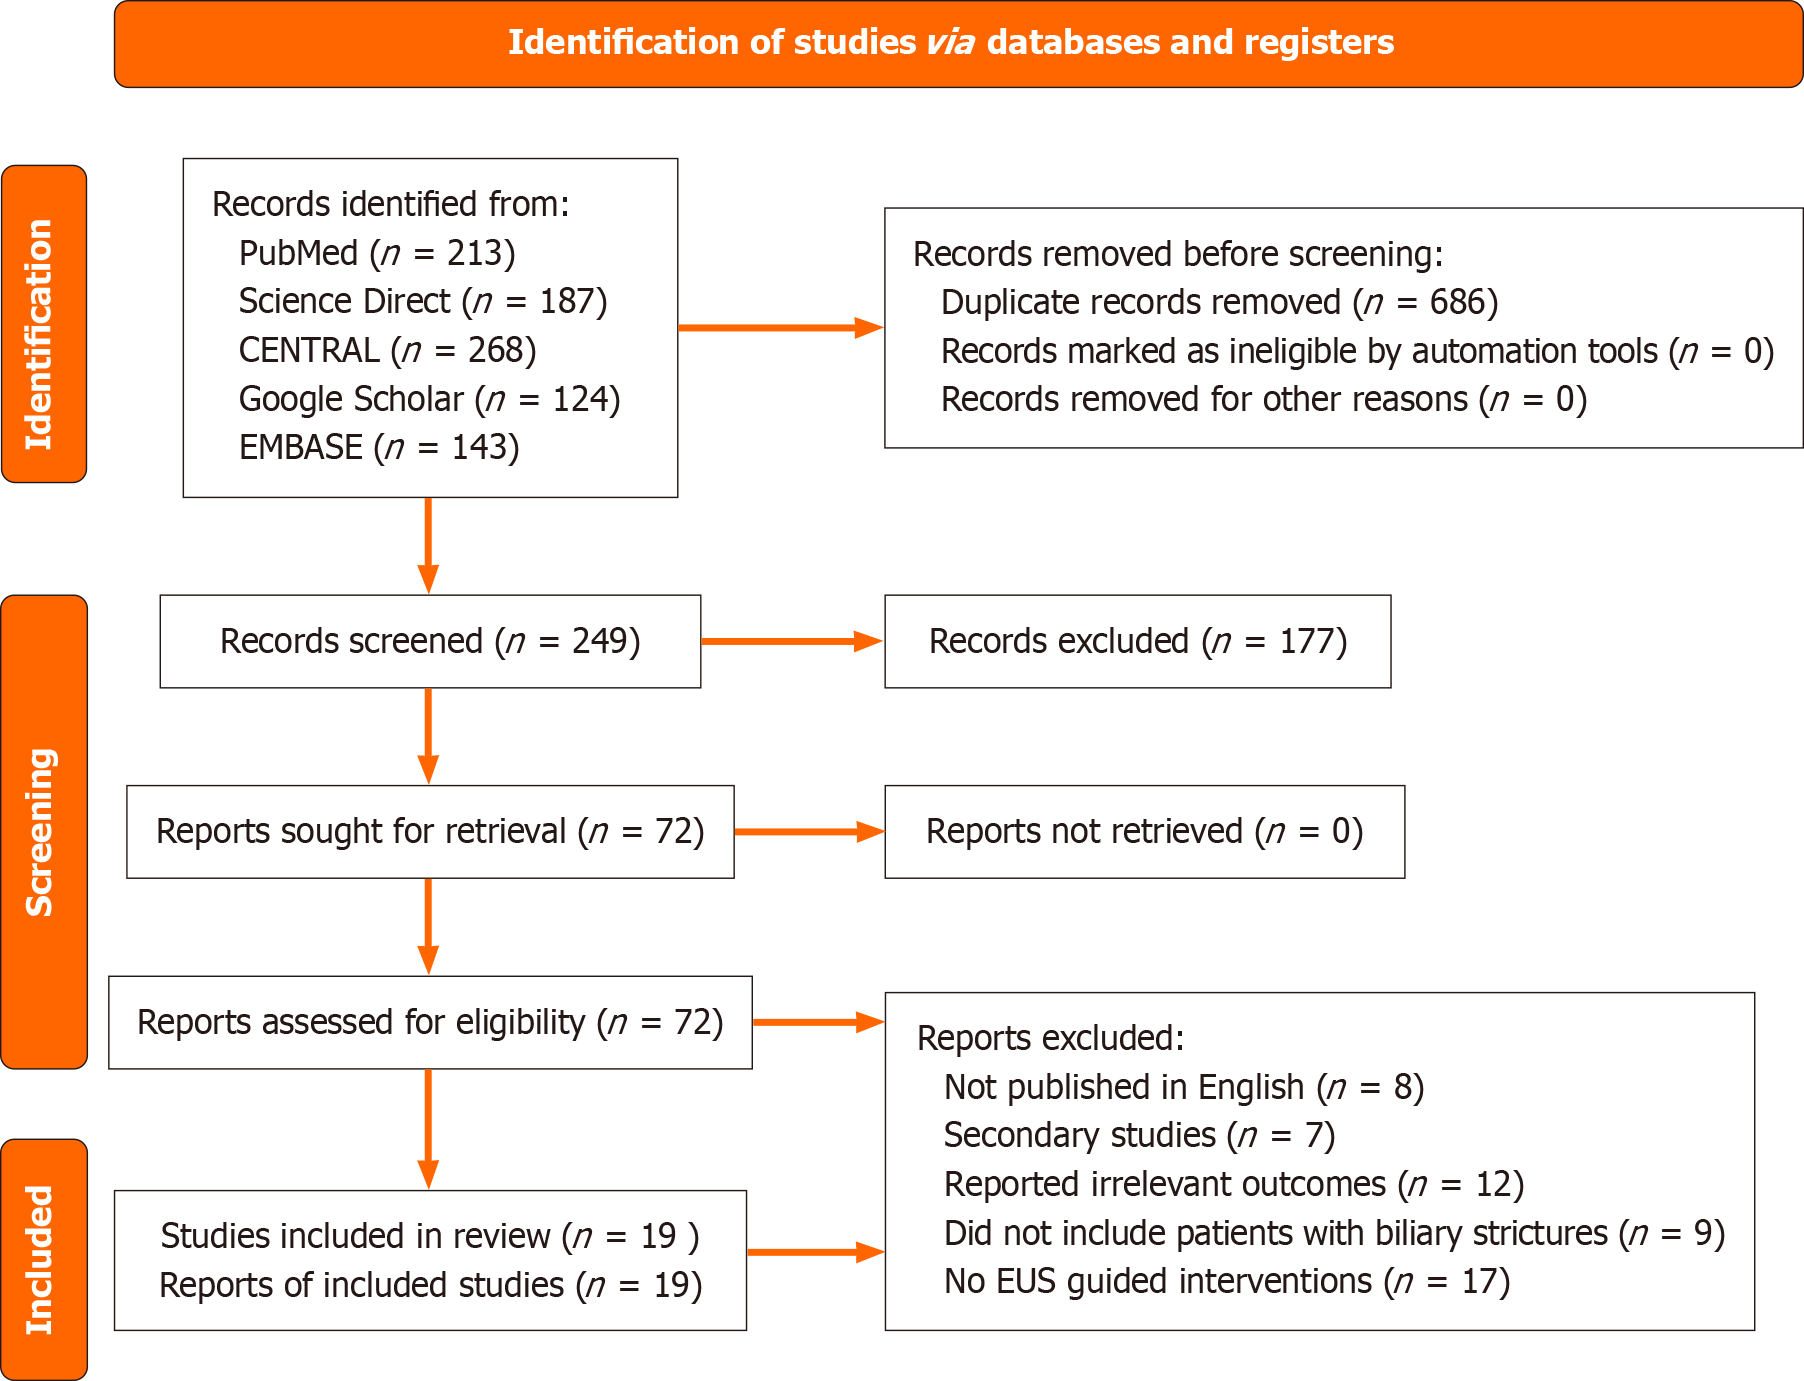
Figure 1 PRISMA diagram summarizing the search strategy.
EUS: Endoscopic ultrasound.
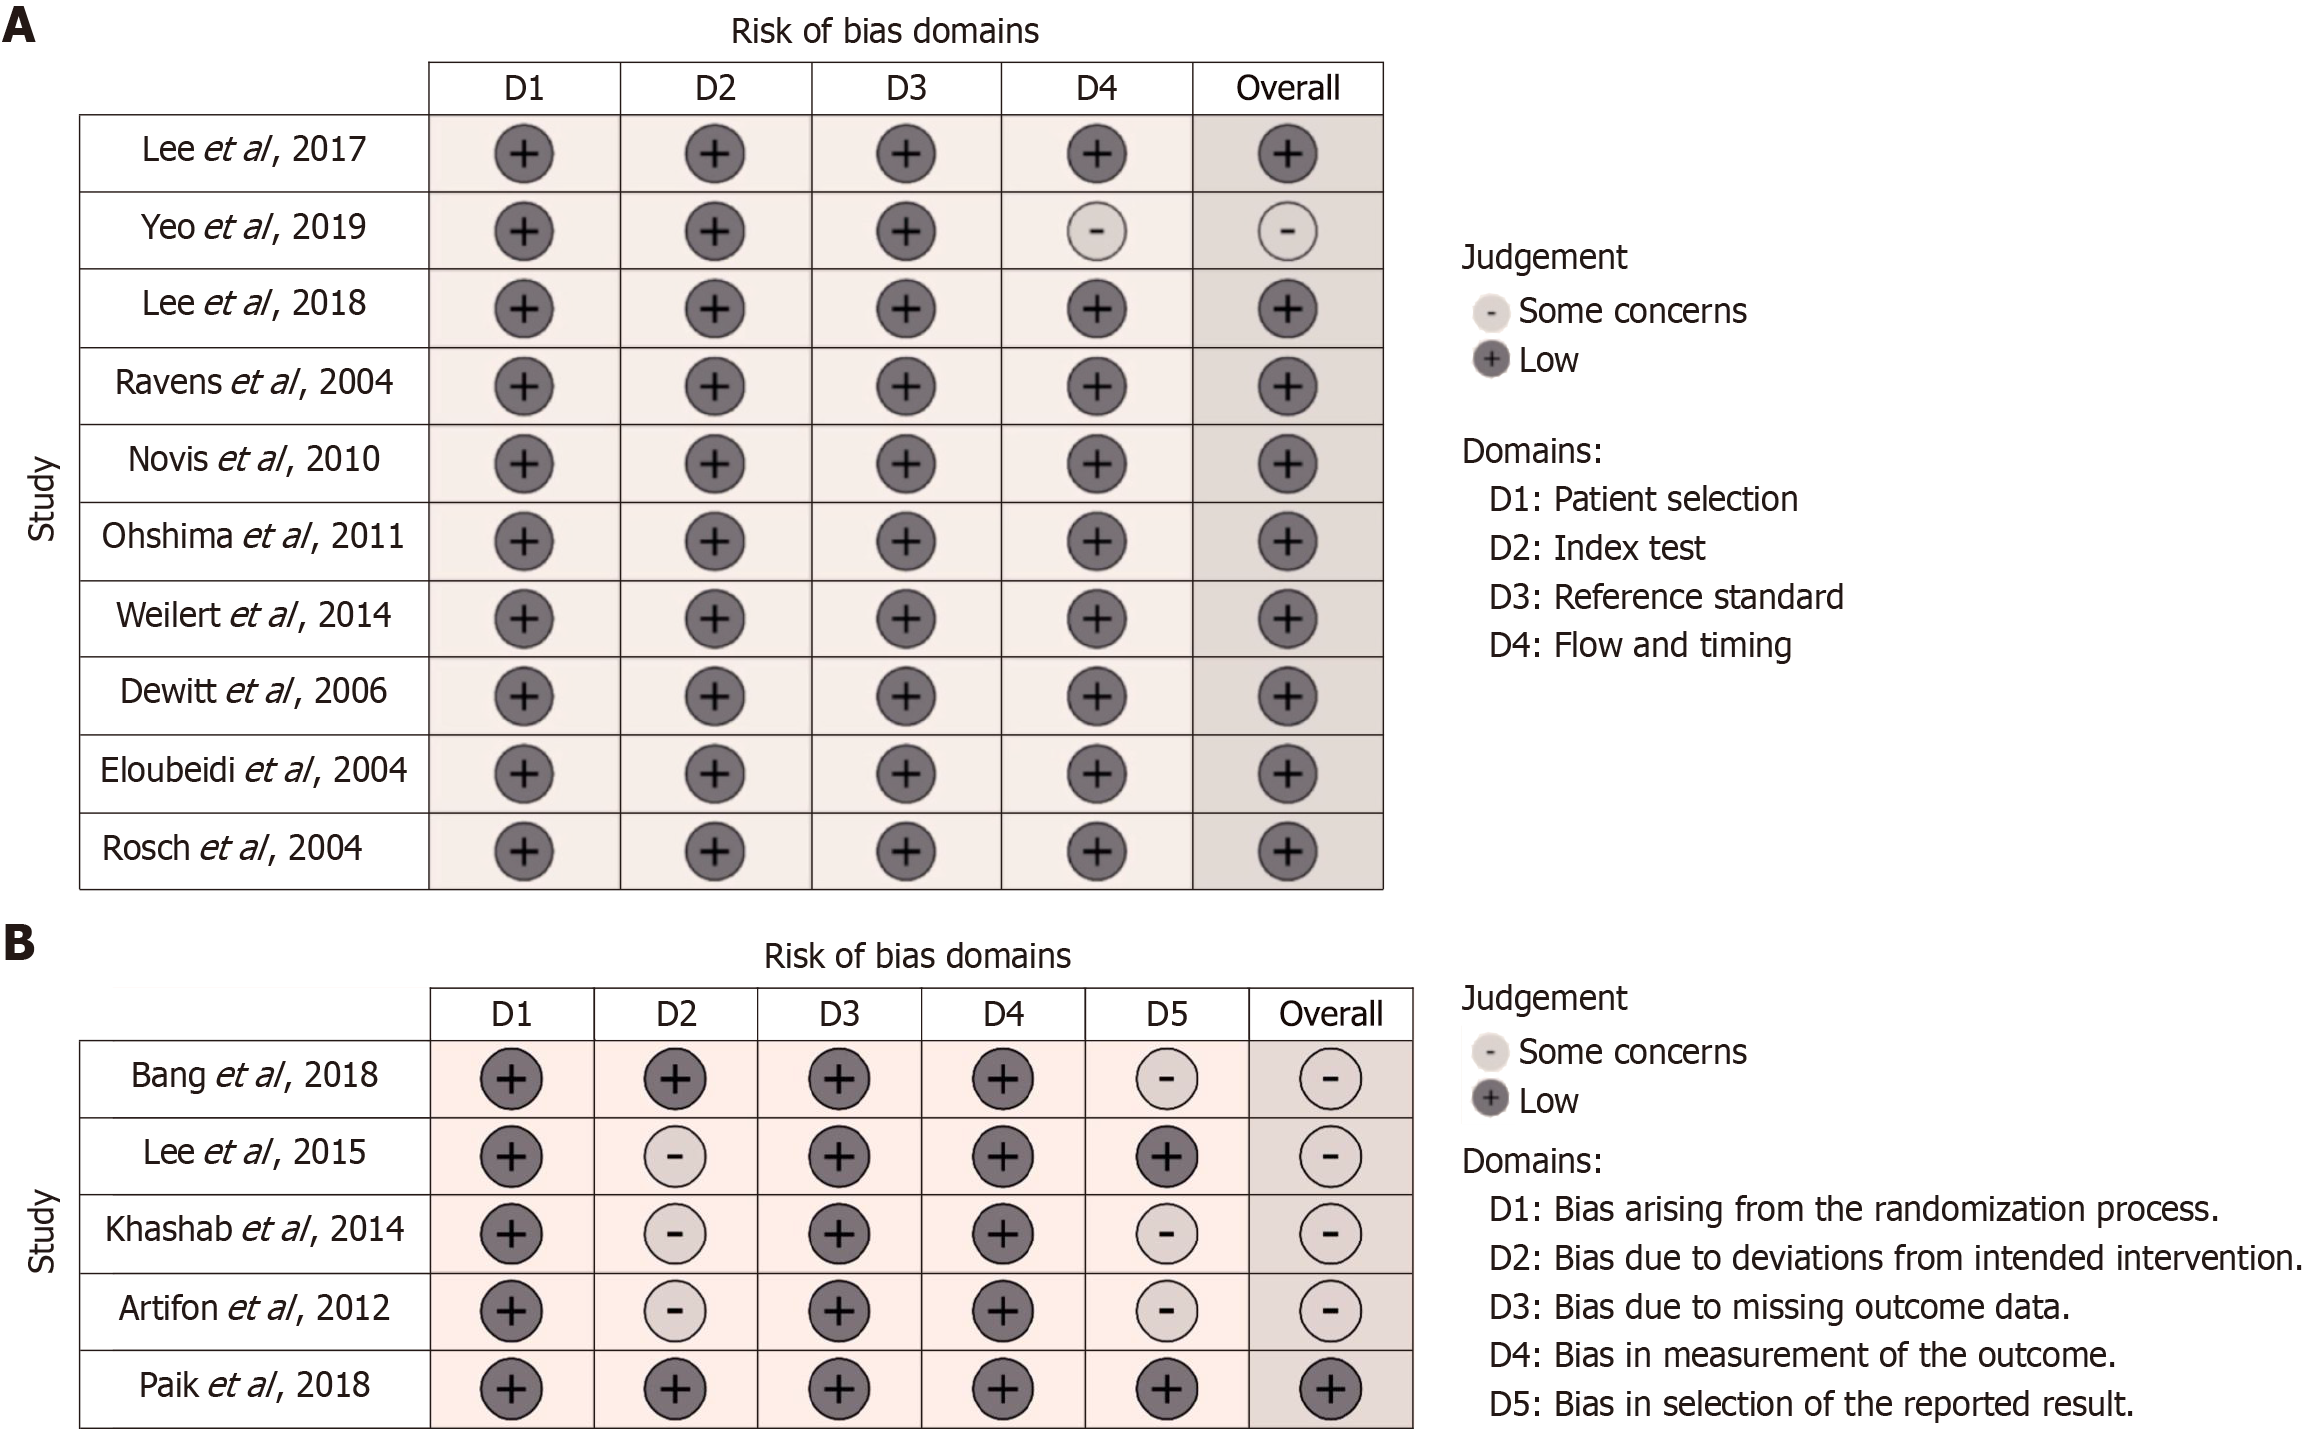
Figure 2 Methodological quality and risk of bias of the included studies.
A: Summary graph of the methodological quality of the included diagnostic test accuracy studies; B: Risk of bias graph of the included randomized controlled trials.
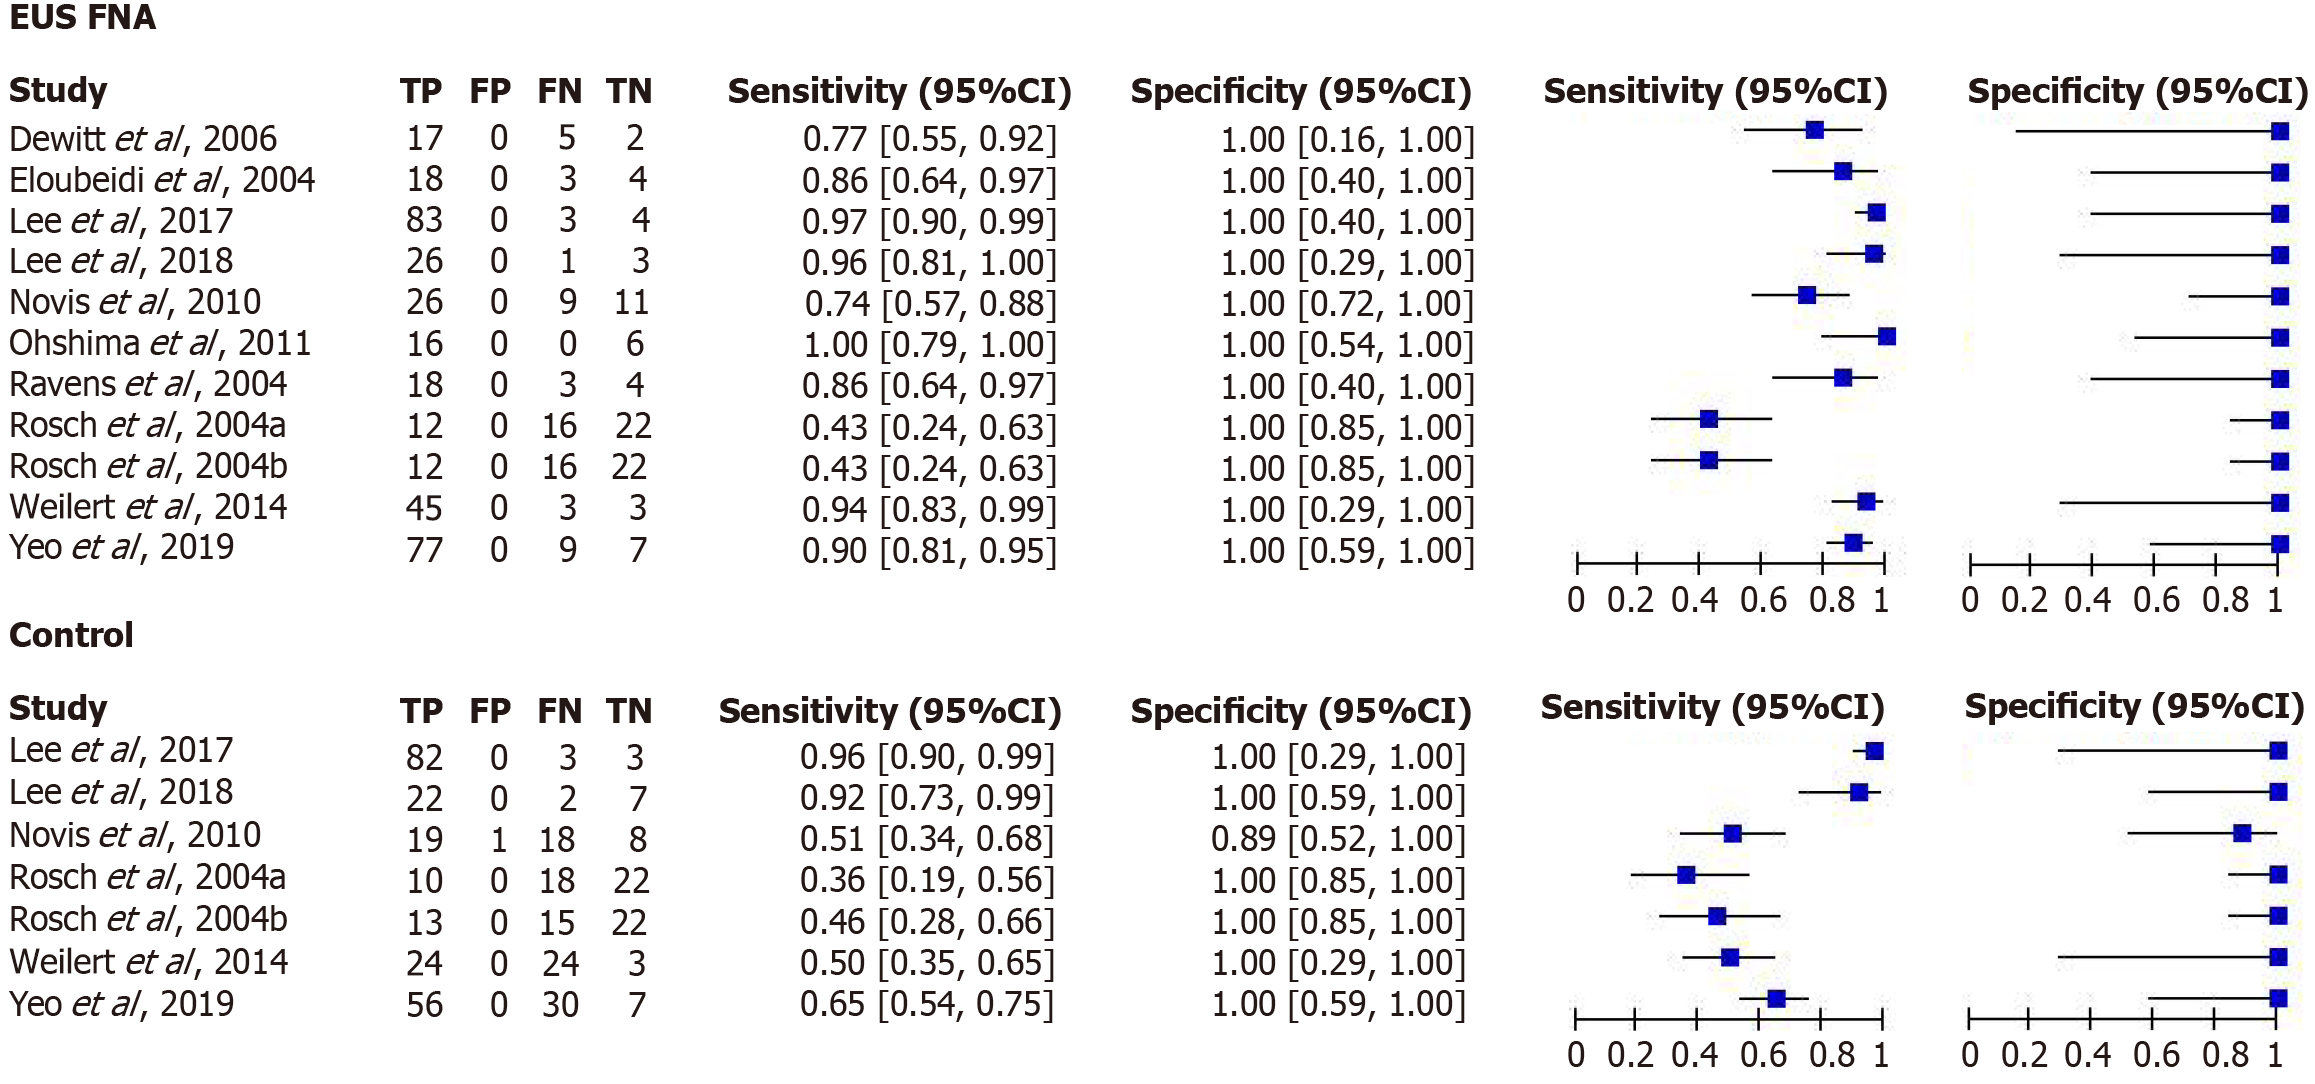
Figure 3 Forest plot showing the diagnostic accuracy of endoscopic ultrasound fine-needle aspiration compared with conventional methods.
EUS: Endoscopic ultrasound; FNA: Fine-needle aspiration; CI: Confidence interval; TP: True positives; FP: False positives; FN: False negatives; TN: True negatives.
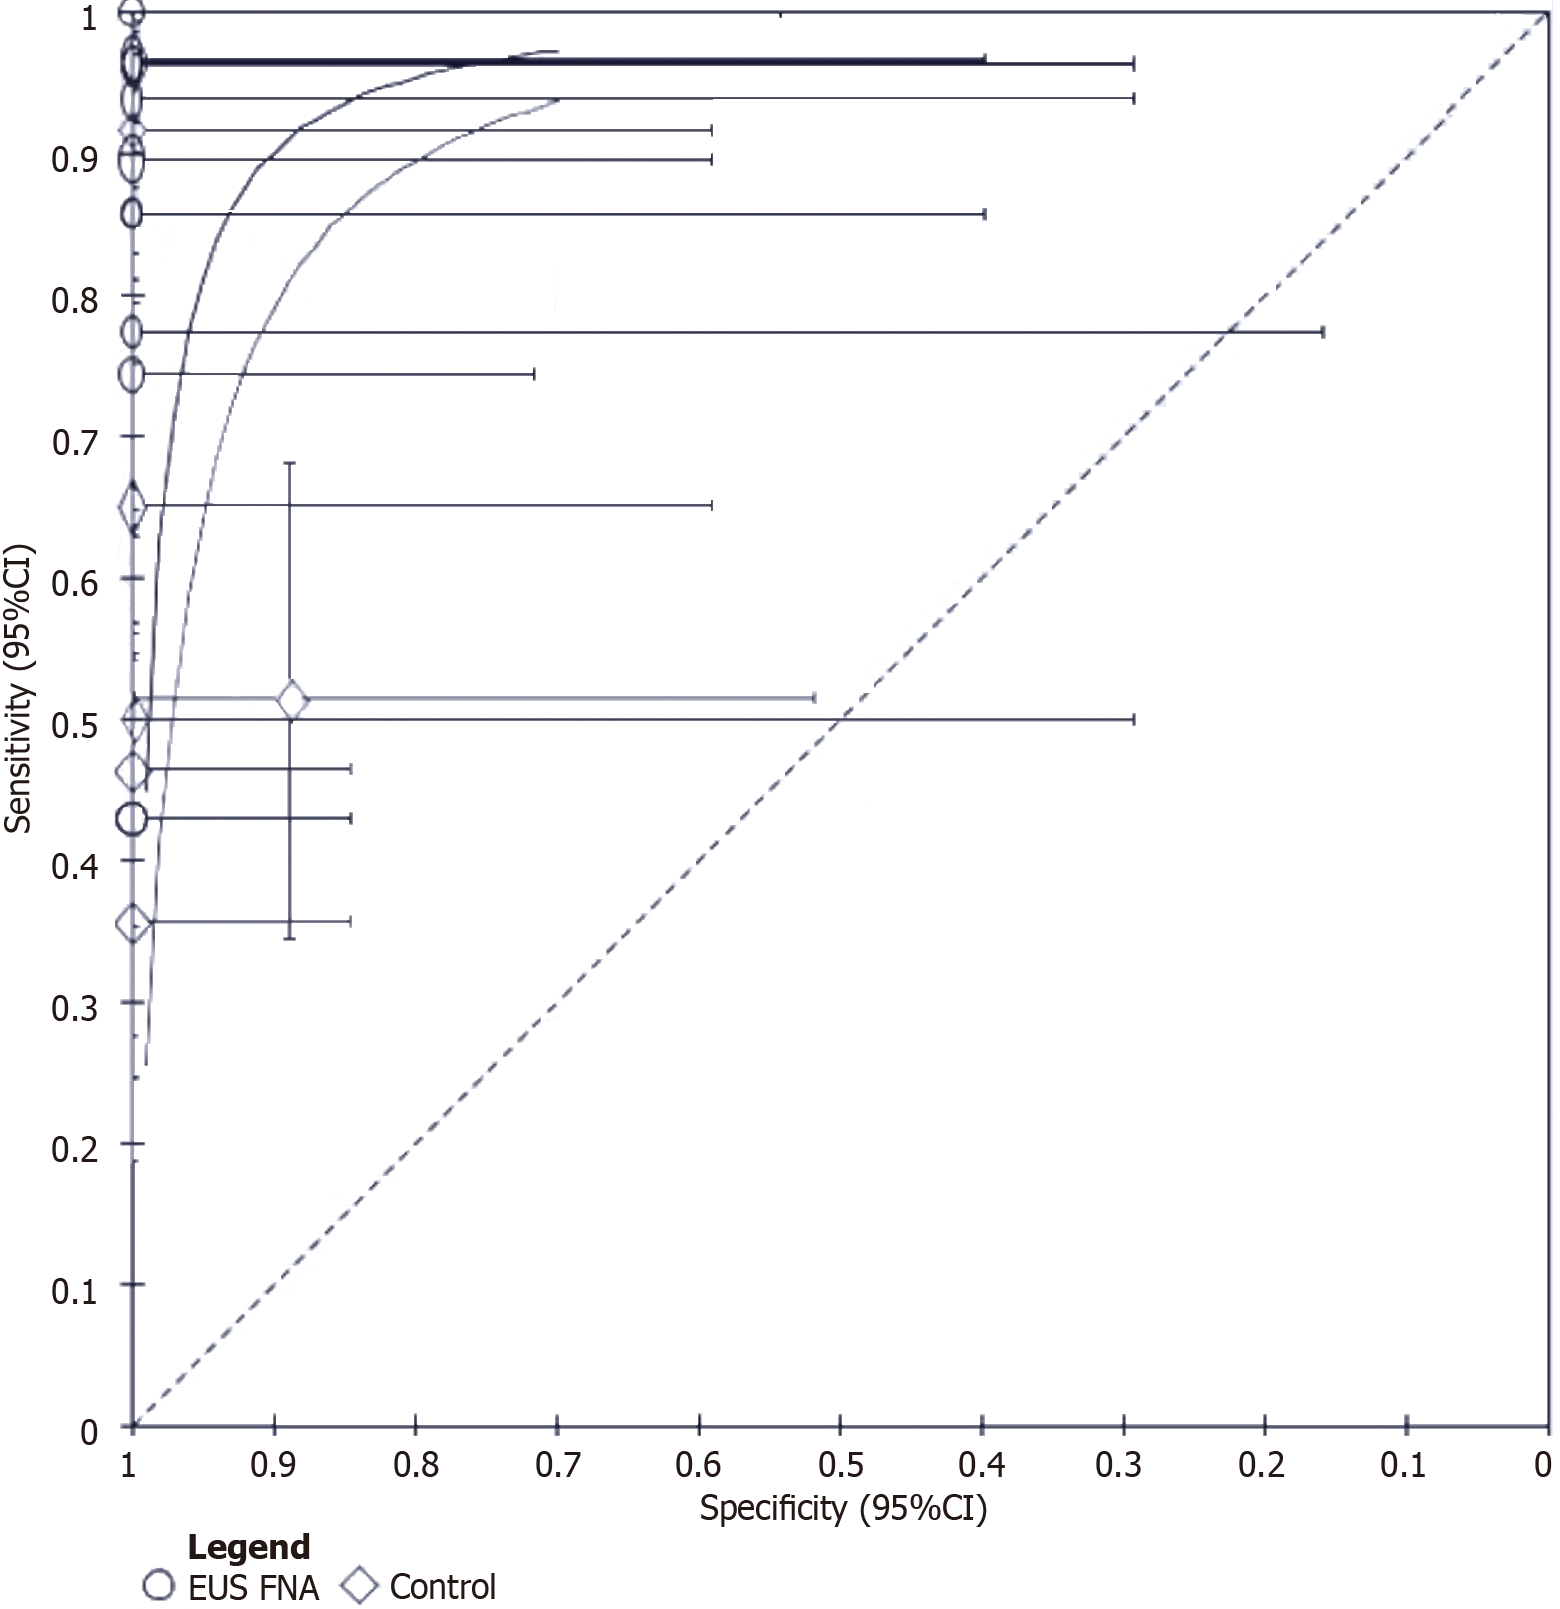
Figure 4 Standardized receiver operating curves curve showing the comparative diagnostic accuracy of endoscopic ultrasound and conventional diagnostic methods.
EUS: Endoscopic ultrasound; FNA: Fine-needle aspiration; CI: Confidence interval.
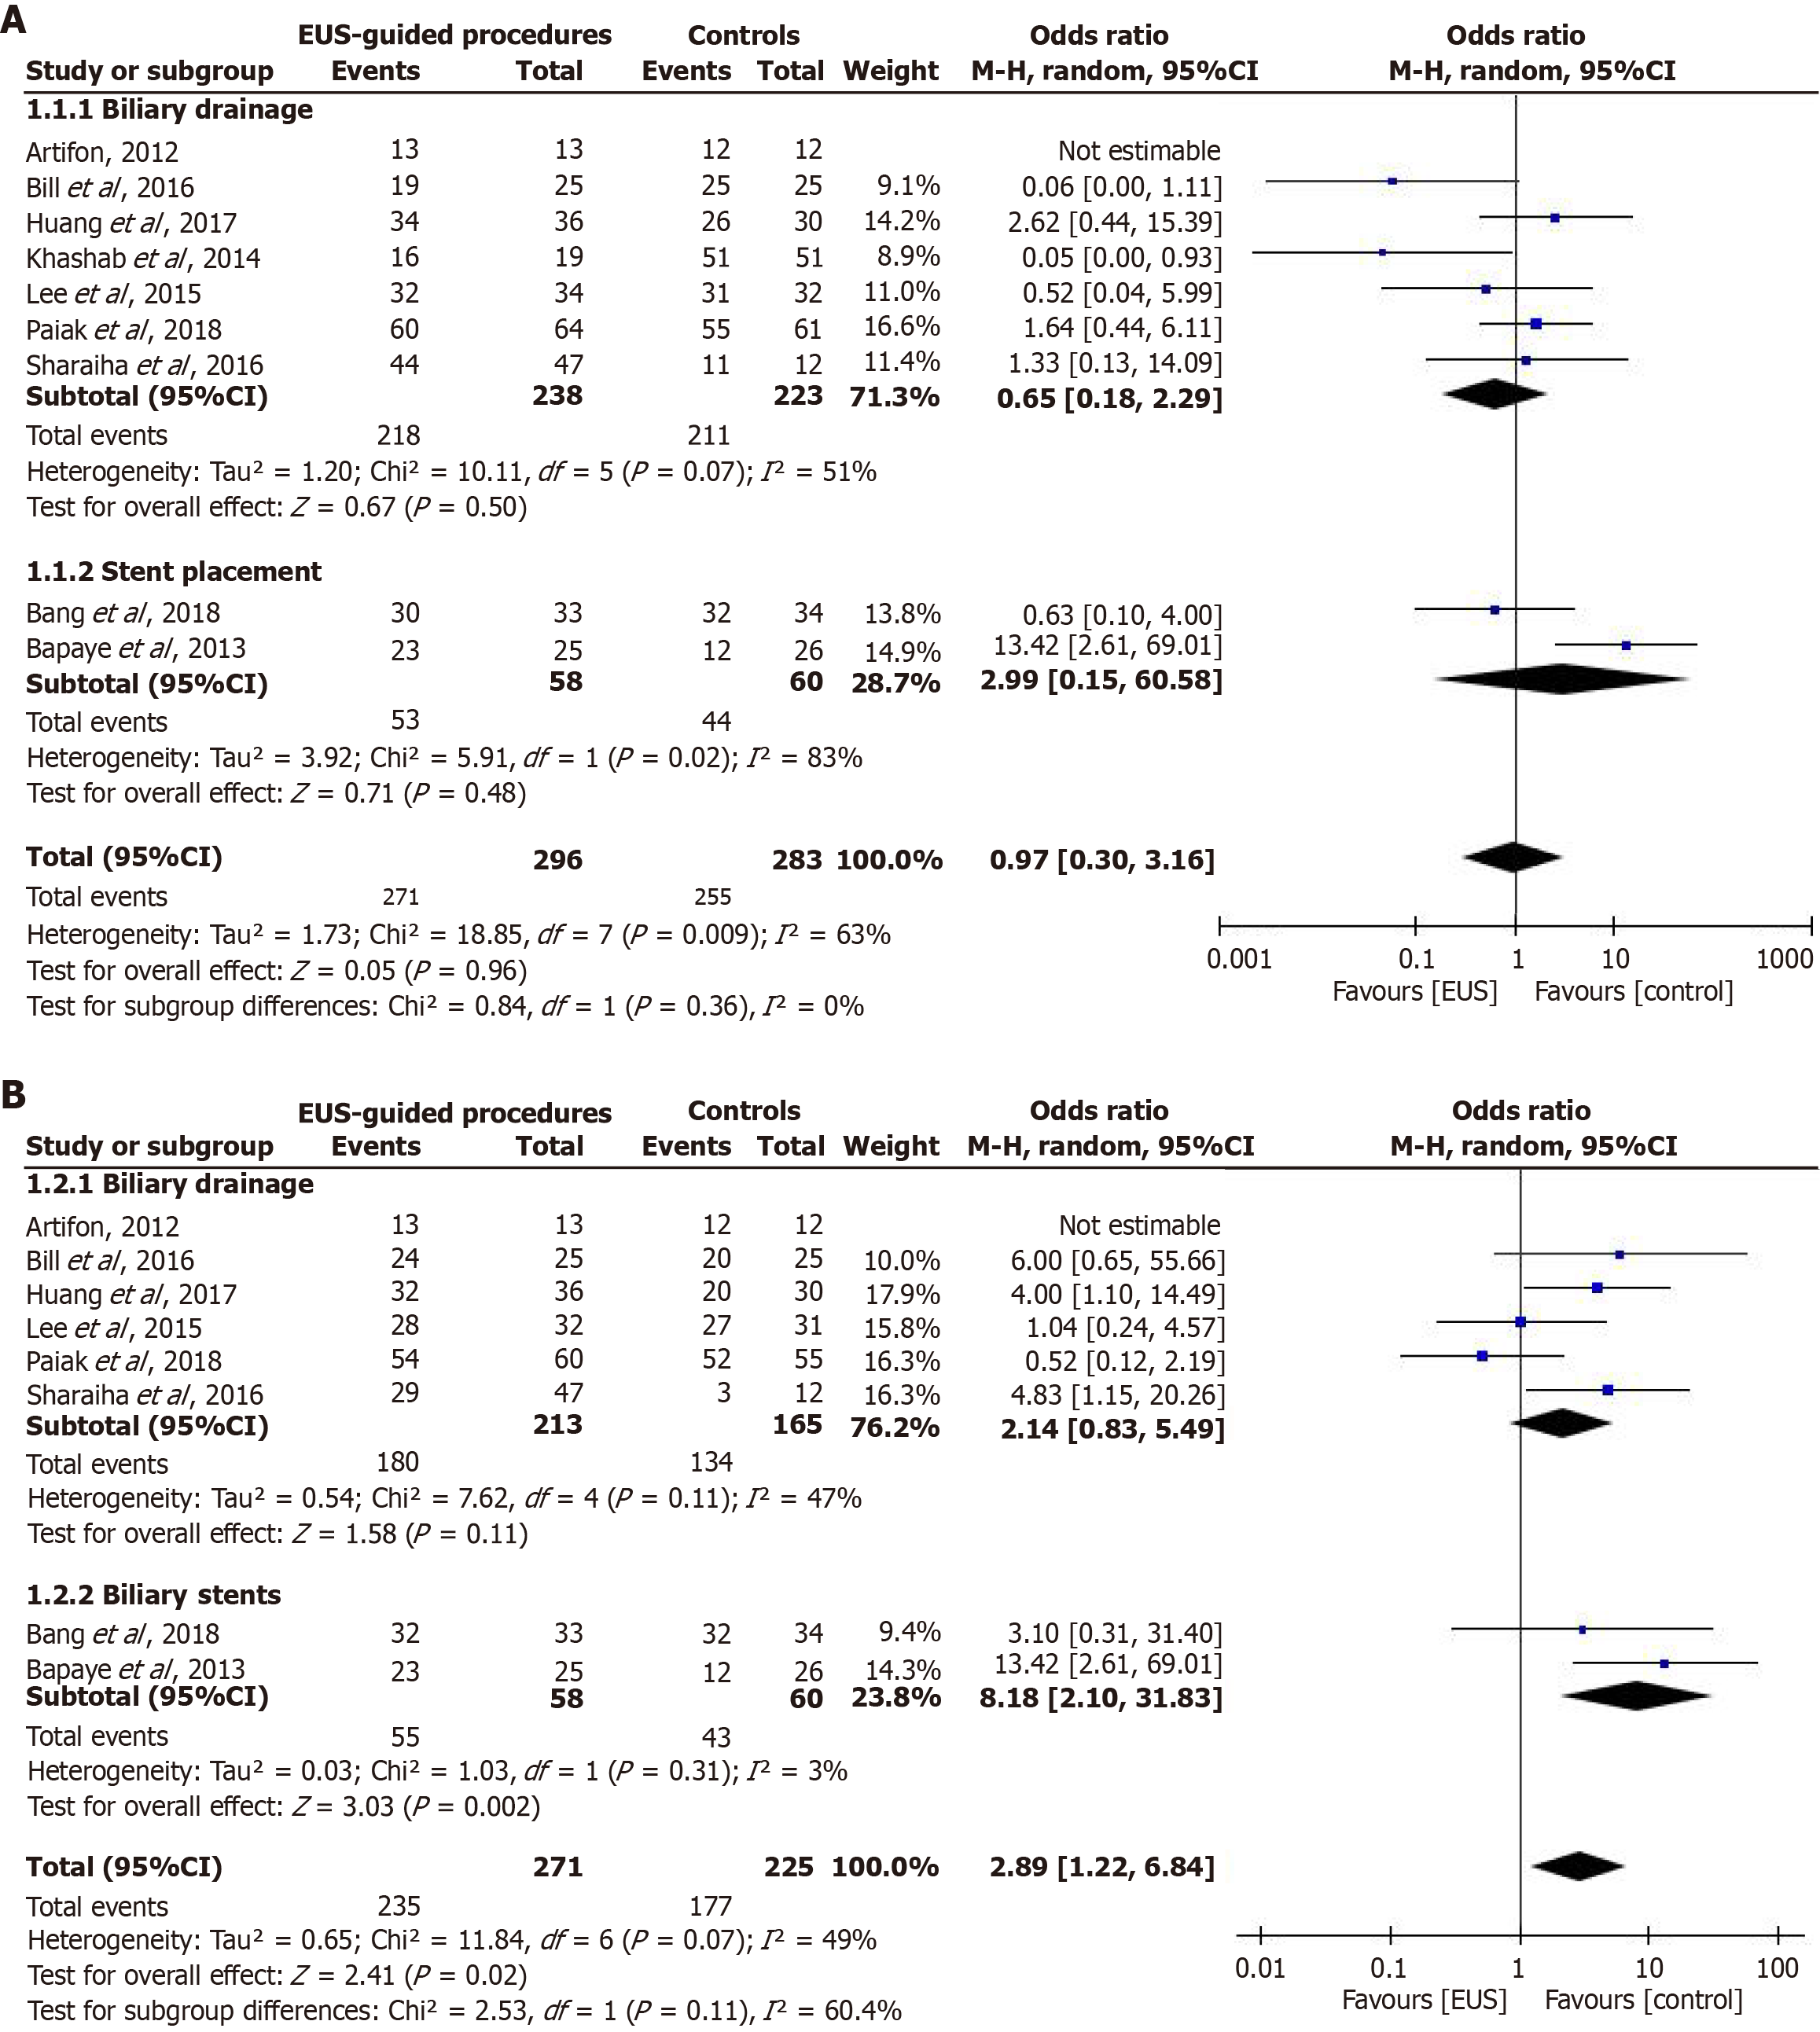
Figure 5 Forest plot.
A: Forest plot showing the technical success rate of endoscopic ultrasound-guided interventions compared to conventional methods for managing biliary strictures; B: Forest plot showing the clinical success rate of endoscopic ultrasound-guided procedures compared to conventional methods. EUS: Endoscopic ultrasound; CI: Confidence interval.
- Citation: Gadour E, Miutescu B, Okasha HH, Albeshir M, Alamri T, Ghoneem E, Burciu C, Popa A, Koppandi O, AlQahtani MS. Evolving role of endoscopic ultrasound in biliary stricture management: A meta-analysis and systematic review. World J Gastrointest Endosc 2025; 17(7): 108541
- URL: https://www.wjgnet.com/1948-5190/full/v17/i7/108541.htm
- DOI: https://dx.doi.org/10.4253/wjge.v17.i7.108541


