Copyright
©The Author(s) 2025.
World J Gastrointest Endosc. Jun 16, 2025; 17(6): 105904
Published online Jun 16, 2025. doi: 10.4253/wjge.v17.i6.105904
Published online Jun 16, 2025. doi: 10.4253/wjge.v17.i6.105904
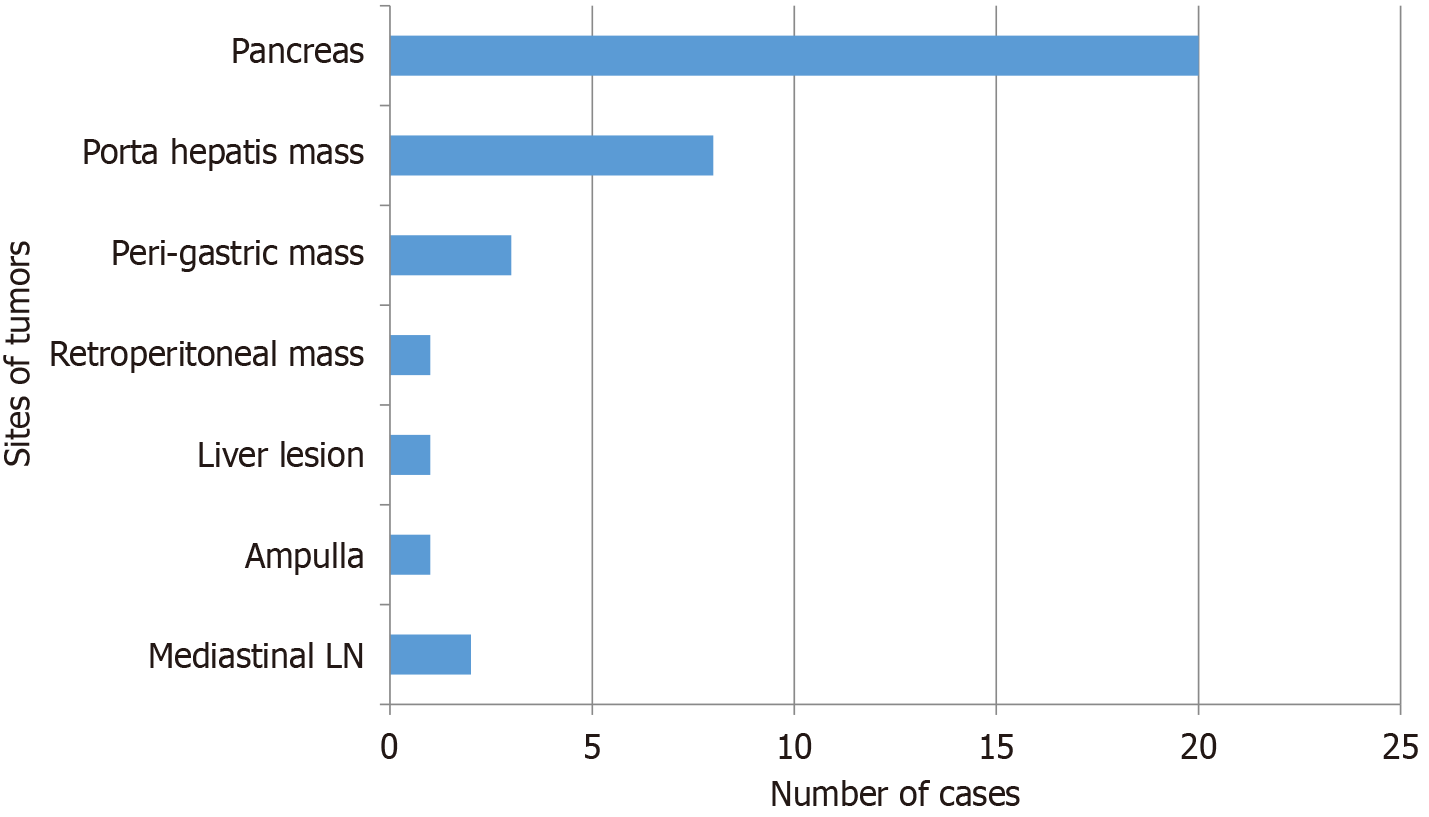
Figure 1
Bar chart showing different pancreato-hepatobiliary regions affected by neuroendocrine tumors (n = 36).
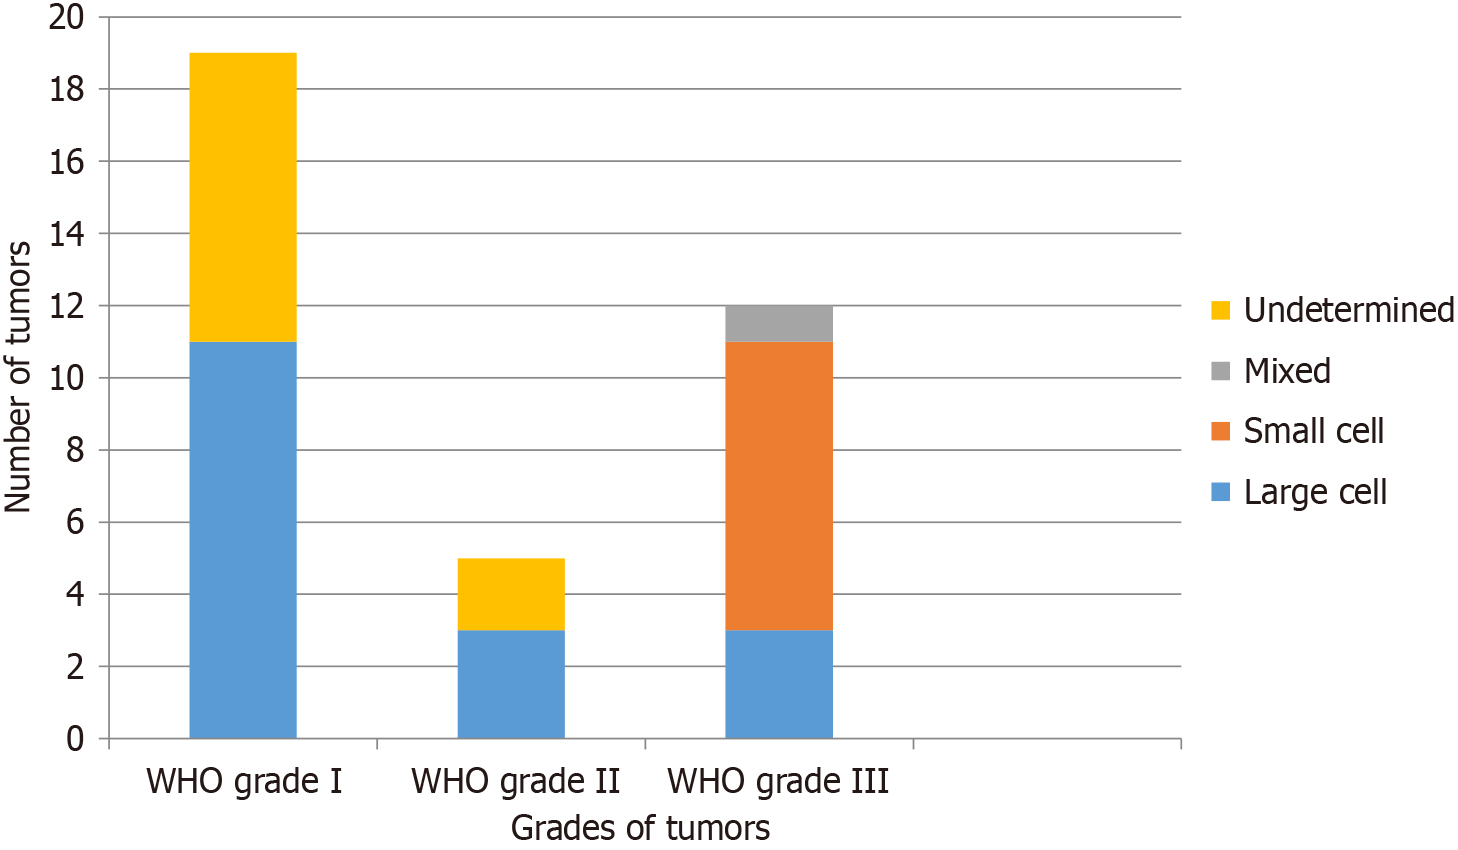
Figure 2
WHO grades and histologies of the pancreato-hepatobiliary neuroendocrine tumors (n = 36).
- Citation: Tasneem AA, Luck NH, Mubarak M. Pancreato-hepatobiliary neuroendocrine tumors diagnosed through endoscopic ultrasound: Clinical characteristics and factors associated with high-grade lesions. World J Gastrointest Endosc 2025; 17(6): 105904
- URL: https://www.wjgnet.com/1948-5190/full/v17/i6/105904.htm
- DOI: https://dx.doi.org/10.4253/wjge.v17.i6.105904


