Copyright
©The Author(s) 2025.
World J Gastrointest Endosc. Apr 16, 2025; 17(4): 104097
Published online Apr 16, 2025. doi: 10.4253/wjge.v17.i4.104097
Published online Apr 16, 2025. doi: 10.4253/wjge.v17.i4.104097
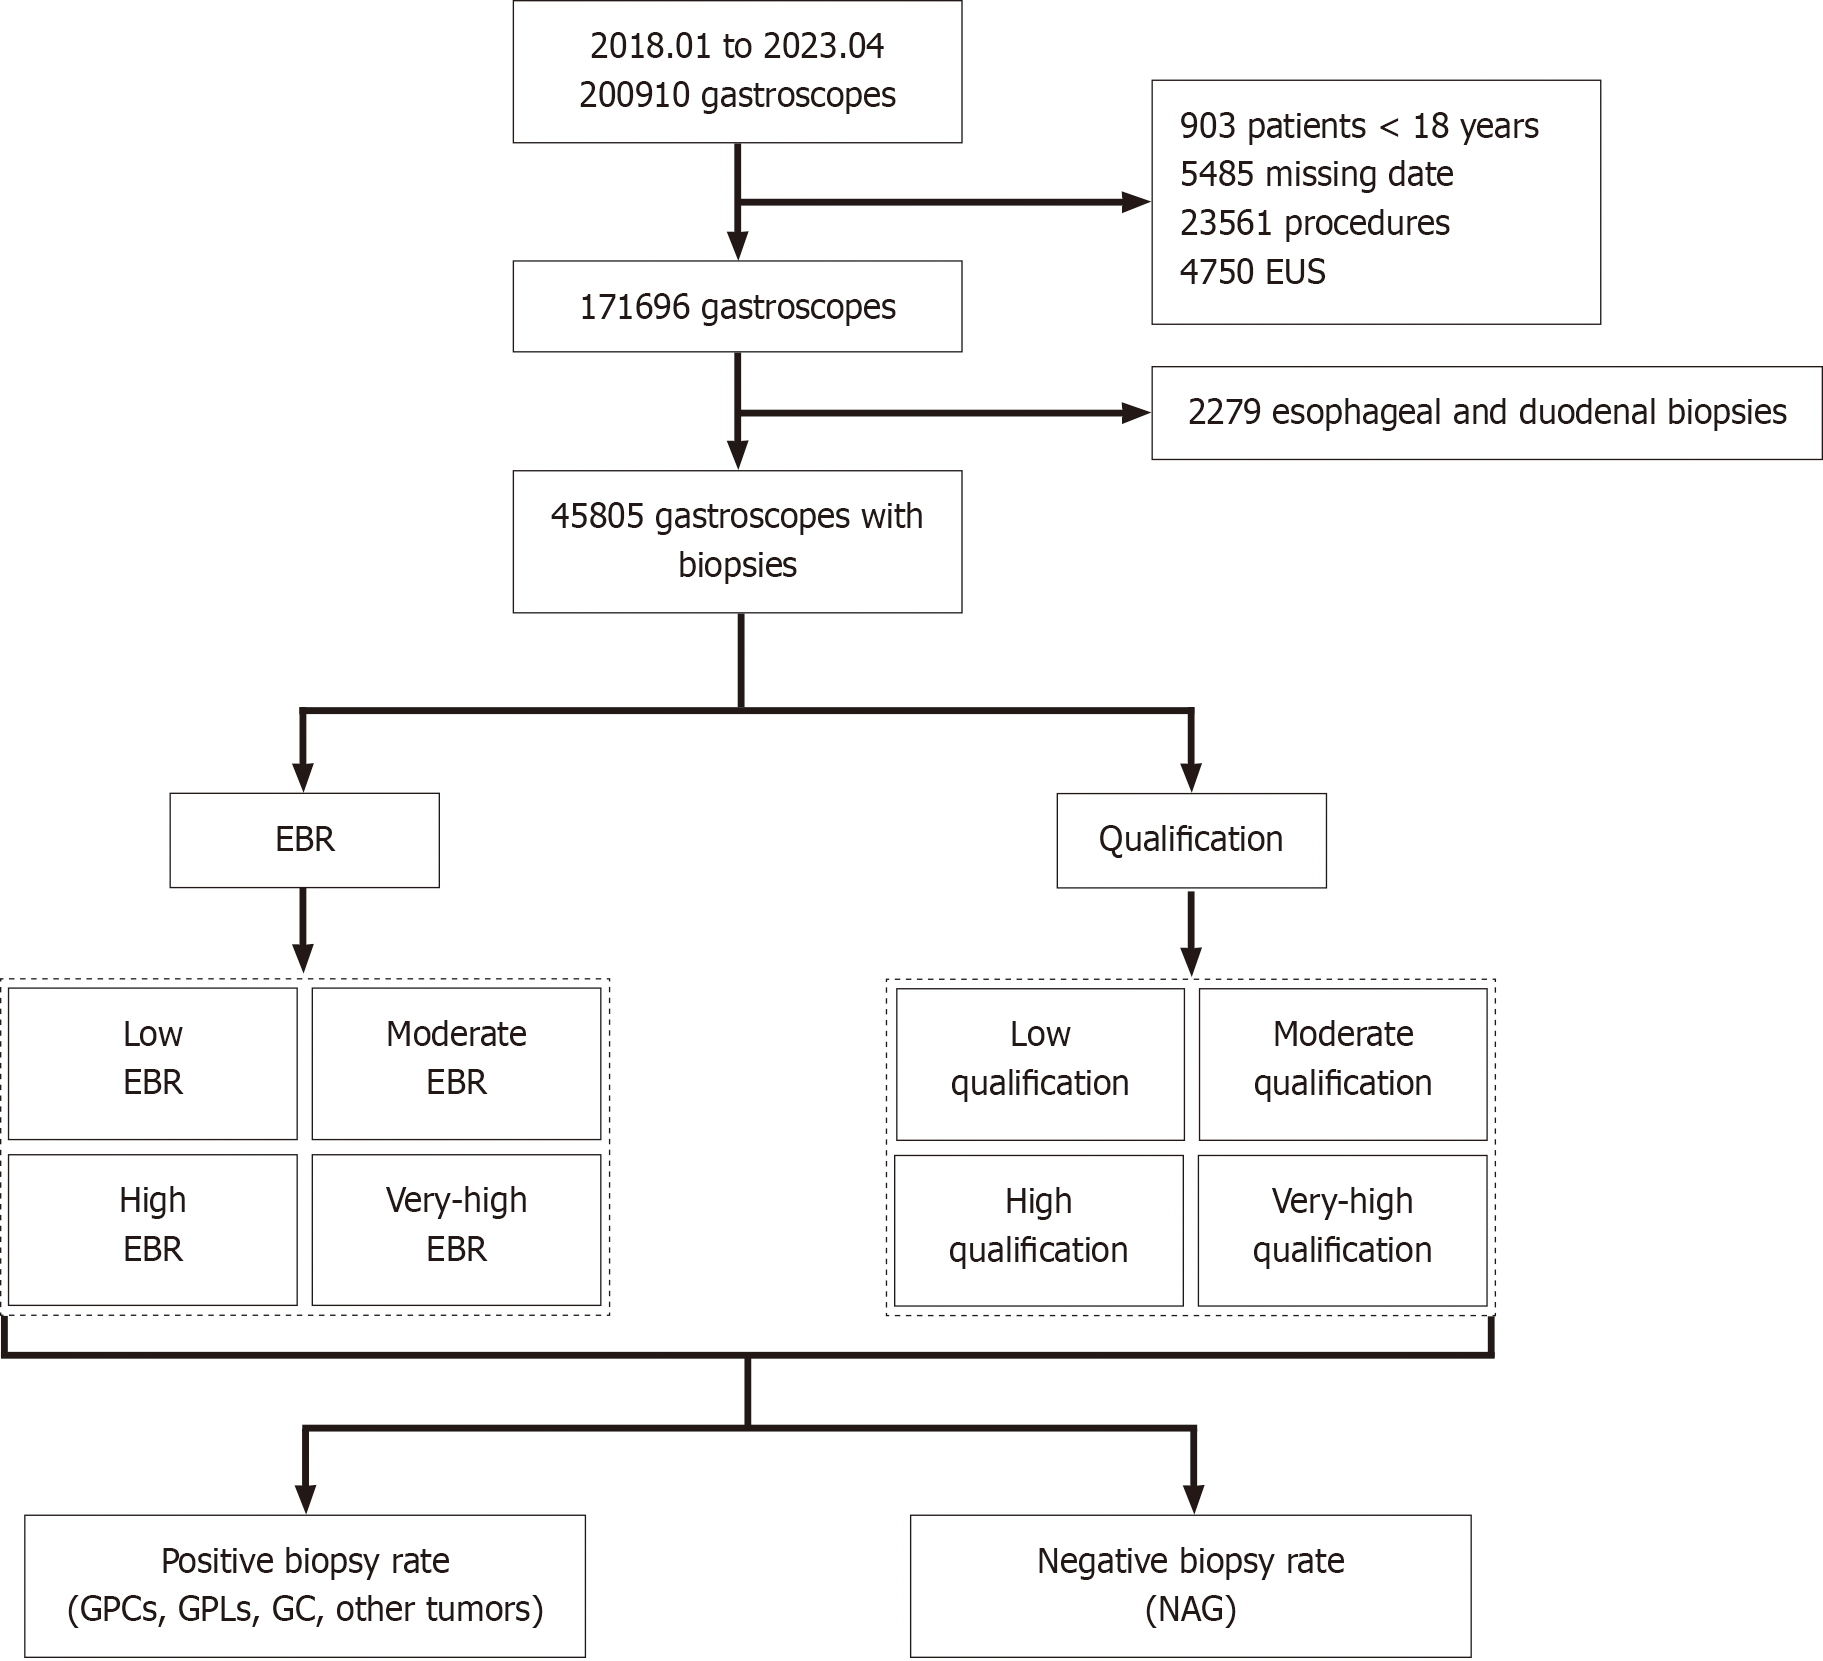
Figure 1 Study population flowchart.
A total of 200910 patients underwent gastroscopy at our center from January 2018 to April 2023 Among them, 903 patients were younger than 18 years old; 5485 patients had incomplete gastroscopy data; 23561 patients underwent endoscopic submucosal dissection, endoscopic mucosal resection, or surgical treatment; 4750 patients underwent endoscopic ultrasonography; and 2279 patients underwent biopsy histopathology of the esophagus and duodenum. Exclusion criteria and reasons: (1) This study focuses on adult patients, so individuals under 18 years old were excluded; (2) To ensure the completeness and reliability of the data for analysis, patients with incomplete gastroscopy examination data were excluded; (3) This study only focuses on gastric biopsy-related issues, so esophageal or duodenal biopsies were excluded; (4) Gastroscopic treatments such as endoscopic submucosal dissection, endoscopic mucosal resection, or gastric surgery were excluded, as these procedures may alter the normal anatomical structure of the stomach and affect the data analysis; and (5) Endoscopic ultrasonography was excluded to avoid introducing additional variables that could interfere with the study’s findings. A total of 36981 patients were excluded, and 169417 patients were included in the analysis. The biopsy specimen of 45805 patients underwent histopathological examination. EUS: Endoscopic ultrasonography; EBR: Endoscopist biopsy rate; GPCs: Gastric precancerous conditions; GPLs: Gastric precancerous lesions; GC: Gastric cancer; NAG: Nonatrophic gastritis.
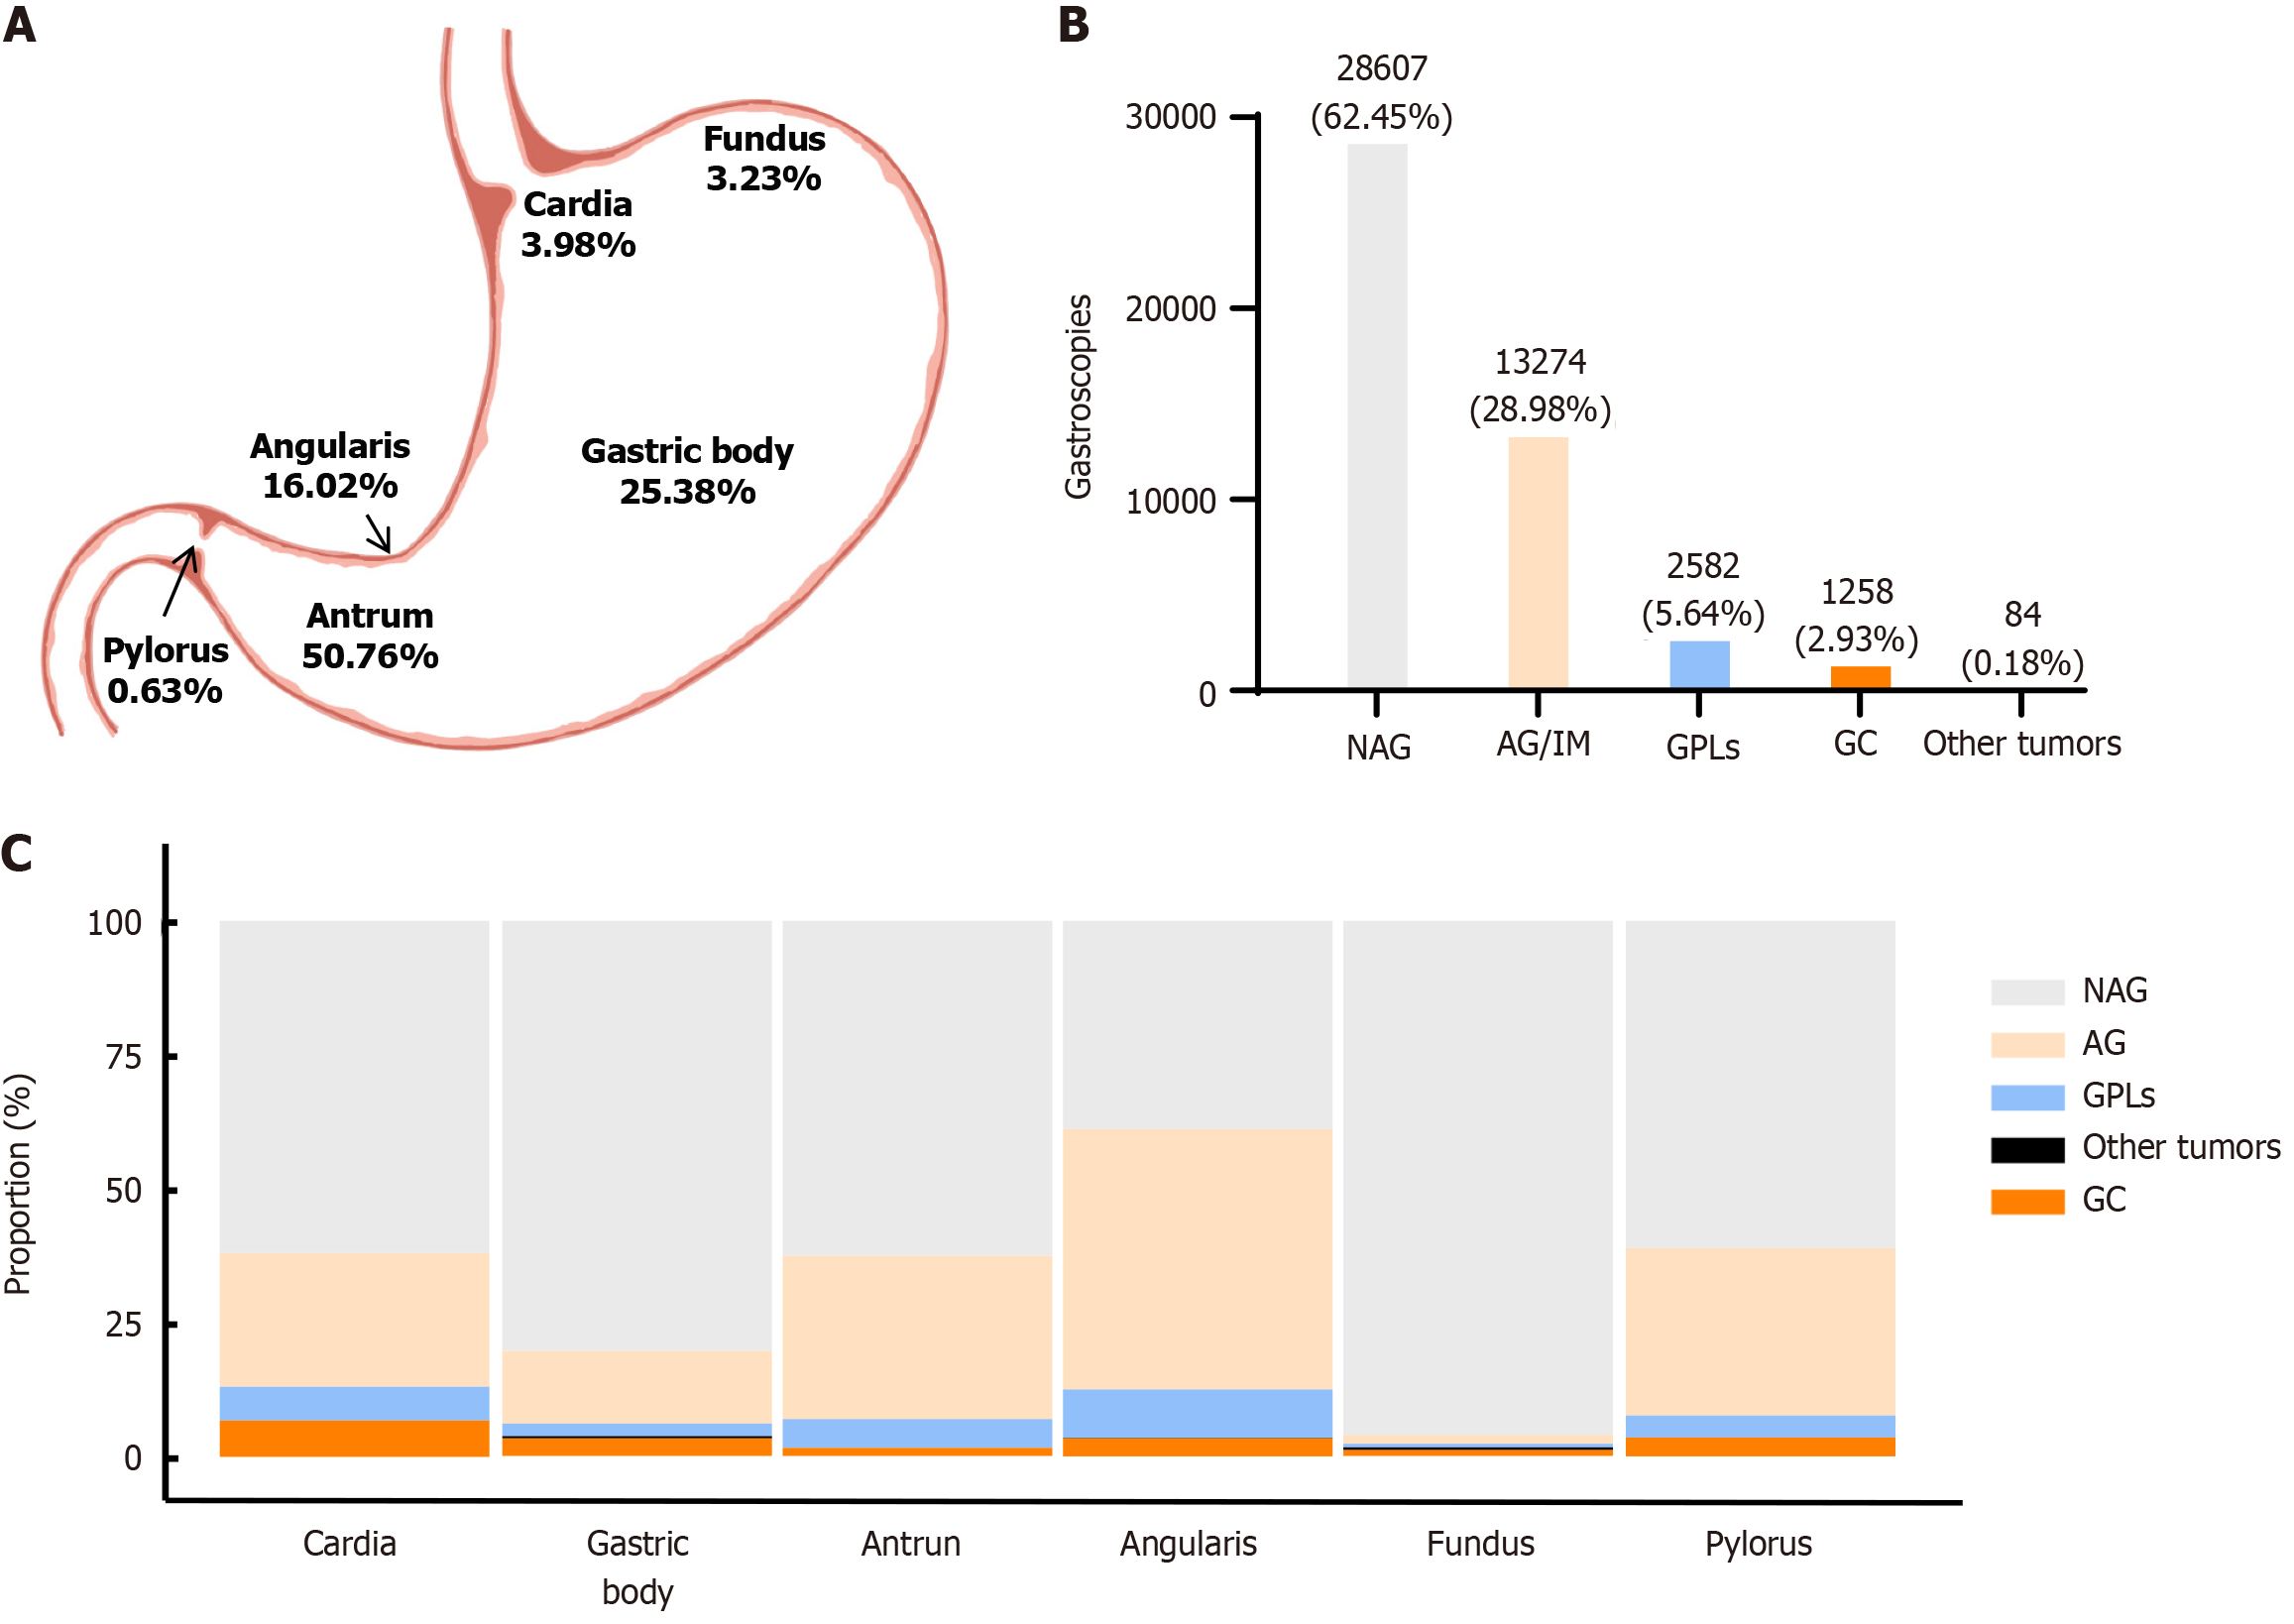
Figure 2 Proportion of biopsies from different sites and distribution of gastric diseases.
A: The proportions of biopsies from different sites are shown; B: The proportions of different diseases are shown. The horizontal axis represents different diseases, and the vertical axis represents different proportions (%); C: The proportions of different diseases in different regions of the stomach are shown. The horizontal axis represents different regions of the stomach, and the vertical axis represents different proportions (%). NAG: Nonatrophic gastritis; AG/IM: Atrophic gastritis/intestinal metaplasia; GPLs: Gastric precancerous lesions; GC: Gastric cancer.
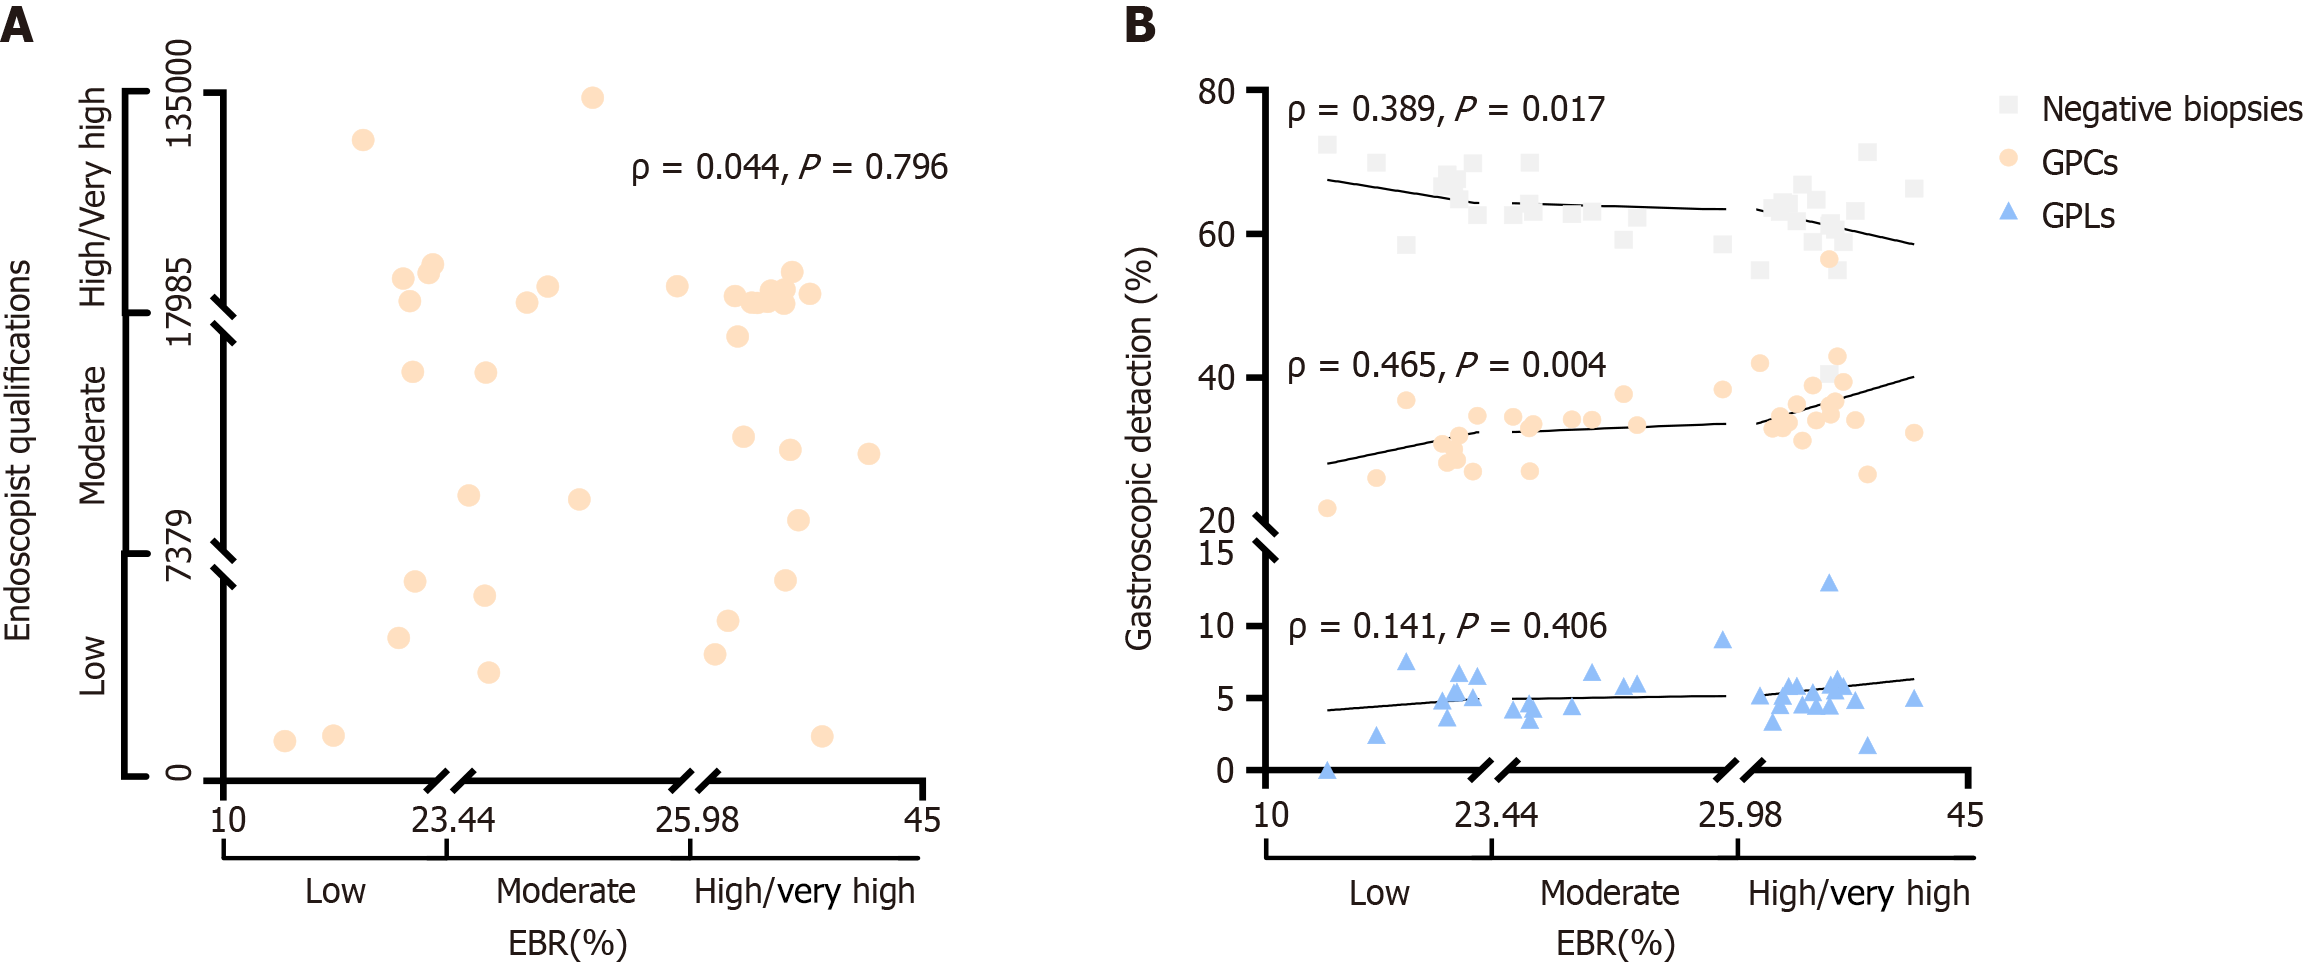
Figure 3 Relationships between endoscopist biopsy rate, endoscopist qualifications and endoscopic detection.
A: The relationship between endoscopist biopsy rate (EBR) and endoscopist qualifications is shown. The horizontal axis represents different groups of EBR (low, moderate, high/very high), and the vertical axis represents different groups of endoscopist qualifications (low, moderate, high/very high); B: The relationship between EBR and the positive detection rate is shown. The horizontal axis represents different EBR groups (low, moderate, high/very high), and the vertical axis represents endoscopic detection rates for different diseases (%). ρ: Spearman’s correlation coefficient. P < 0.05 indicates statistical significance. EBR: Endoscopist biopsy rate; GPCs: Gastric precancerous conditions; GPLs: Gastric precancerous lesions.
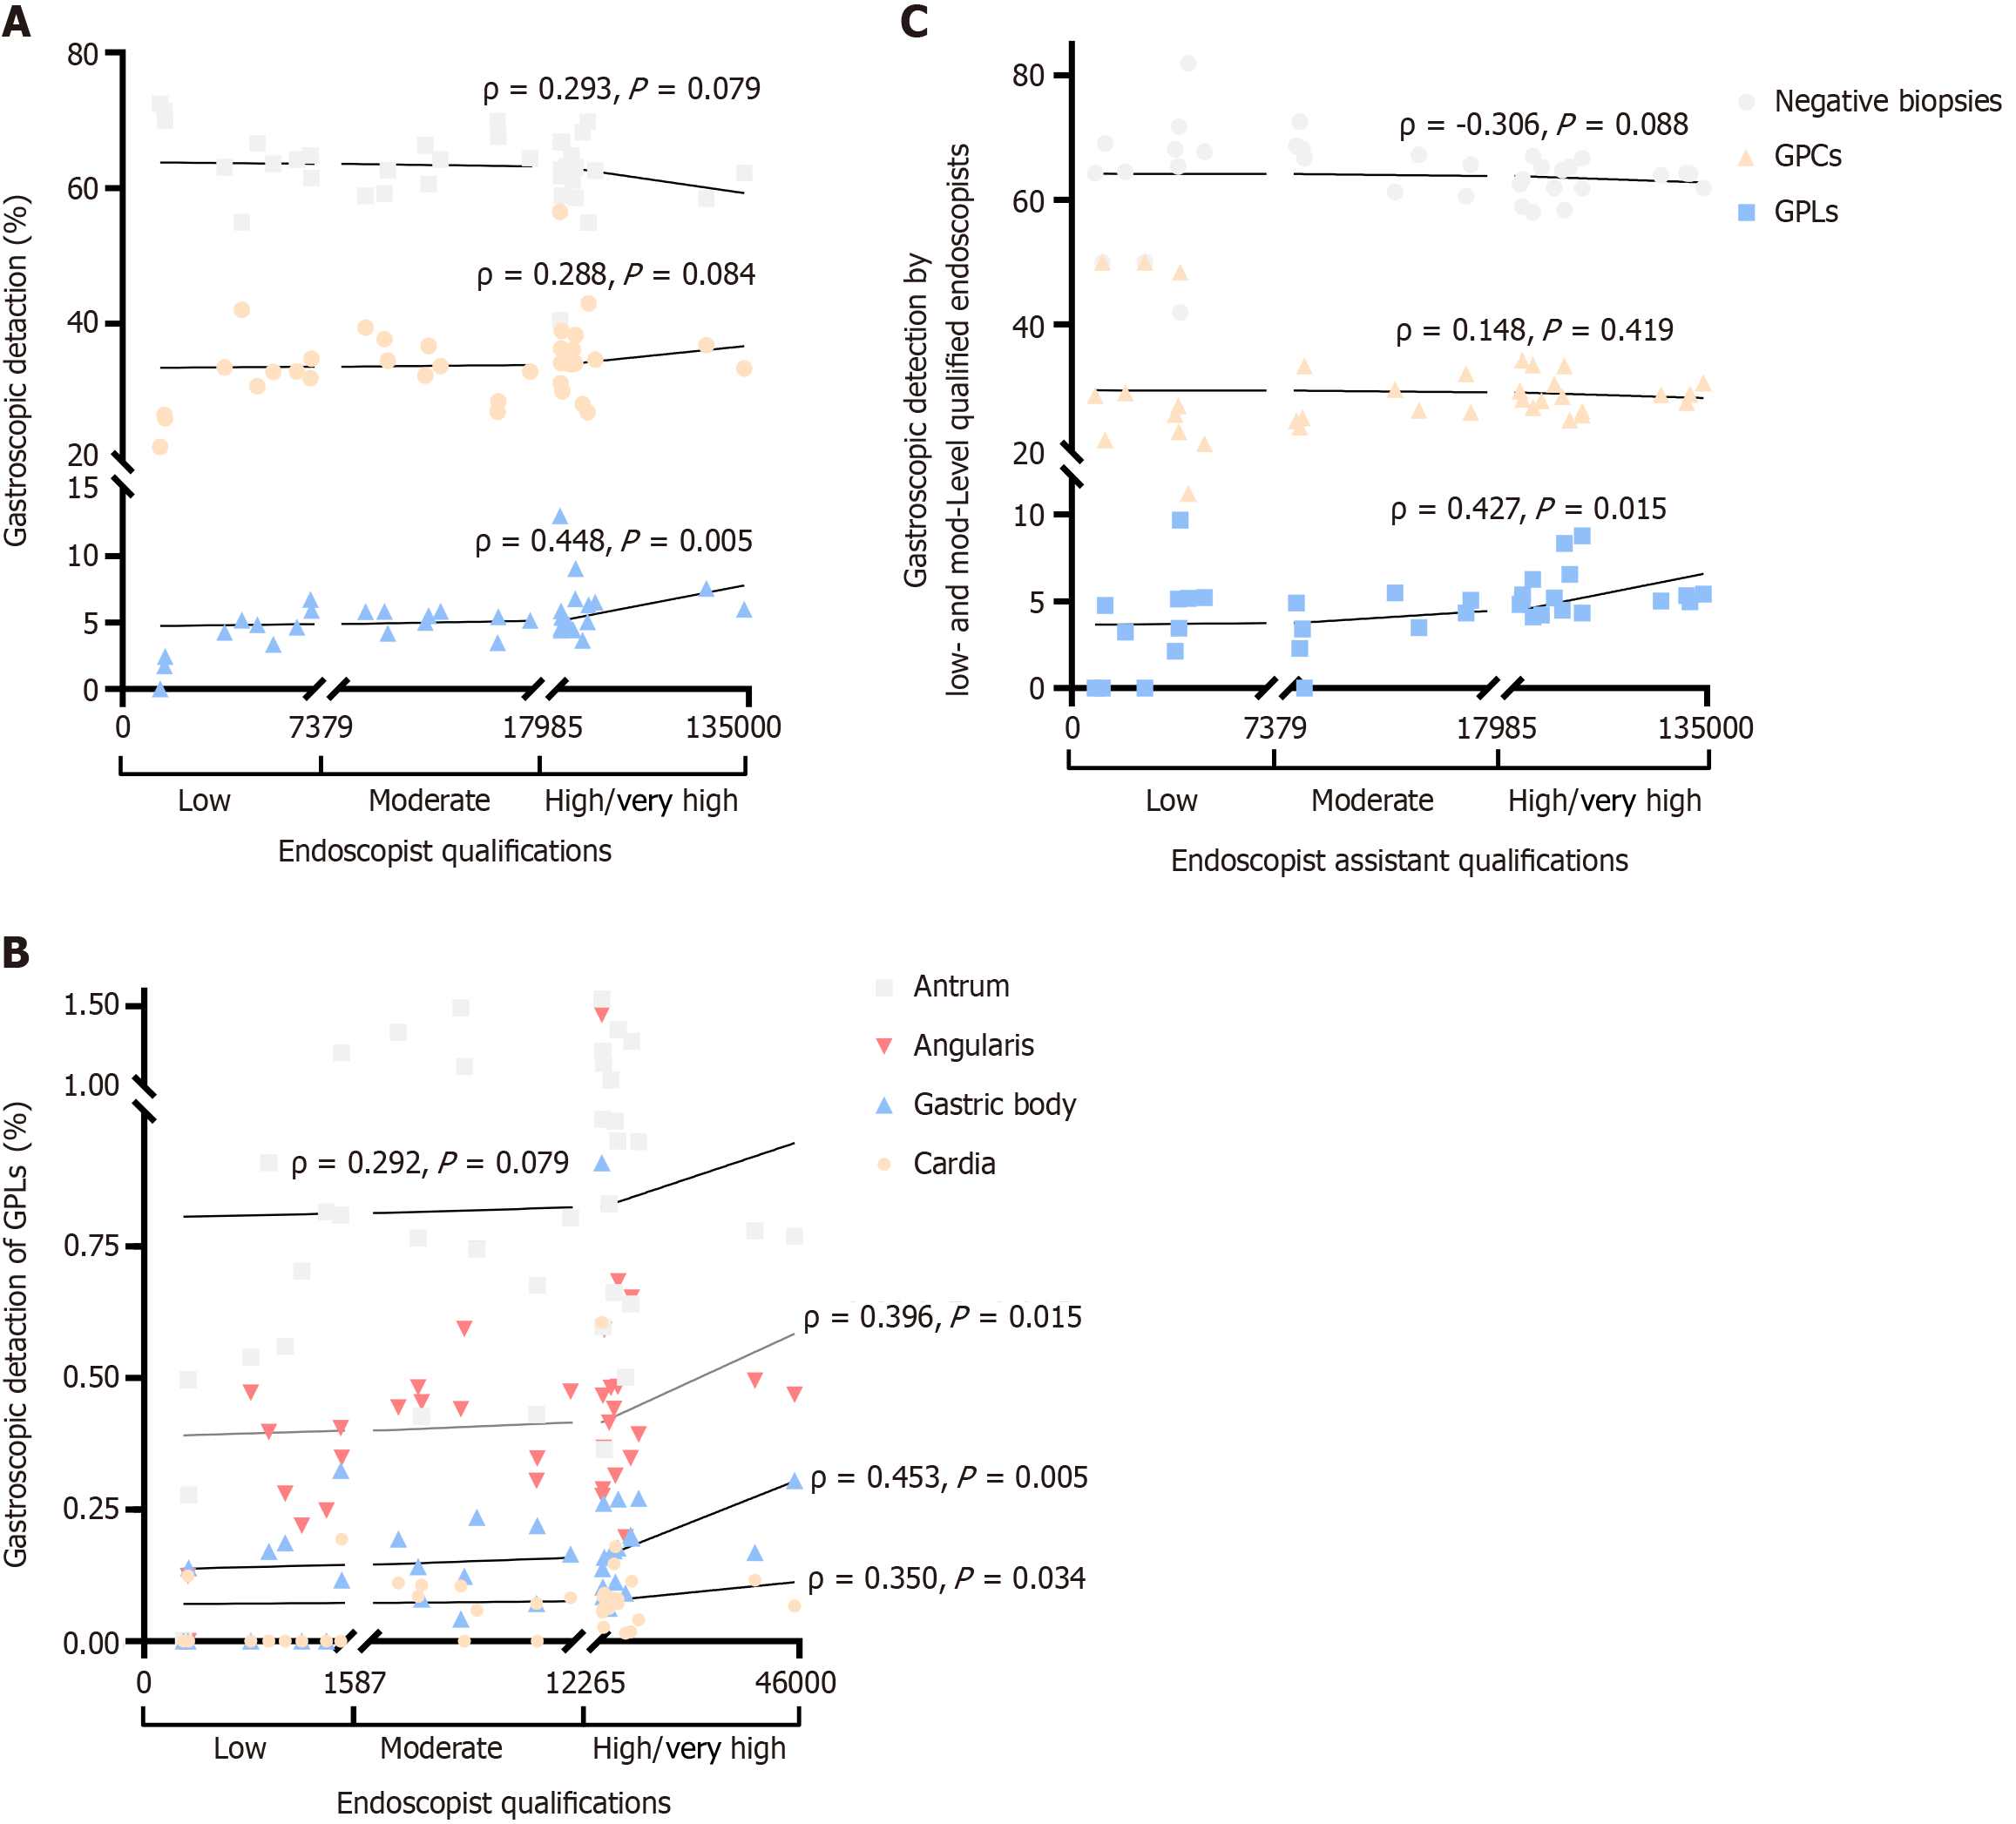
Figure 4 Relationships between endoscopists’ and endoscopic assistants’ qualifications and endoscopic detection.
A: The relationship between endoscopist qualifications and endoscopic detection is shown. The horizontal axis represents different qualifications of the endoscopist (low, moderate, high/very high), and the vertical axis represents endoscopic detection rate of different diseases; B: The relationship between the endoscopists’ qualifications and the detection rates of gastric precancerous lesions in different anatomical areas of the stomach is shown. The horizontal axis represents different qualifications of the endoscopist (low, moderate, high/very high), and the vertical axis represents gastroscopic detection rate of gastric precancerous lesions; C: The relationship between endoscopic assistant qualifications and endoscopic detection is shown. The horizontal axis represents different qualifications of the endoscopist (low, moderate, high/very high), and the vertical axis represents gastroscopic detection by low- and moderate-level qualified endoscopists. ρ: Spearman’s correlation coefficient. P < 0.05 indicates statistical significance. GPCs: Gastric precancerous conditions; GPLs: Gastric precancerous lesions.
- Citation: Shen Y, Gao XJ, Zhang XX, Zhao JM, Hu FF, Han JL, Tian WY, Yang M, Wang YF, Lv JL, Zhan Q, An FM. Endoscopists and endoscopic assistants’ qualifications, but not their biopsy rates, improve gastric precancerous lesions detection rate. World J Gastrointest Endosc 2025; 17(4): 104097
- URL: https://www.wjgnet.com/1948-5190/full/v17/i4/104097.htm
- DOI: https://dx.doi.org/10.4253/wjge.v17.i4.104097


