Copyright
©The Author(s) 2025.
World J Gastrointest Endosc. Feb 16, 2025; 17(2): 100665
Published online Feb 16, 2025. doi: 10.4253/wjge.v17.i2.100665
Published online Feb 16, 2025. doi: 10.4253/wjge.v17.i2.100665
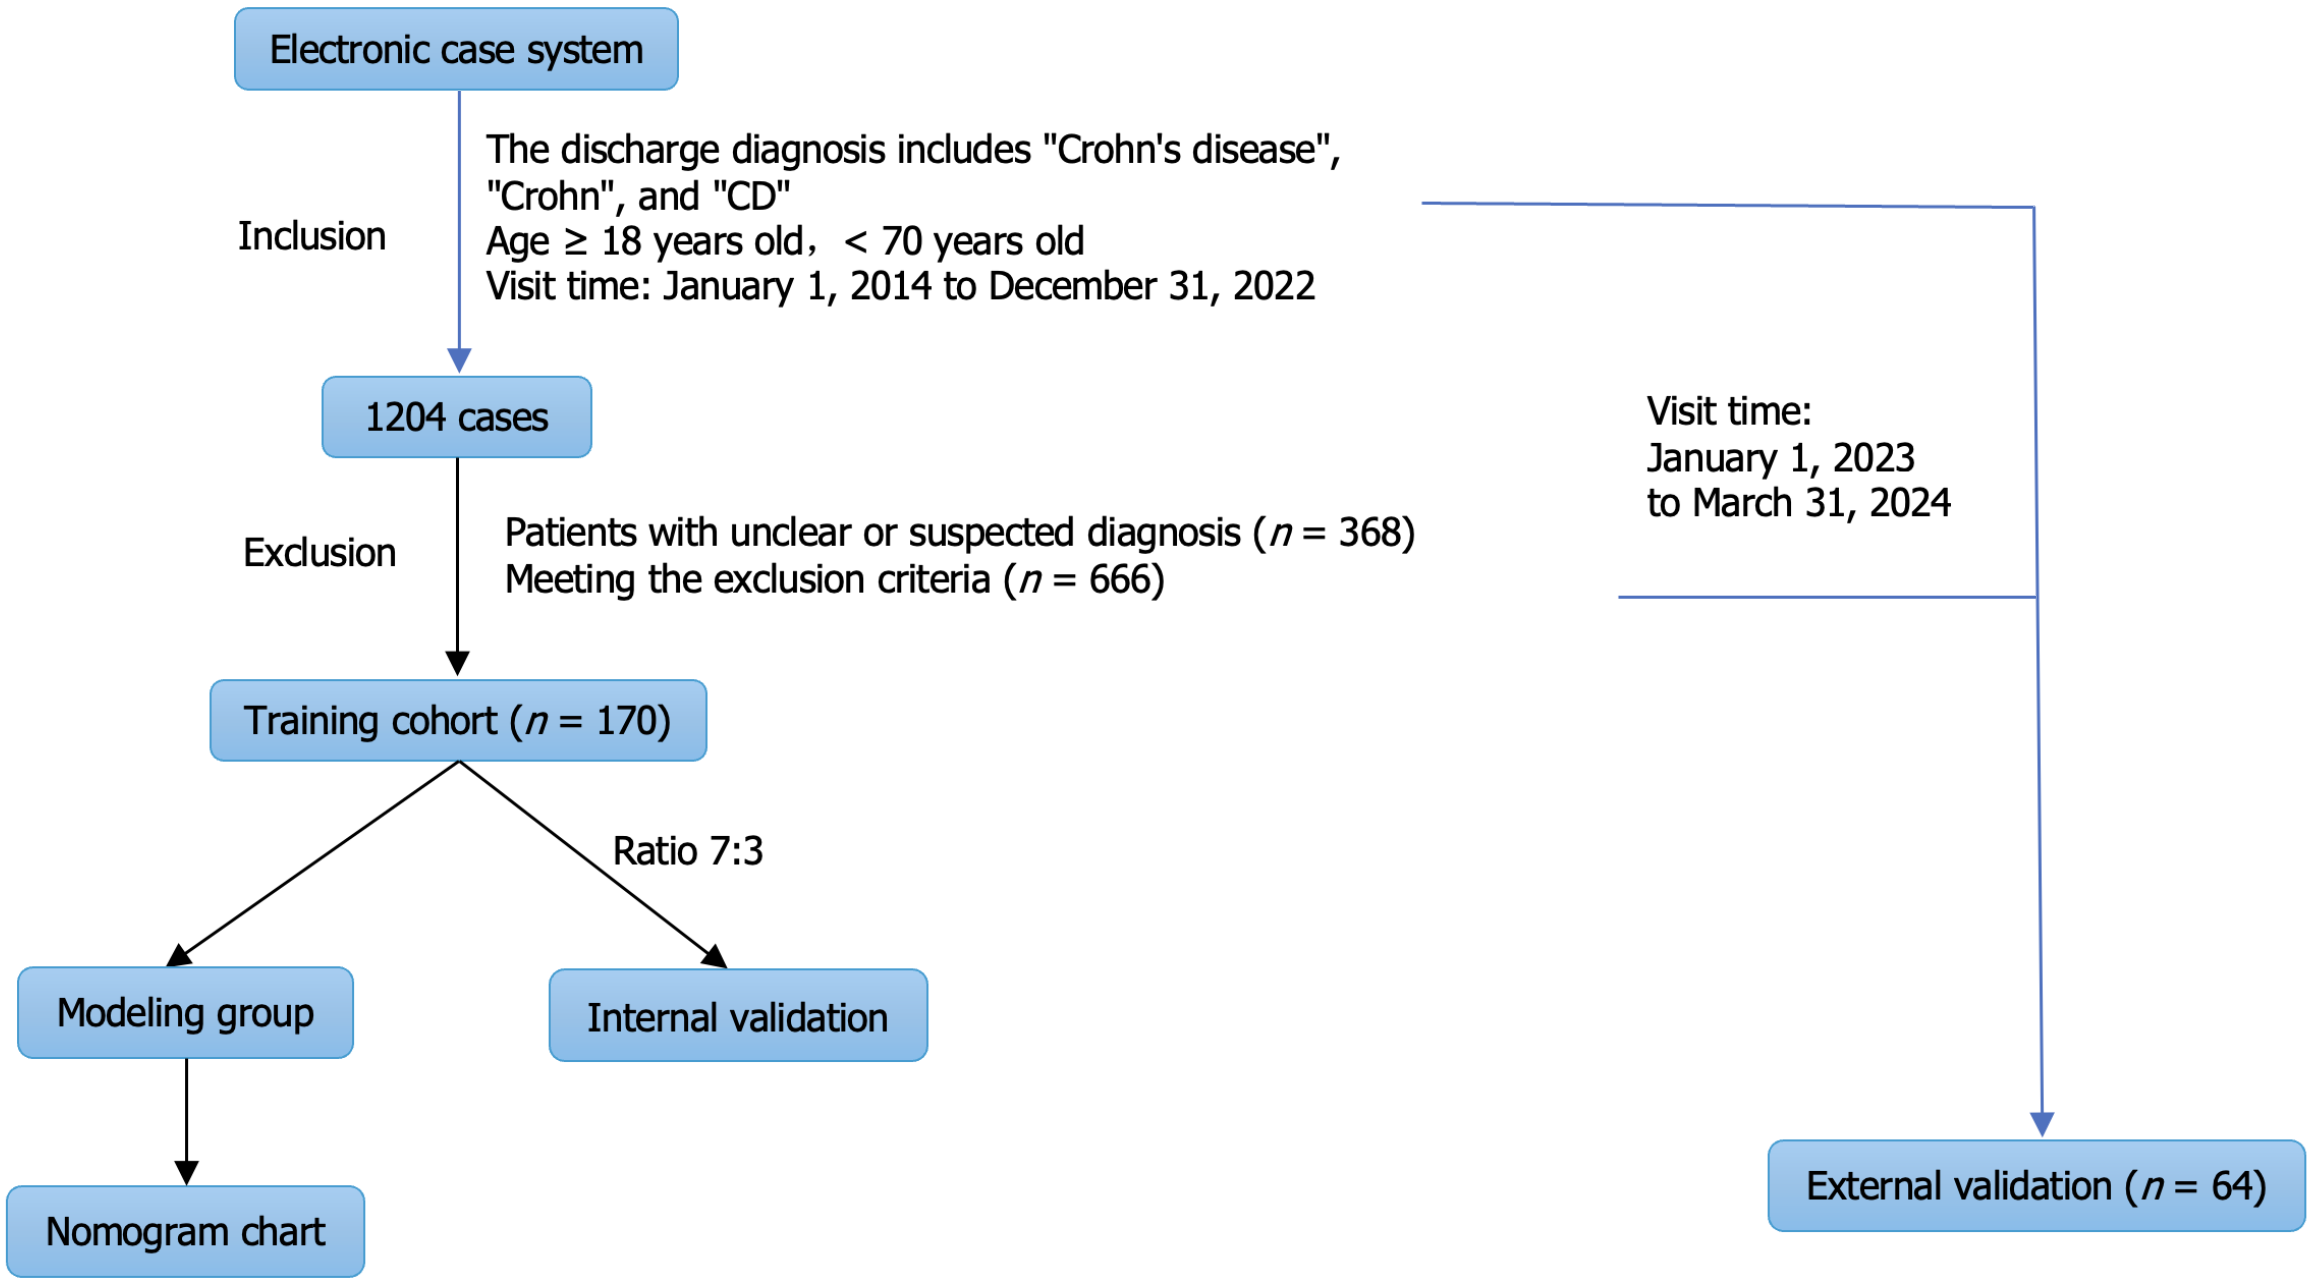
Figure 1 Study design flow chart.
CD: Crohn's disease.
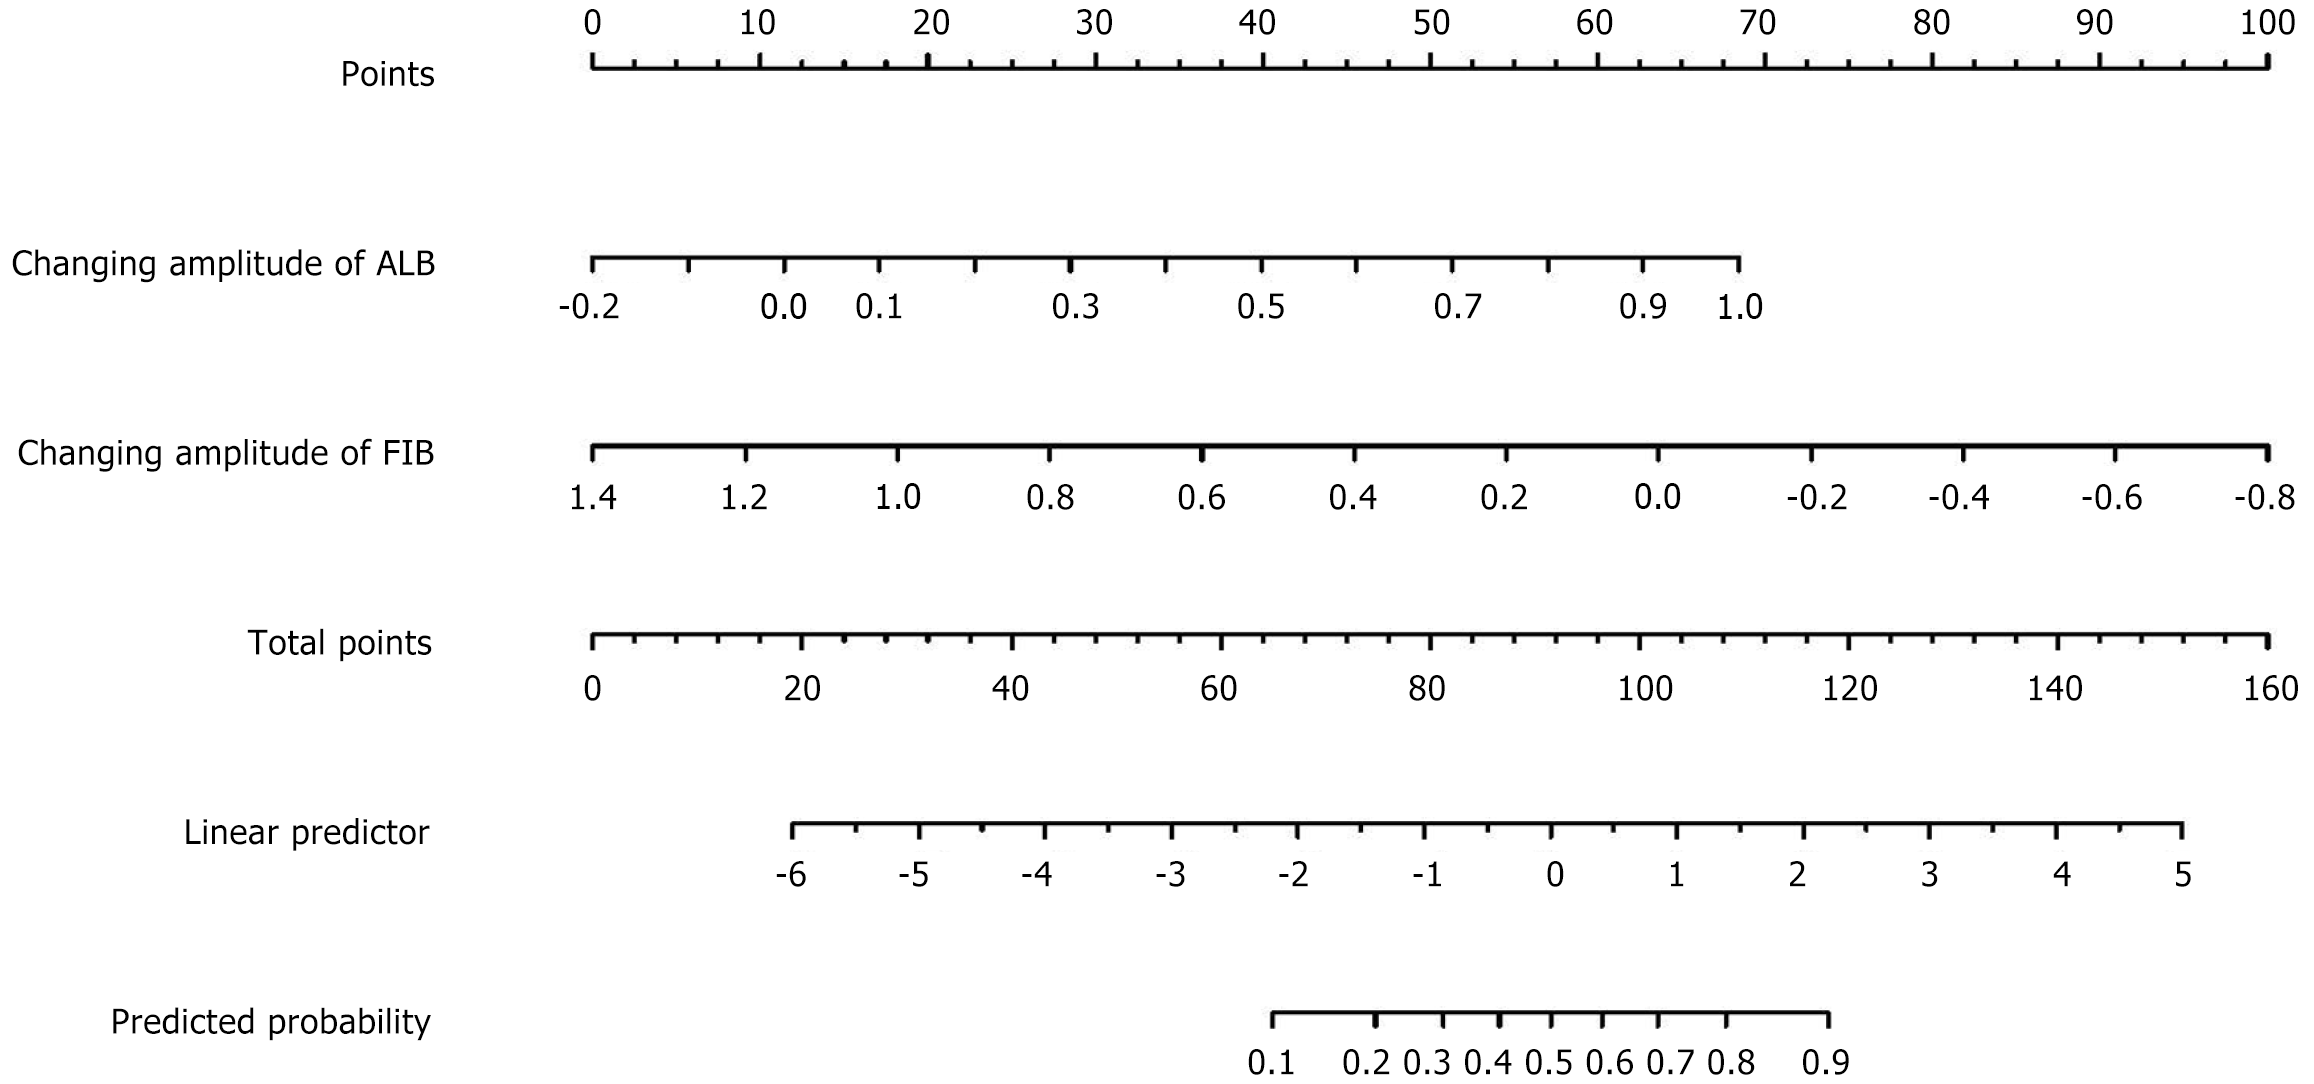
Figure 2 Nomogram construction of an endoscopic improvement prediction model for Crohn’s disease.
The sum of the scores on each predictor, which predicts the probability that the endoscopic improvement will occur. ALB: Albumin; FIB: Fibrinogen.
Figure 3 Receiver operating characteristic curve and calibration curve for the training group, which predicts endoscopic improvement during follow-up visits.
A: Receiver operating characteristic curve of the training group for predicting endoscopic improvement during follow-up visits; B: Calibration curve of the training group for predicting endoscopic improvement during follow-up visits. ROC: Receiver operating characteristic; AUC: Area under the curve.
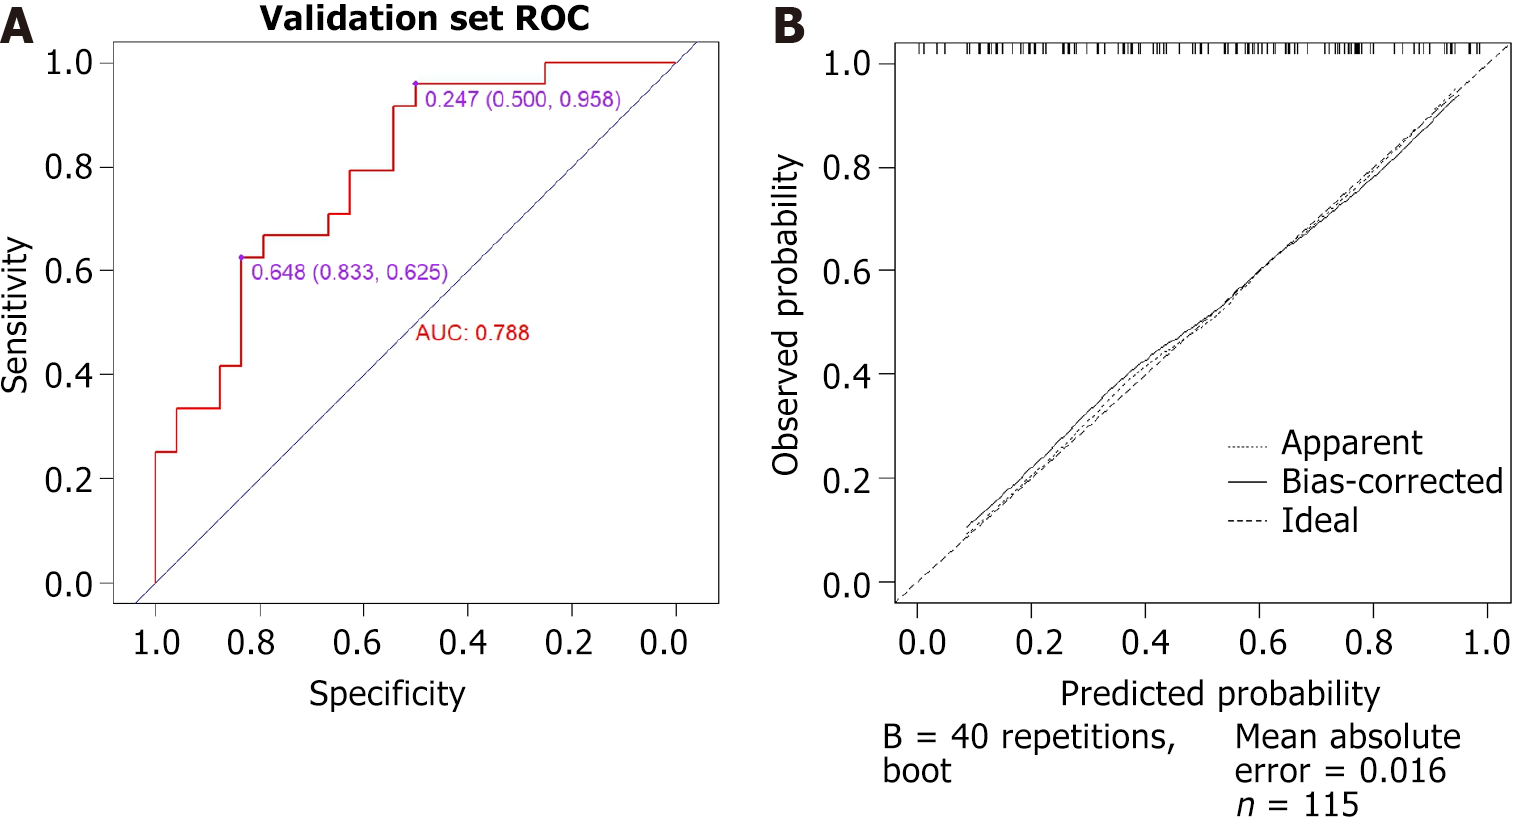
Figure 4 Receiver operating characteristic curve and calibration curve for predicting endoscopic improvement during follow-up visits in the internal validation group.
A: Receiver operating characteristic curve of the internal validation group for predicting endoscopic improvement during follow-up visits; B: Calibration curve of the internal validation group for predicting endoscopic improvement during follow-up visits. ROC: Receiver operating characteristic; AUC: Area under the curve.
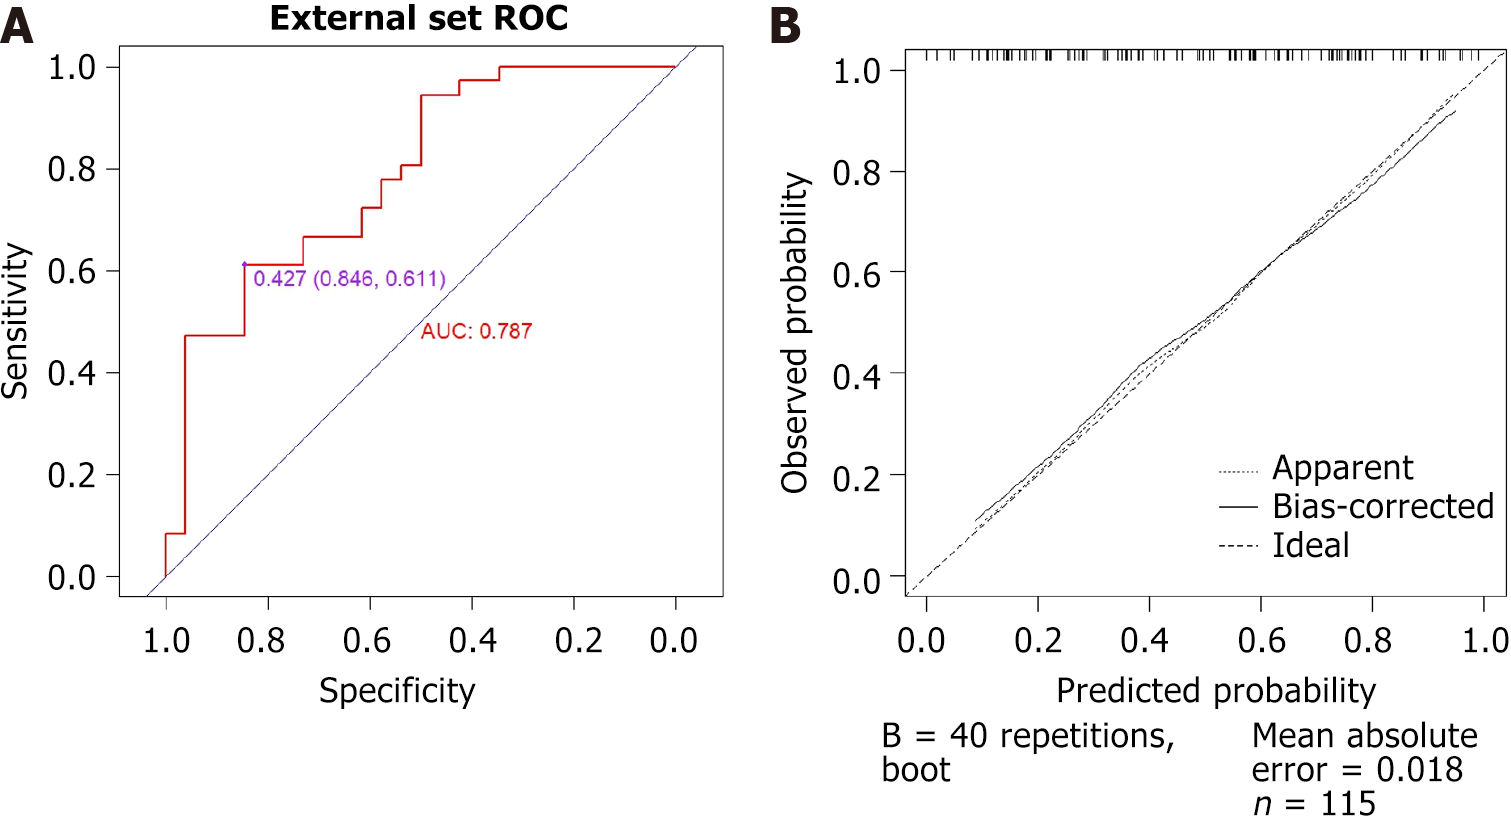
Figure 5 Receiver operating characteristic curve and calibration curve for external validation, which aimed to predict endoscopic improvement during follow-up visits.
A: Receiver operating characteristic curve of the external validation group for predicting endoscopic improvement during follow-up visits; B: Calibration curve of the external validation group for predicting endoscopic improvement during follow-up visits. ROC: Receiver operating characteristic; AUC: Area under the curve.
Figure 6 Decision curve analysis curves.
A: Training group; B: Internal validation group; E: External validation group.
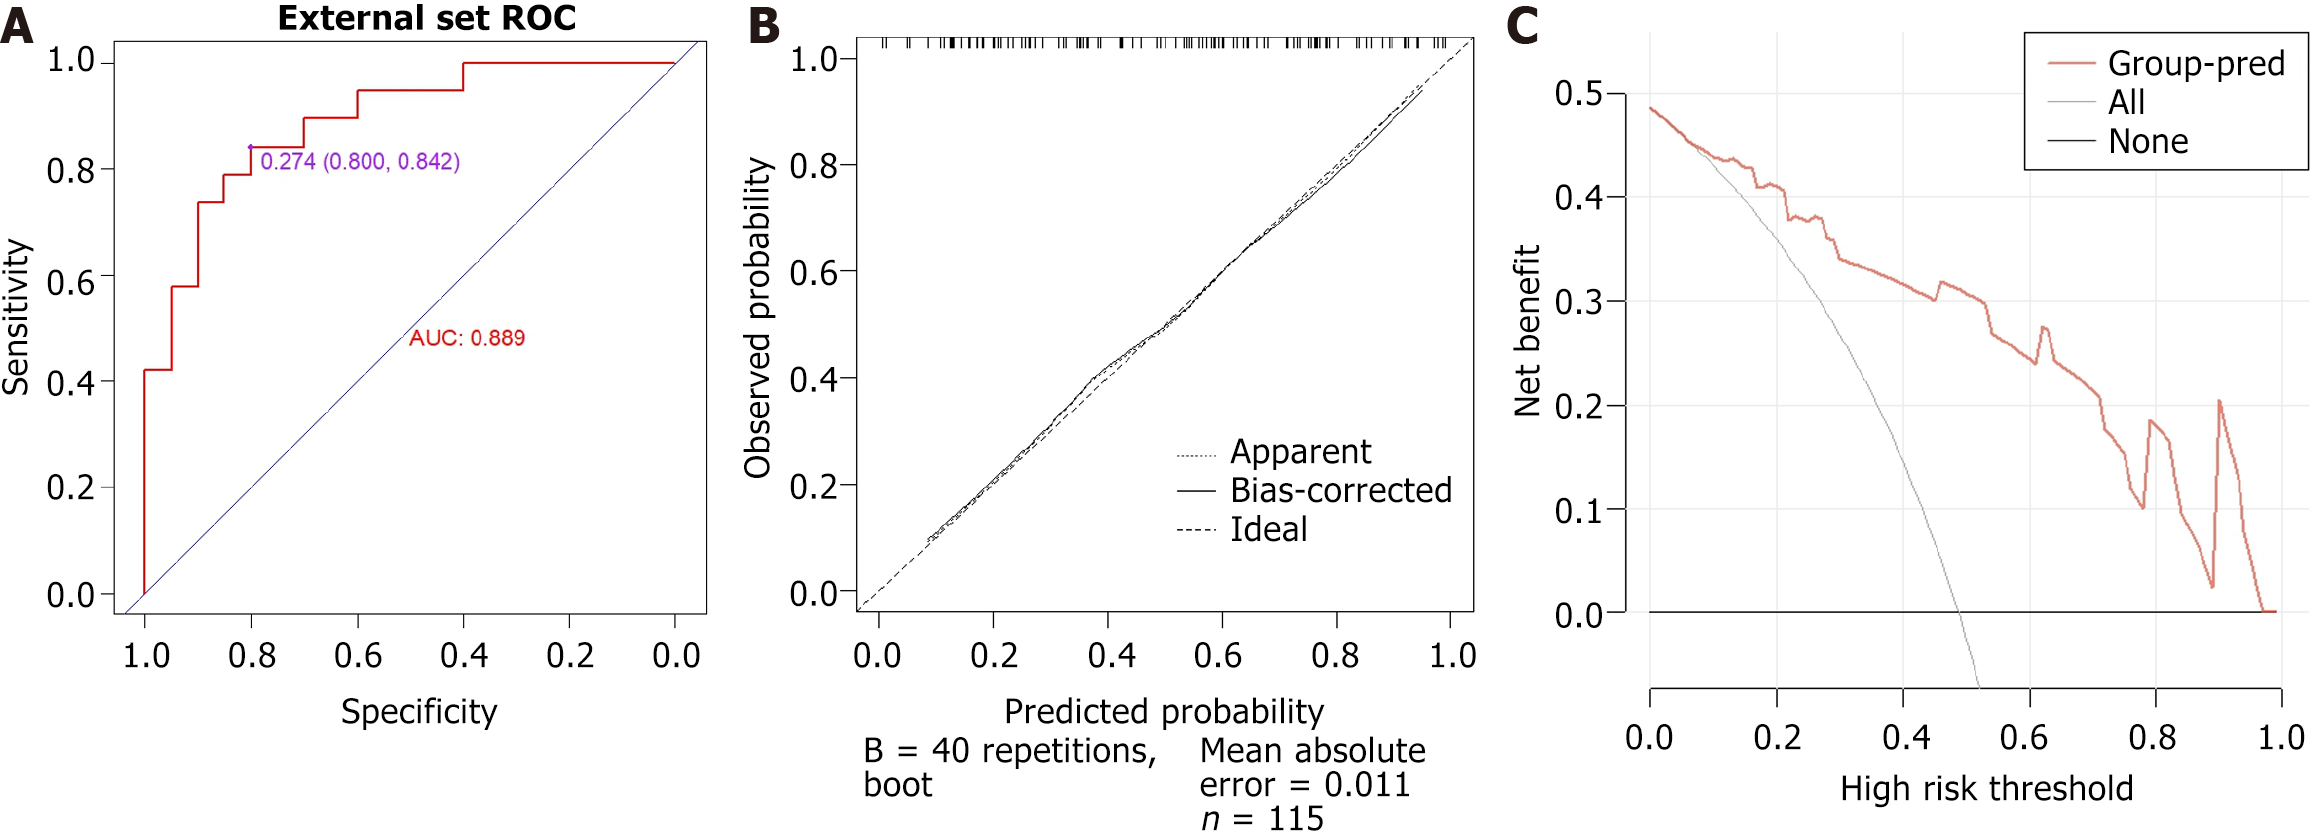
Figure 7 Predicting endoscopic improvement during follow-up visits in patients who revisited within six months.
A: Receiver operating characteristic curve; B: Calibration curve; C: Decision curve analysis curve. ROC: Receiver operating characteristic; AUC: Area under the curve.
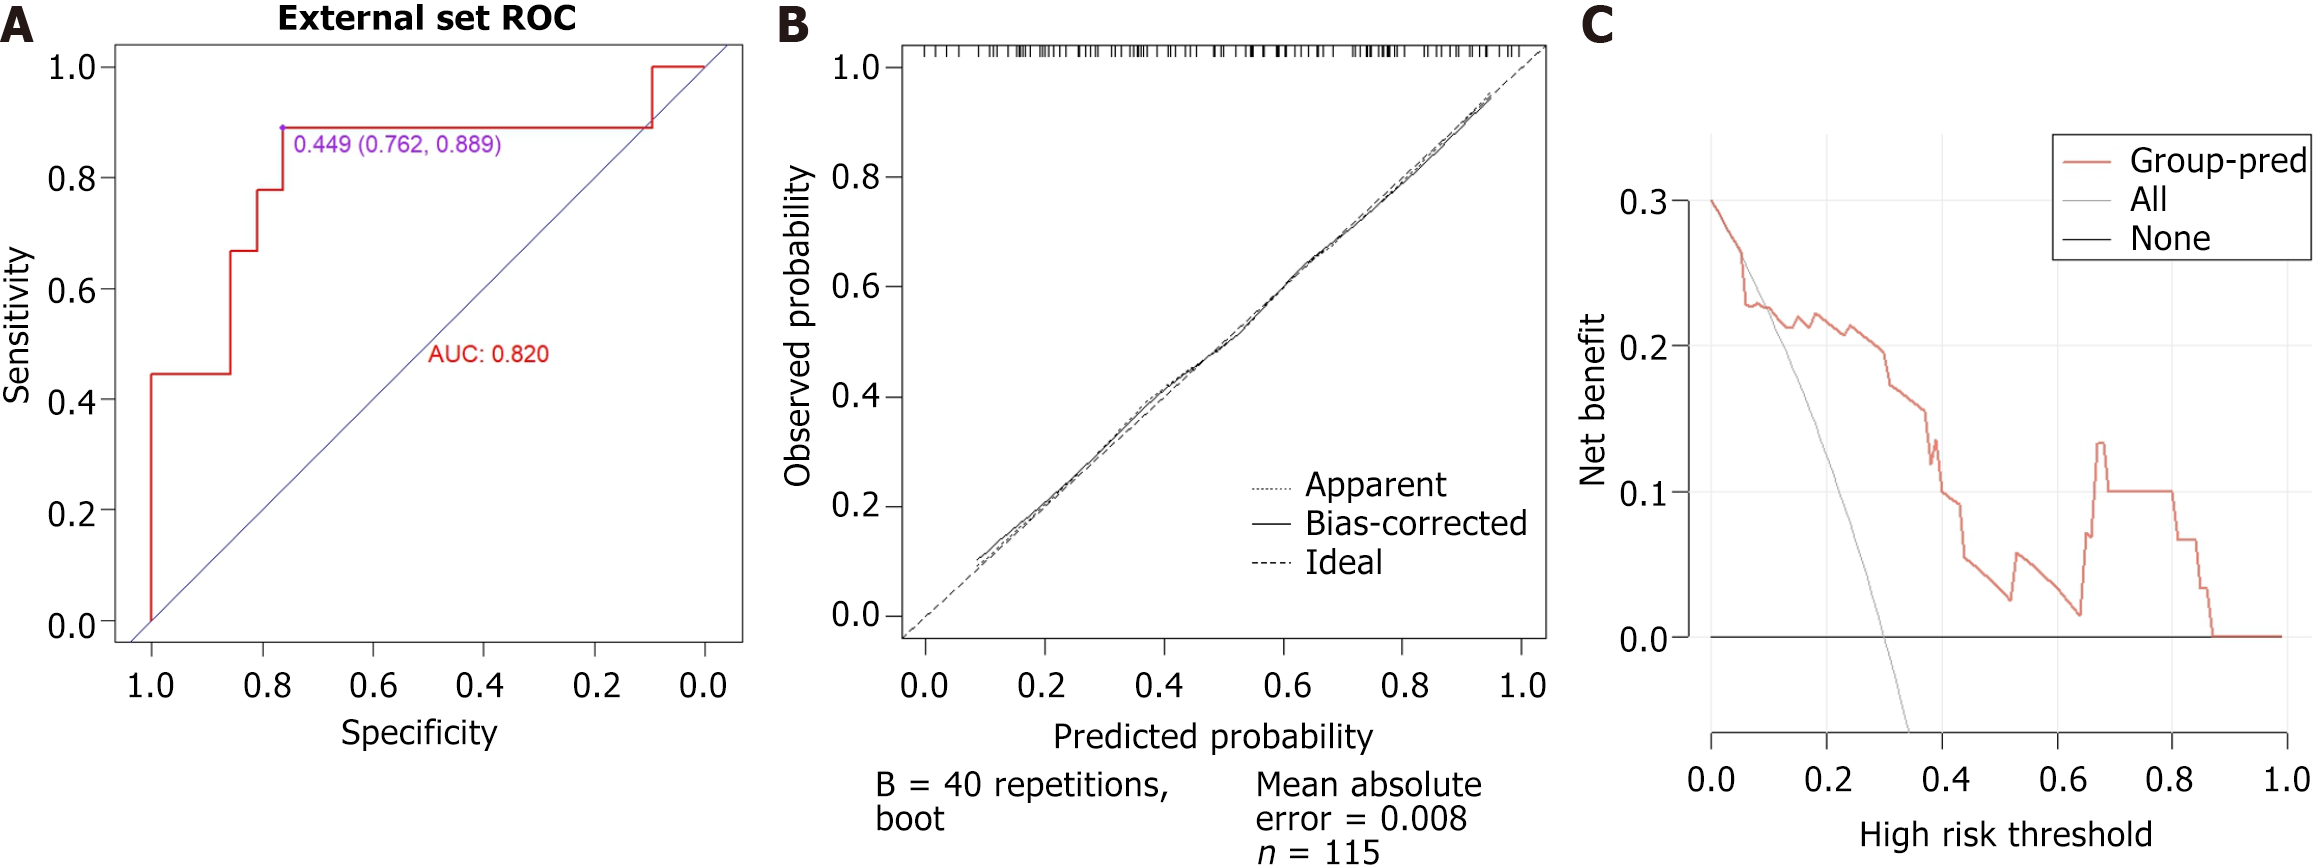
Figure 8 Predicting endoscopic improvement during follow-up visits in patients who revisited within six months to one year.
A: Receiver operating characteristic curve; B: Calibration curve; C: Decision curve analysis curve. ROC: Receiver operating characteristic; AUC: Area under the curve.
Figure 9 Predicting endoscopic improvement during follow-up visits in patients who revisited exceeding 1 year.
A: Receiver operating characteristic curve; B: Calibration curve; C: Decision curve analysis curve. ROC: Receiver operating characteristic; AUC: Area under the curve.
- Citation: Wang HG, Nima CL, Zhou Q. Development and validation of a predictive model for endoscopic improvement of Crohn's disease. World J Gastrointest Endosc 2025; 17(2): 100665
- URL: https://www.wjgnet.com/1948-5190/full/v17/i2/100665.htm
- DOI: https://dx.doi.org/10.4253/wjge.v17.i2.100665


