©The Author(s) 2025.
World J Gastrointest Endosc. Oct 16, 2025; 17(10): 110920
Published online Oct 16, 2025. doi: 10.4253/wjge.v17.i10.110920
Published online Oct 16, 2025. doi: 10.4253/wjge.v17.i10.110920
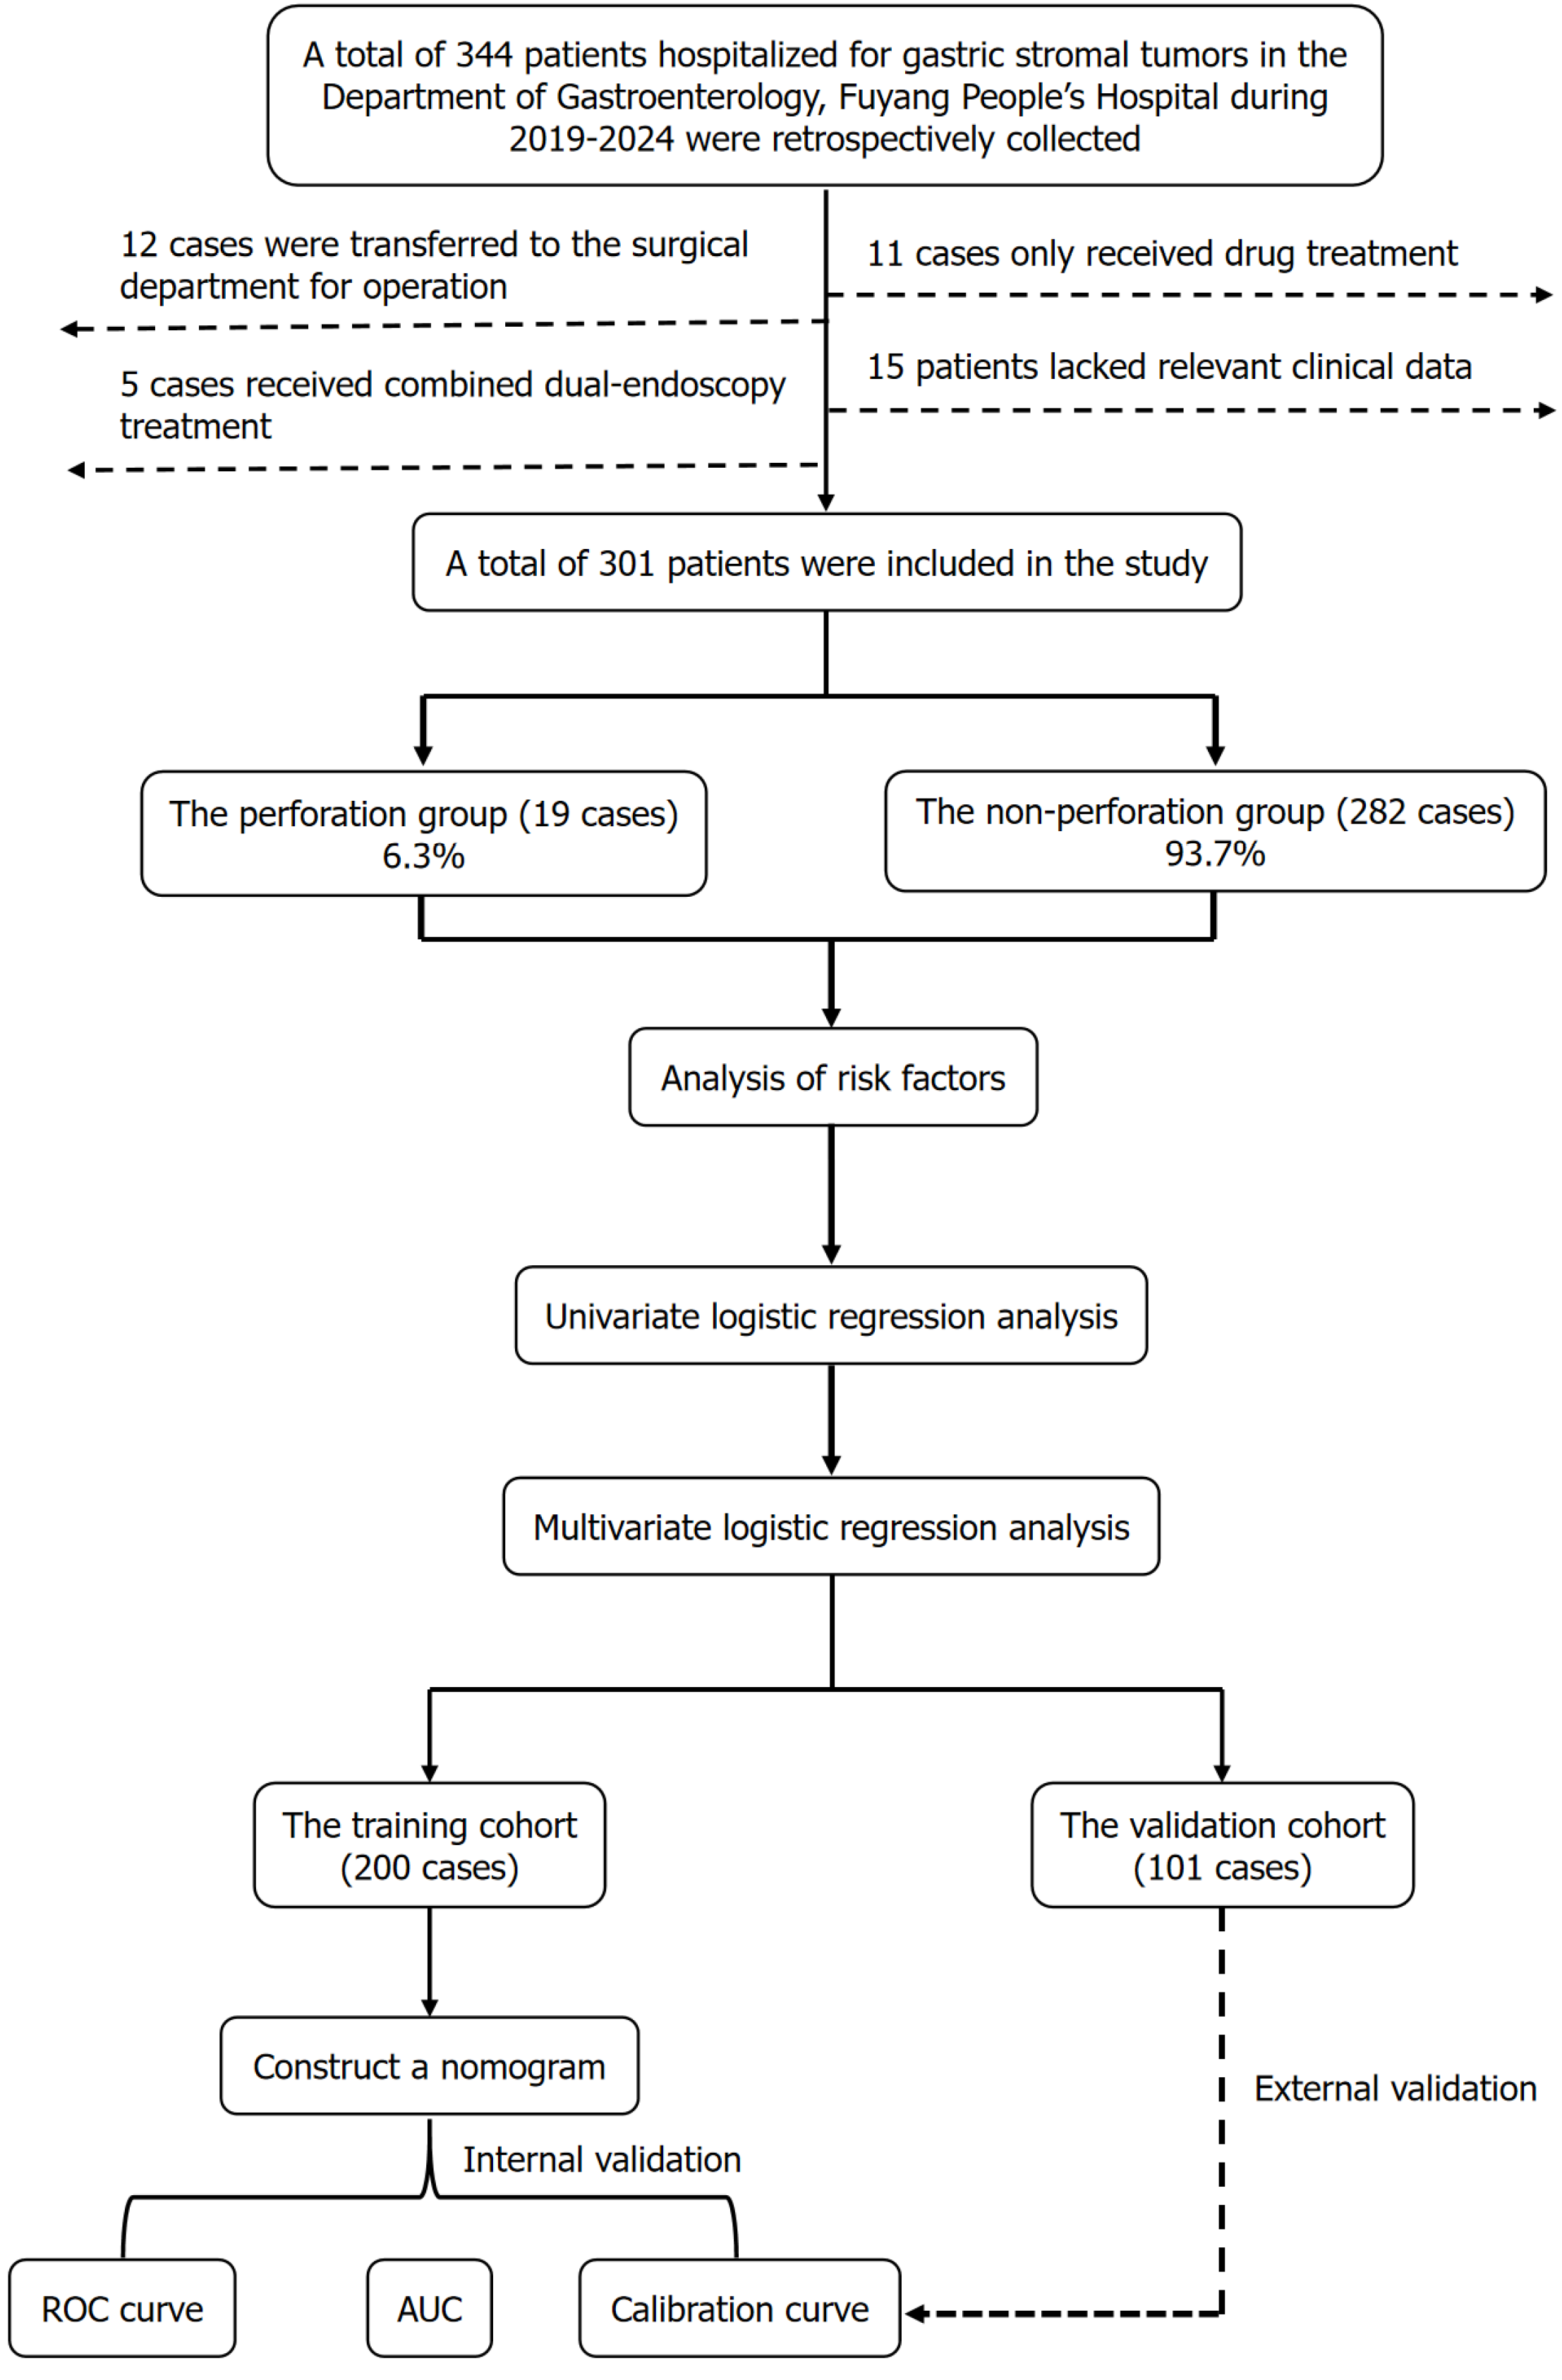
Figure 1 A flowchart of the study.
ROC: Receiver operating characteristic; AUC: Area under the curve.
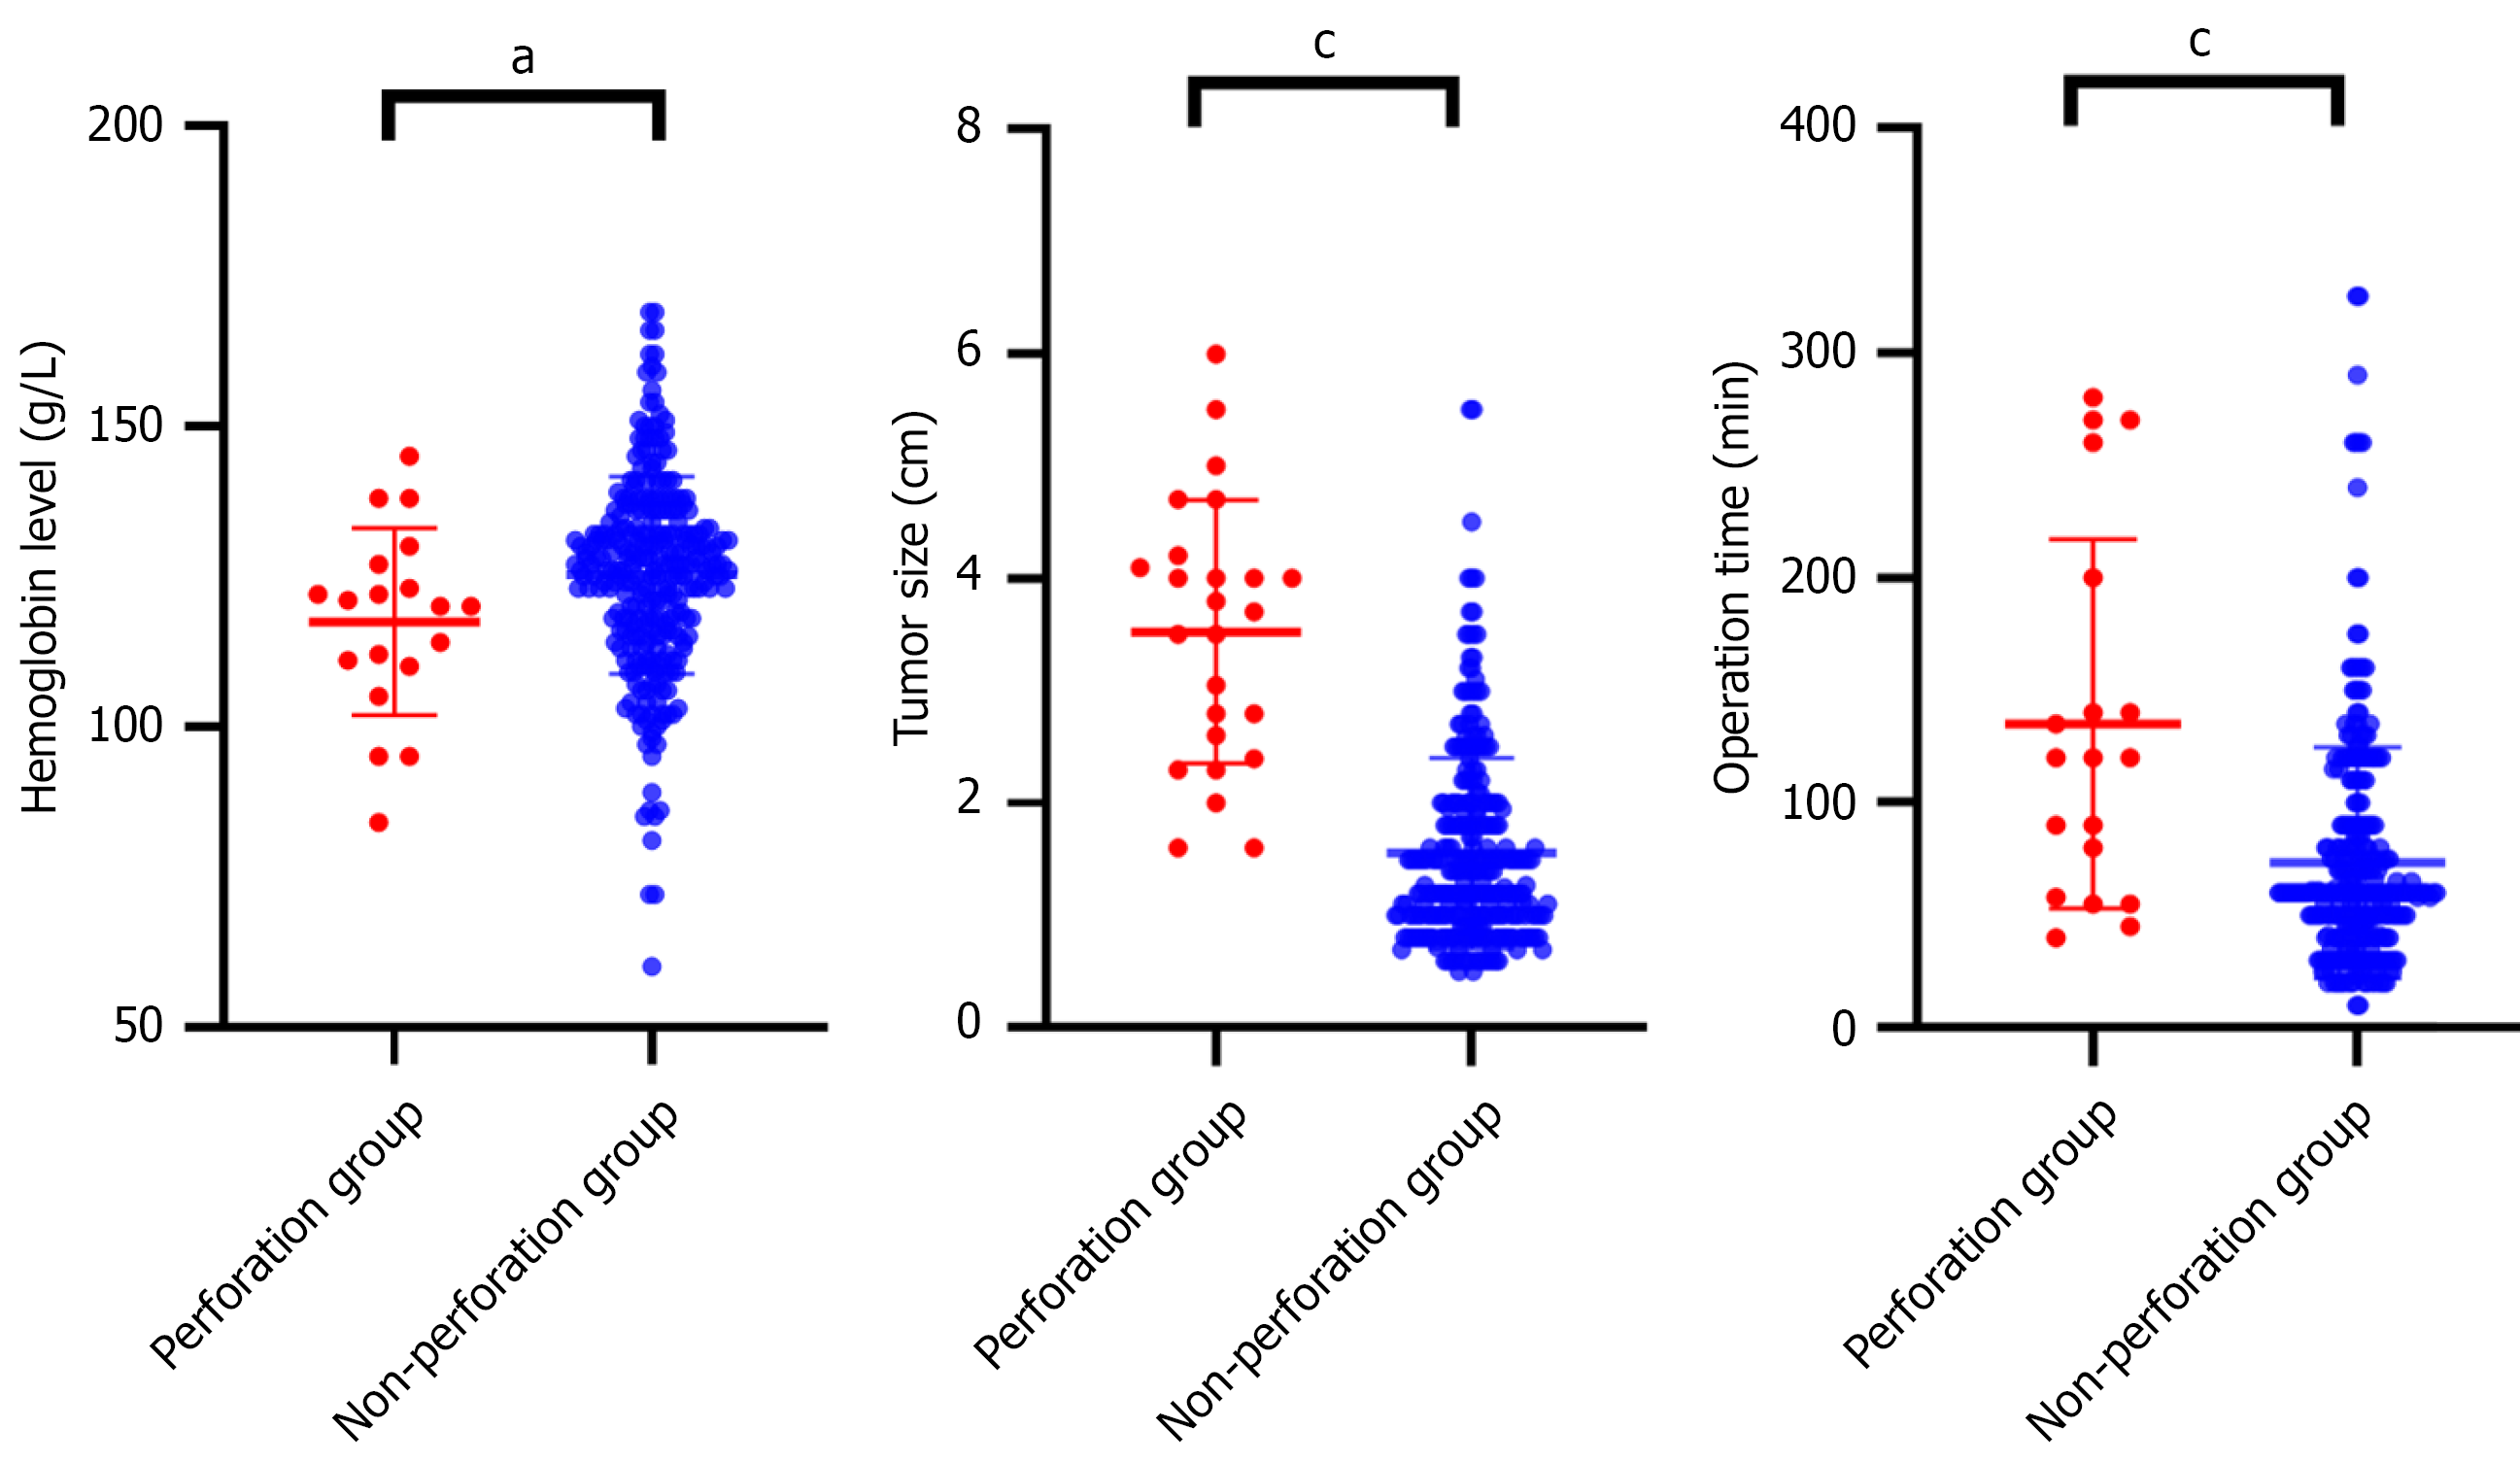
Figure 2 Analysis of risk factors for postoperative perforation in gastric gastrointestinal stromal tumors after endoscopic removal.
aP < 0.05; cP < 0.001.
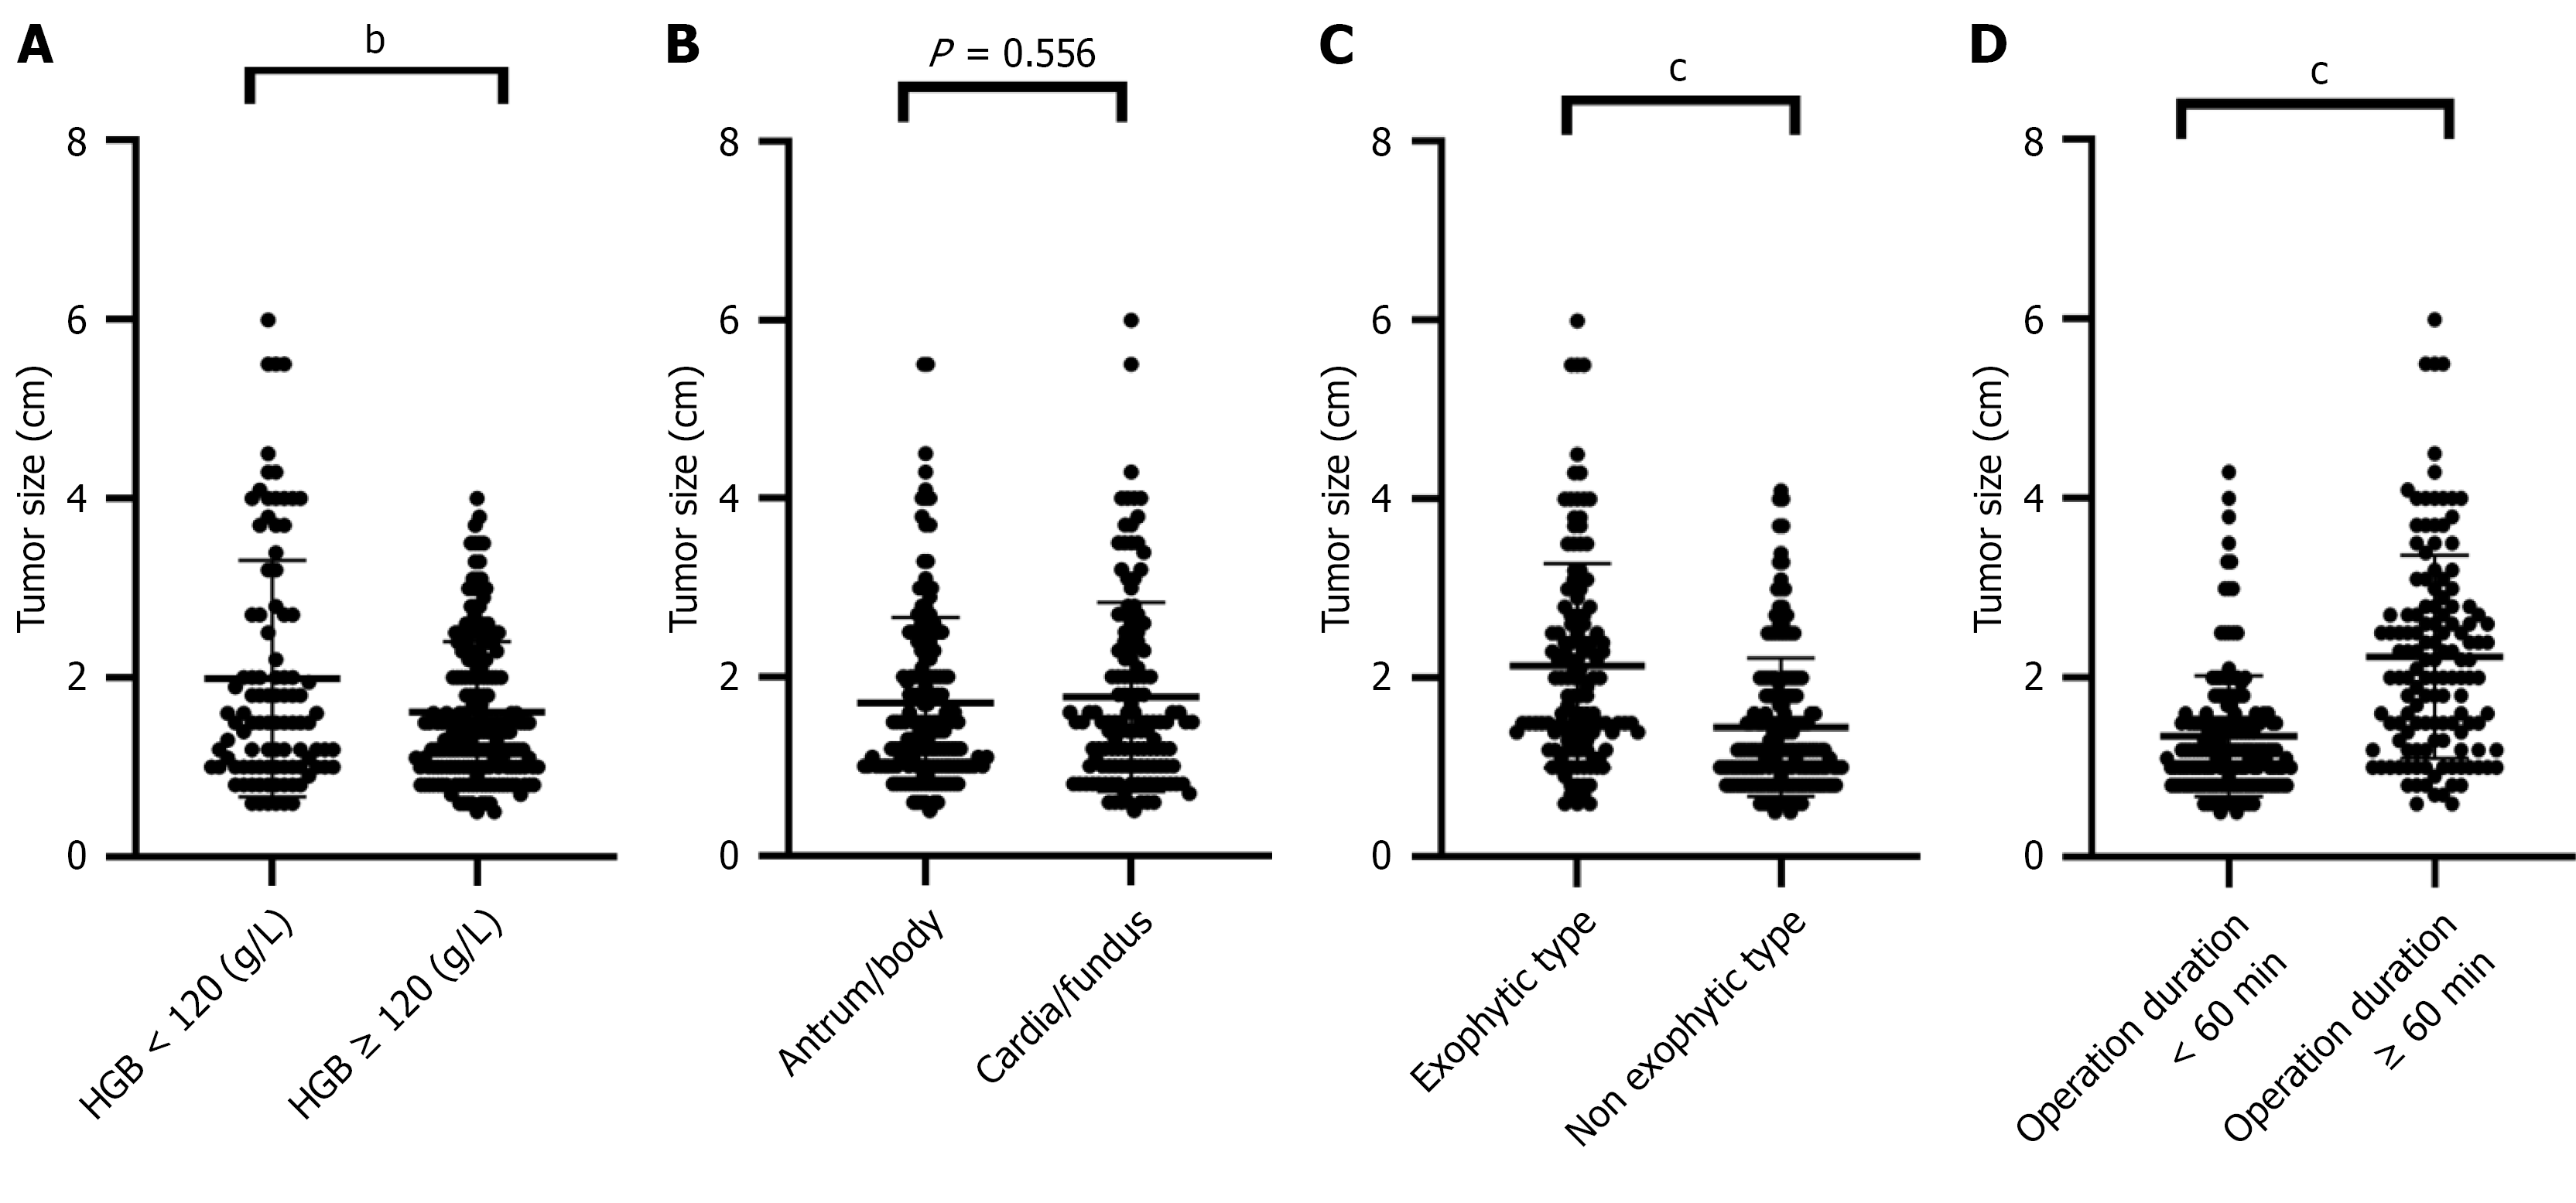
Figure 3 Tumor size distribution across clinical parameters in gastric gastrointestinal stromal tumors.
A: Tumor size was larger in patients with lower hemoglobin levels compared to those with higher hemoglobin levels; B: Tumor size between different locations (antrum/body vs cardia/fundus) was not statistically significant; C: Tumor size was larger in the exophytic type compared to the non-exophytic type; D: Longer operation duration was related to tumor size. bP < 0.01; cP < 0.001. HGB: Hemoglobin.
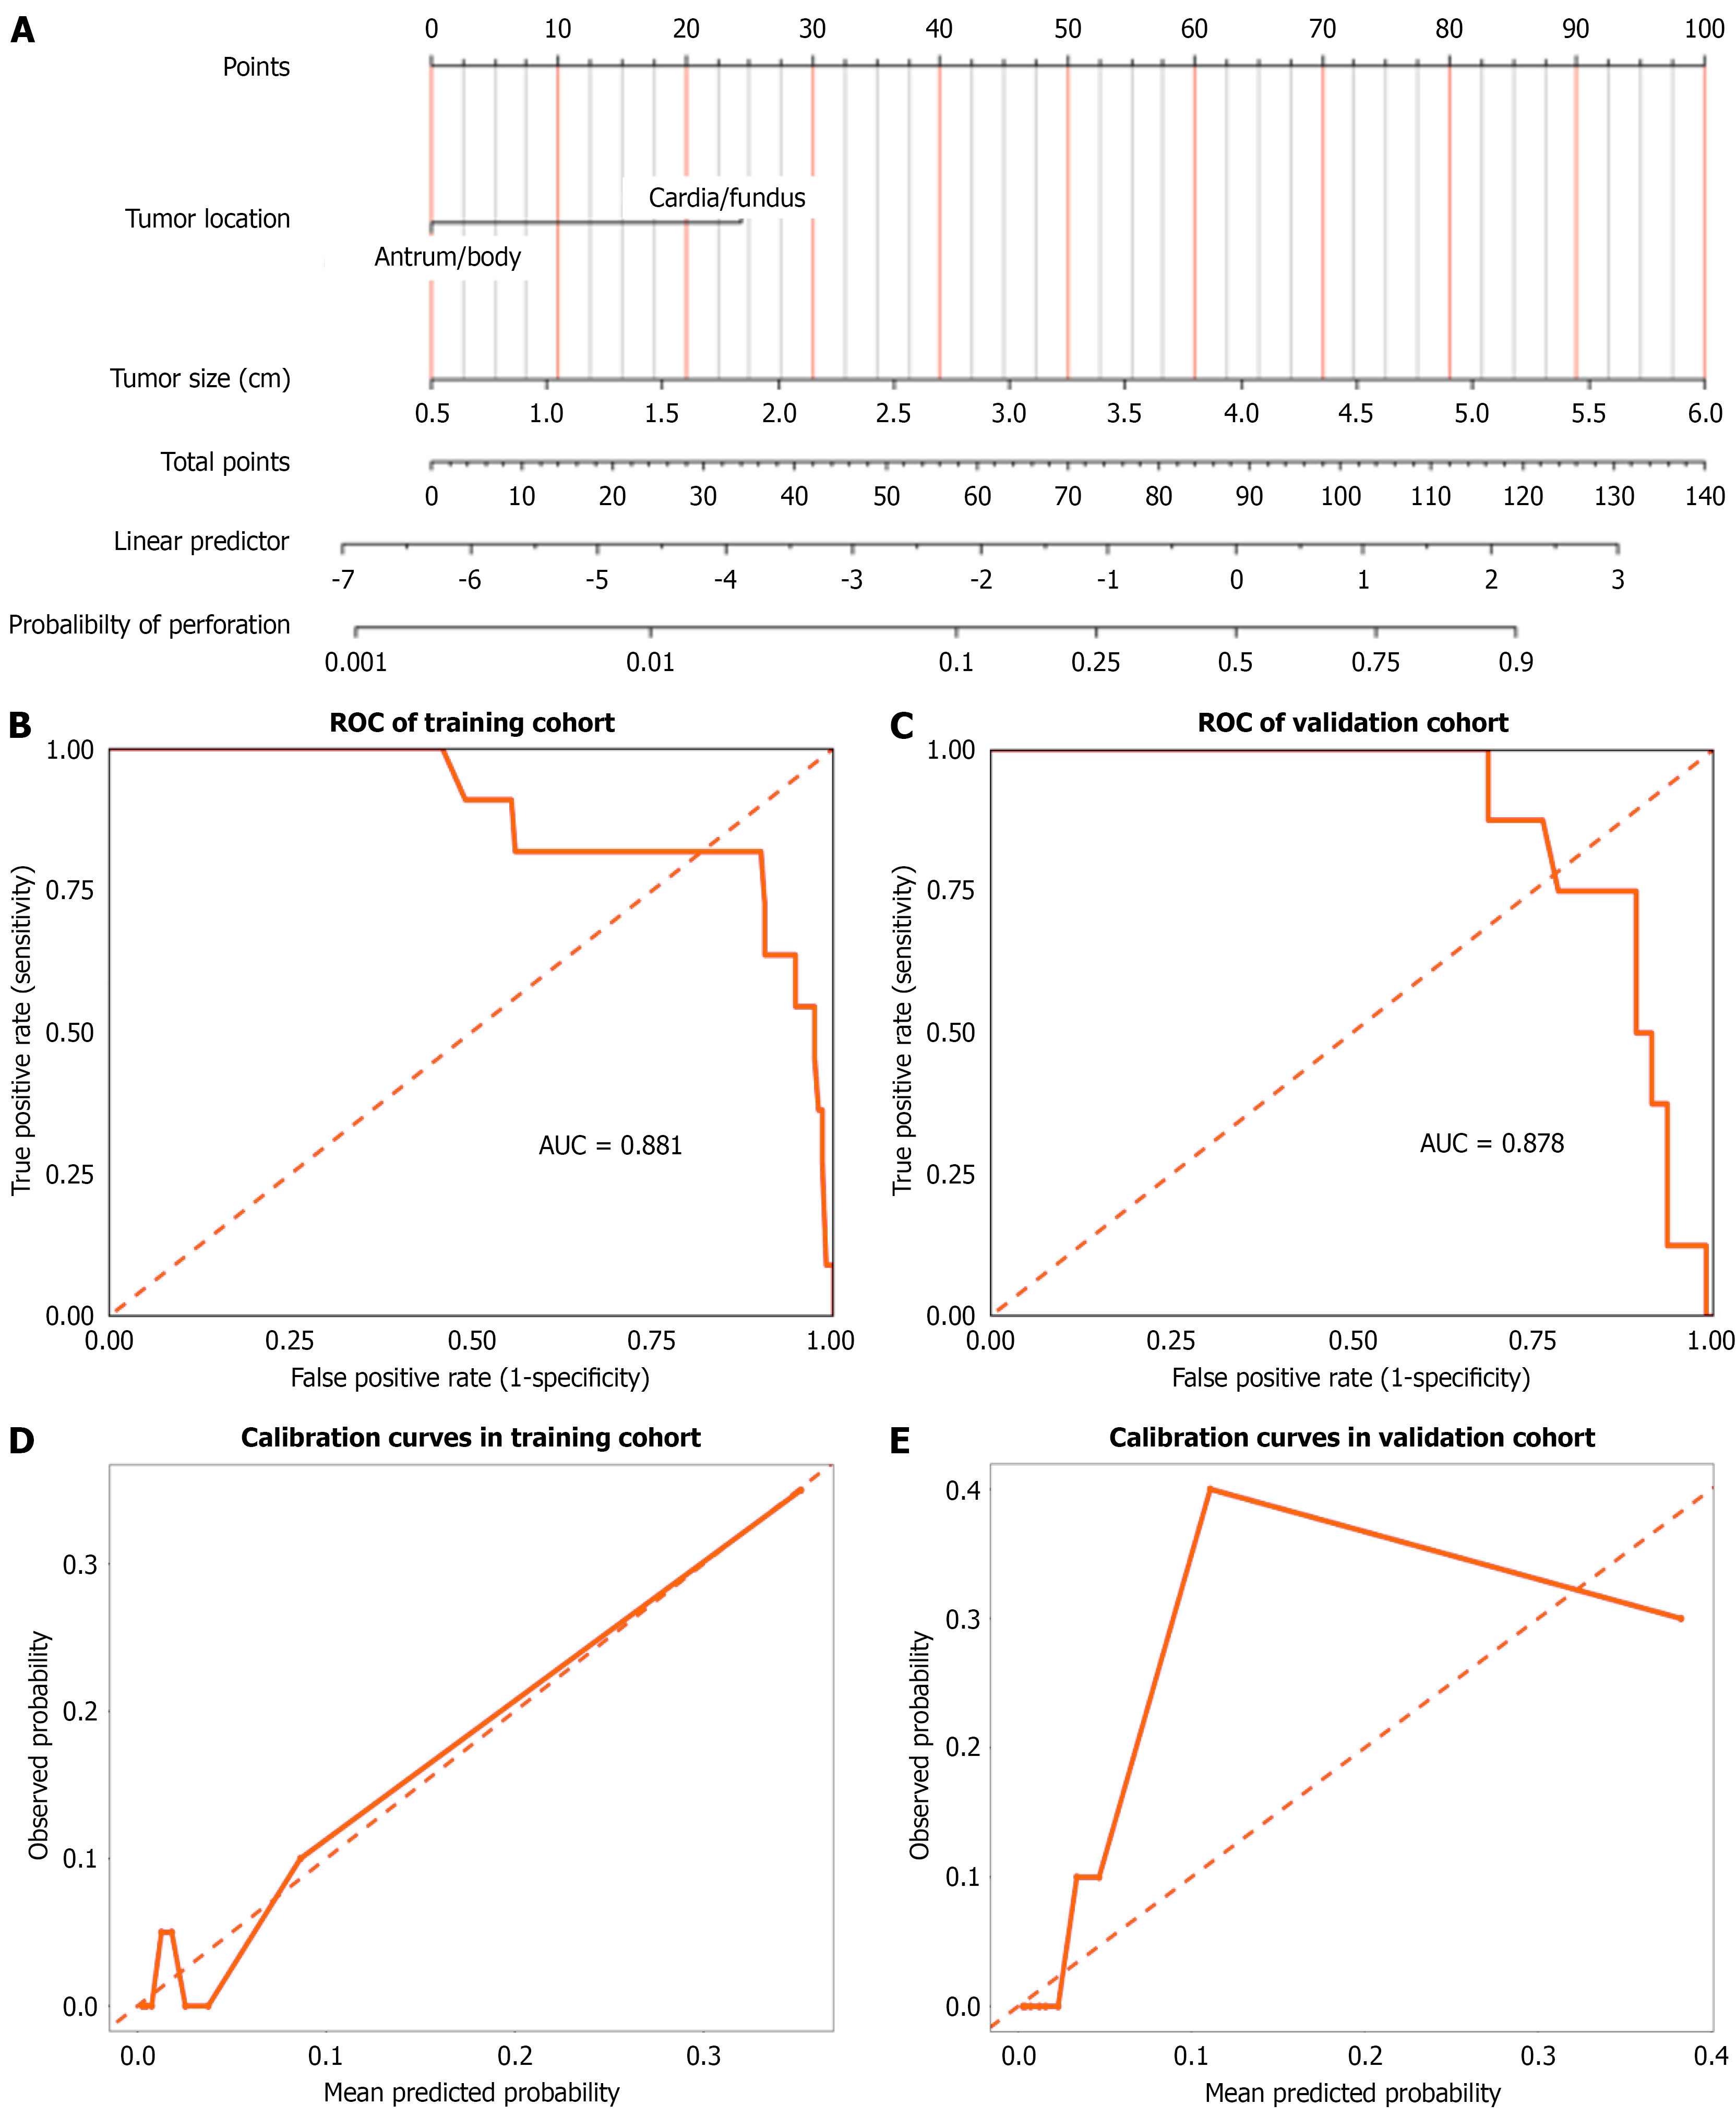
Figure 4 Development and validation of a nomogram for predicting postoperative perforation in gastric gastrointestinal stromal tumors.
A: Nomogram depicting the contribution of key variables (tumor location, tumor size) to the predicted probability of perforation after endoscopic resection; B: Receiver operating characteristic curve for the training cohort. The area under the curve was 0.881; C: Receiver operating characteristic curve for the validation cohort (area under the curve = 0.878); D: Calibration curve for the training cohort; E: Calibration curve for the validation cohort. ROC: Receiver operating characteristic; AUC: Area under the curve.
- Citation: Zhang DM, Li PP, Zhang MH, Zhao ZX, Zhou YB. Postoperative perforation risk after endoscopic removal of gastric gastrointestinal stromal tumors: Development and validation of a predictive nomogram. World J Gastrointest Endosc 2025; 17(10): 110920
- URL: https://www.wjgnet.com/1948-5190/full/v17/i10/110920.htm
- DOI: https://dx.doi.org/10.4253/wjge.v17.i10.110920


