©The Author(s) 2021.
World J Gastrointest Endosc. Aug 16, 2021; 13(8): 345-355
Published online Aug 16, 2021. doi: 10.4253/wjge.v13.i8.345
Published online Aug 16, 2021. doi: 10.4253/wjge.v13.i8.345
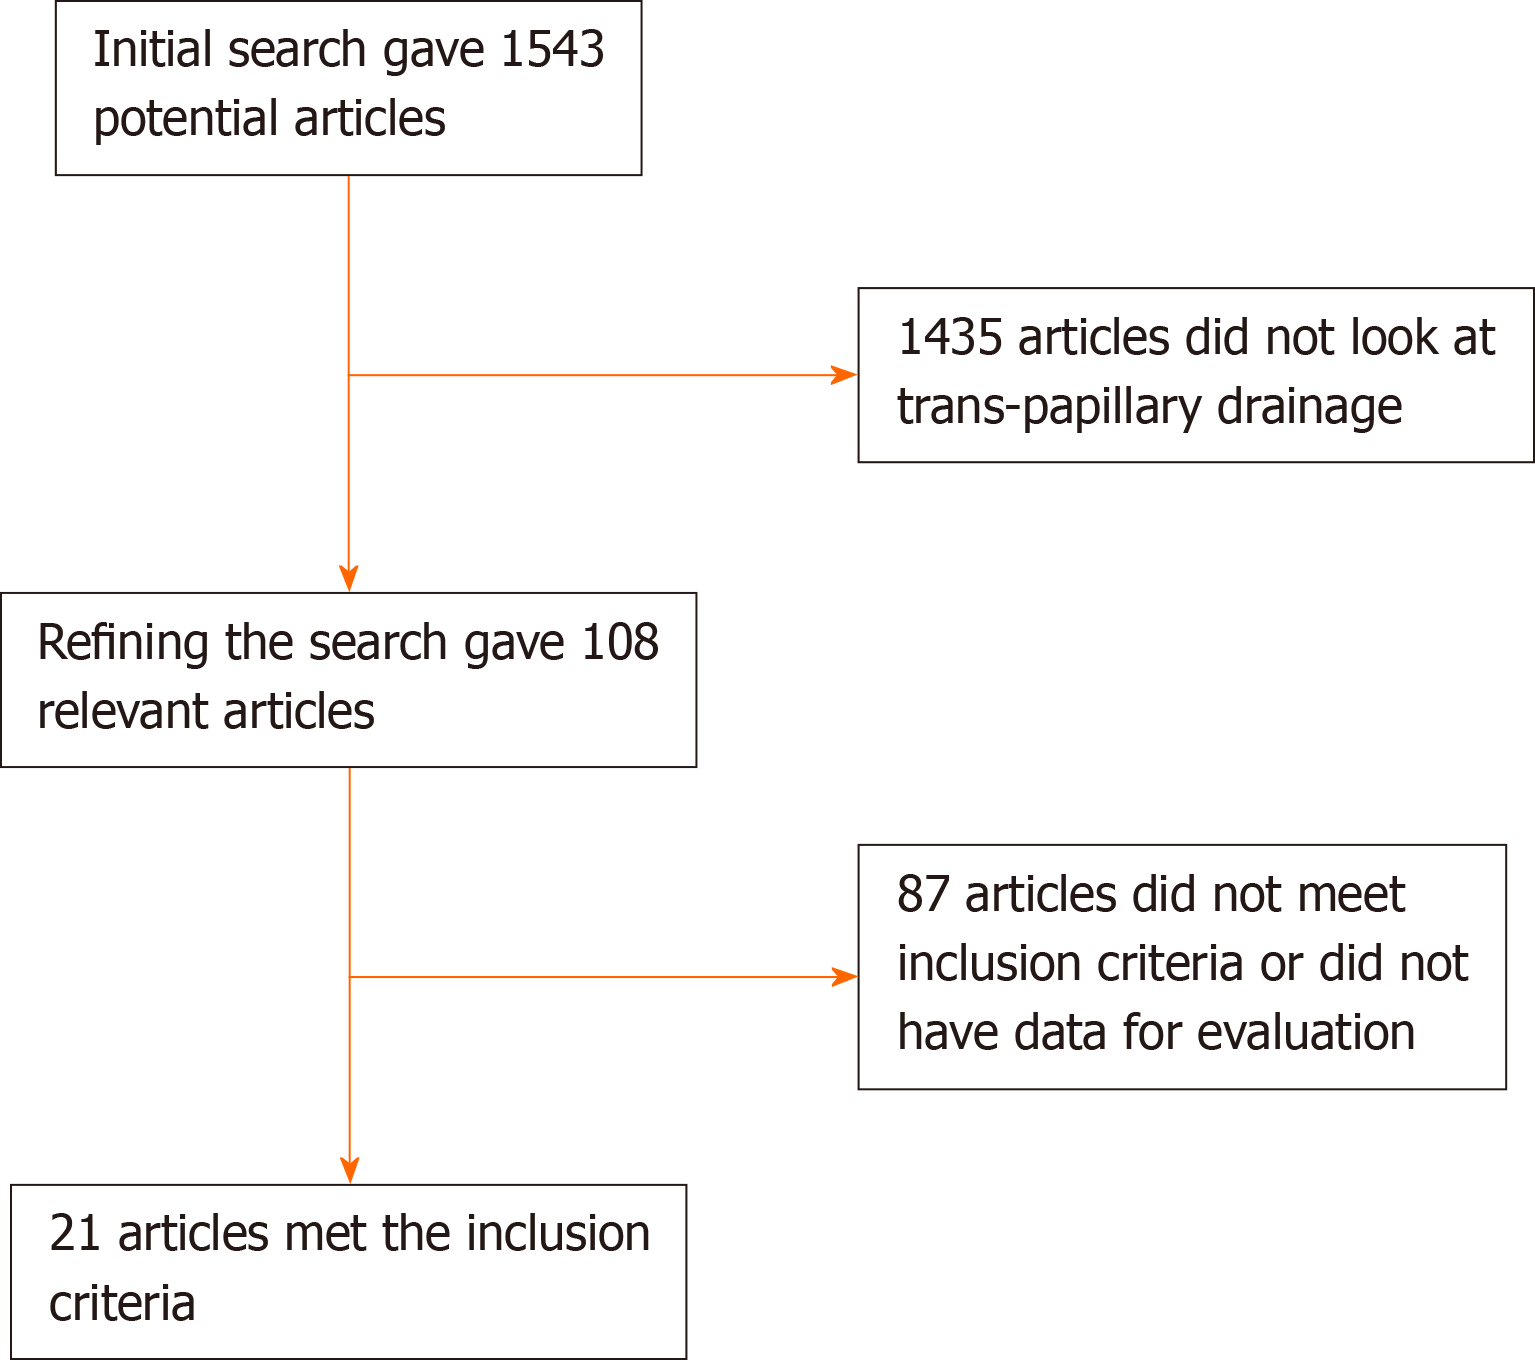
Figure 1 Flowchart of search results.
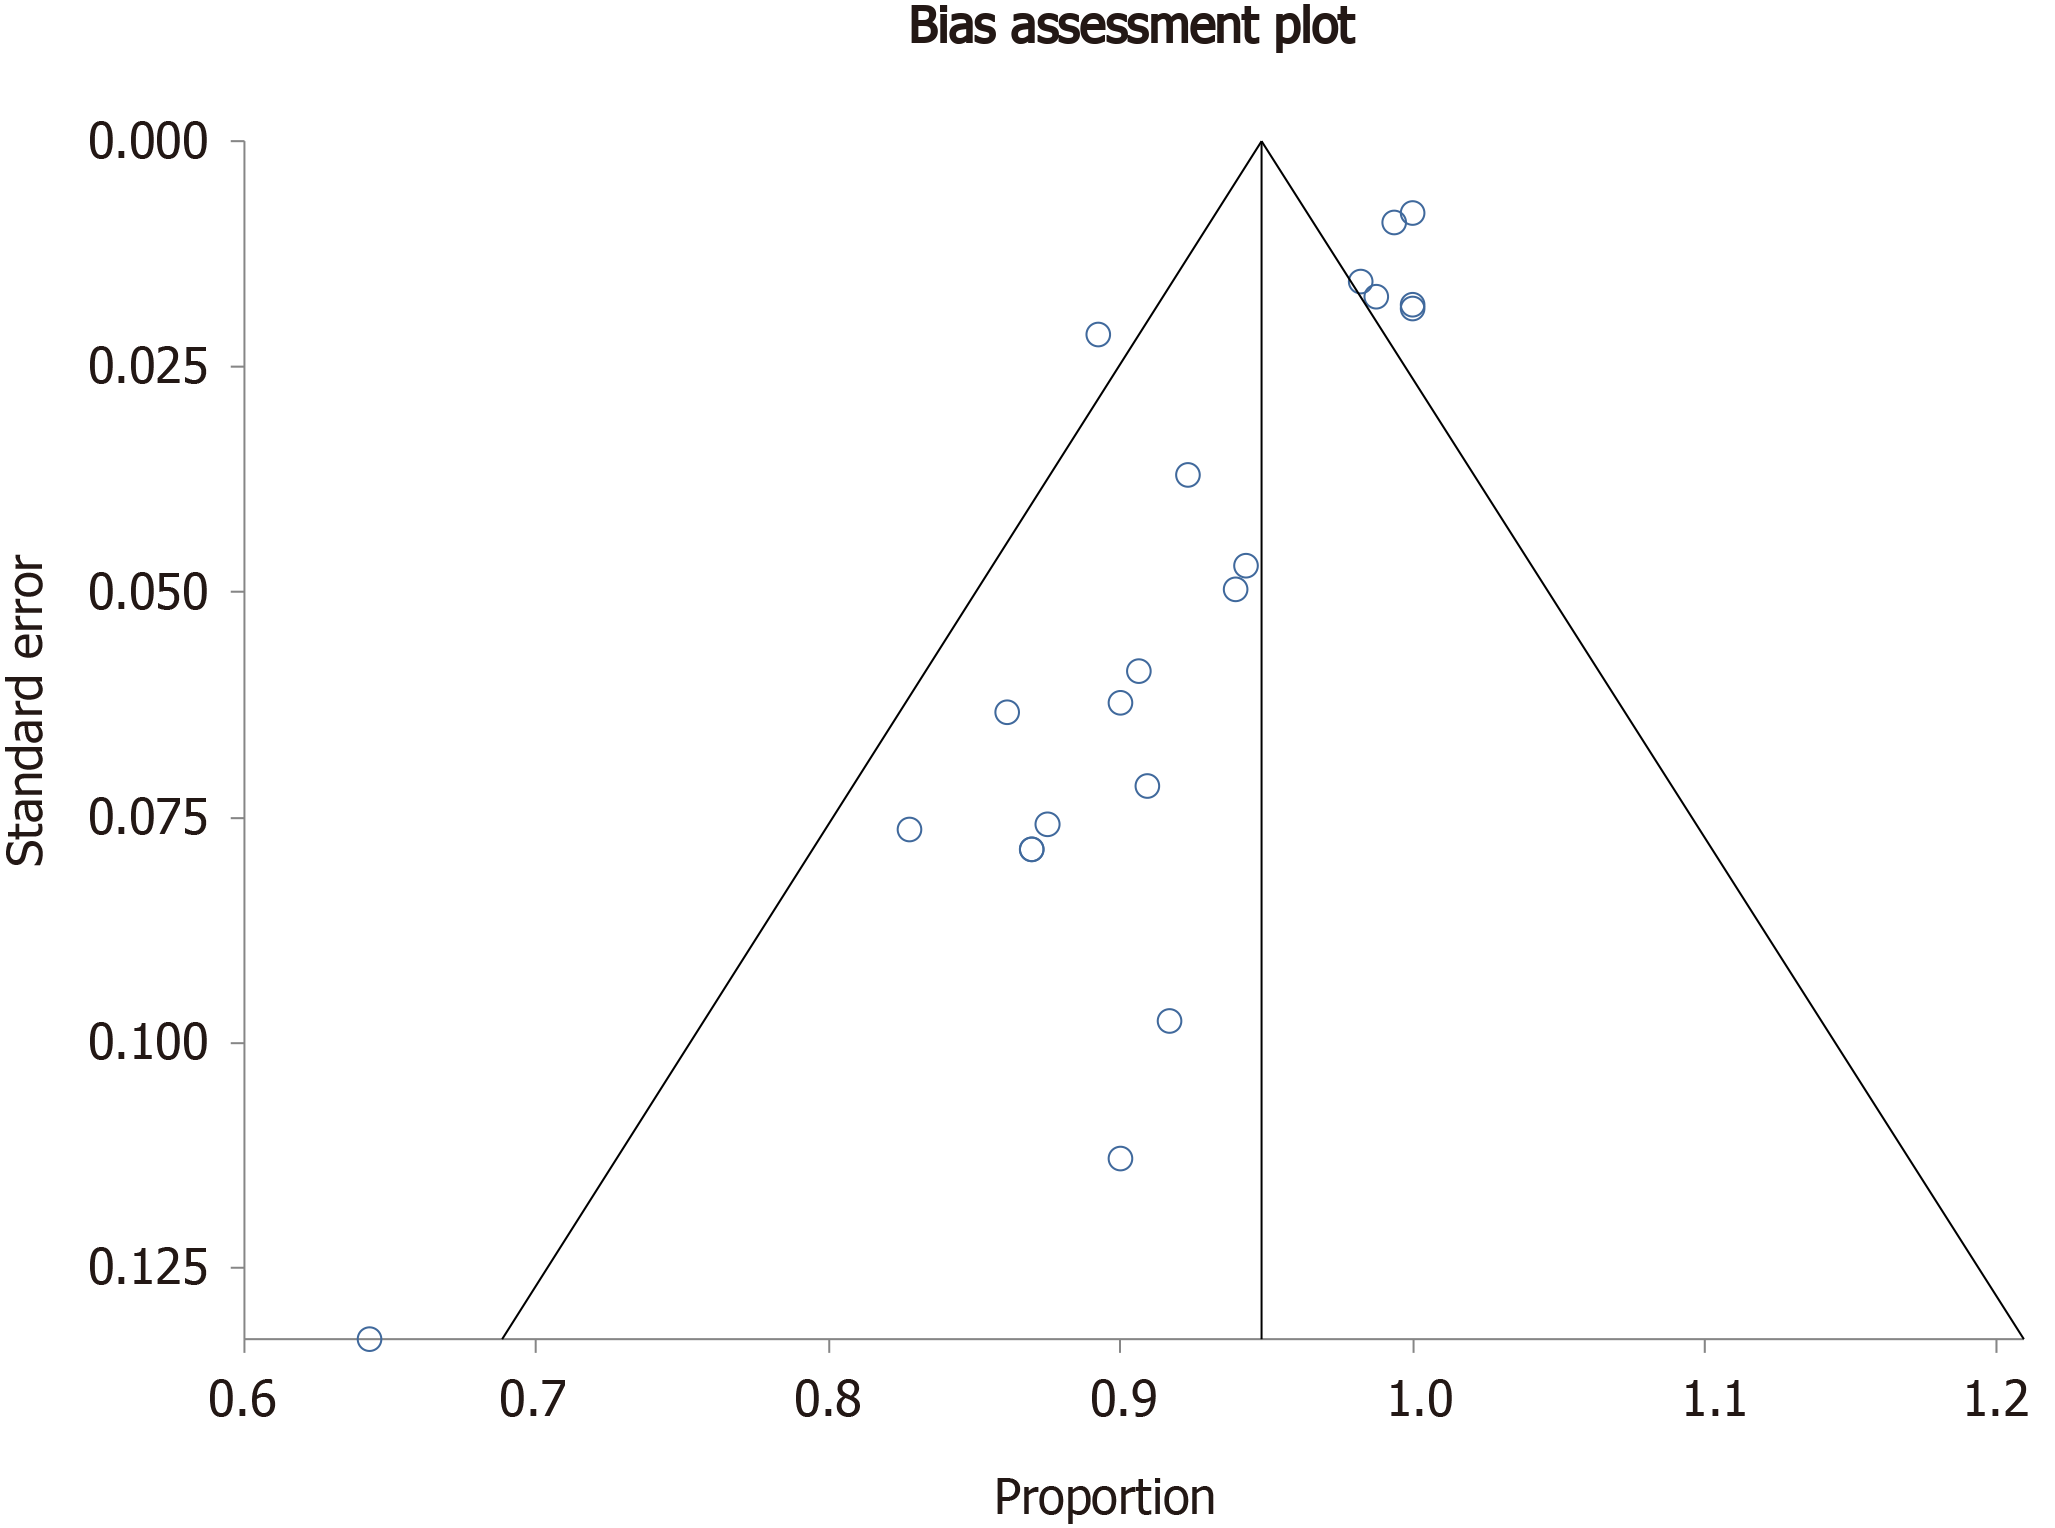
Figure 5 Funnel plot evaluating the effect of publication bias on individual studies rates of endoscopic transpapillary gallbladder drainage success.
- Citation: Jandura DM, Puli SR. Efficacy and safety of endoscopic transpapillary gallbladder drainage in acute cholecystitis: An updated meta-analysis. World J Gastrointest Endosc 2021; 13(8): 345-355
- URL: https://www.wjgnet.com/1948-5190/full/v13/i8/345.htm
- DOI: https://dx.doi.org/10.4253/wjge.v13.i8.345


