©The Author(s) 2021.
World J Gastrointest Endosc. May 16, 2021; 13(5): 137-154
Published online May 16, 2021. doi: 10.4253/wjge.v13.i5.137
Published online May 16, 2021. doi: 10.4253/wjge.v13.i5.137
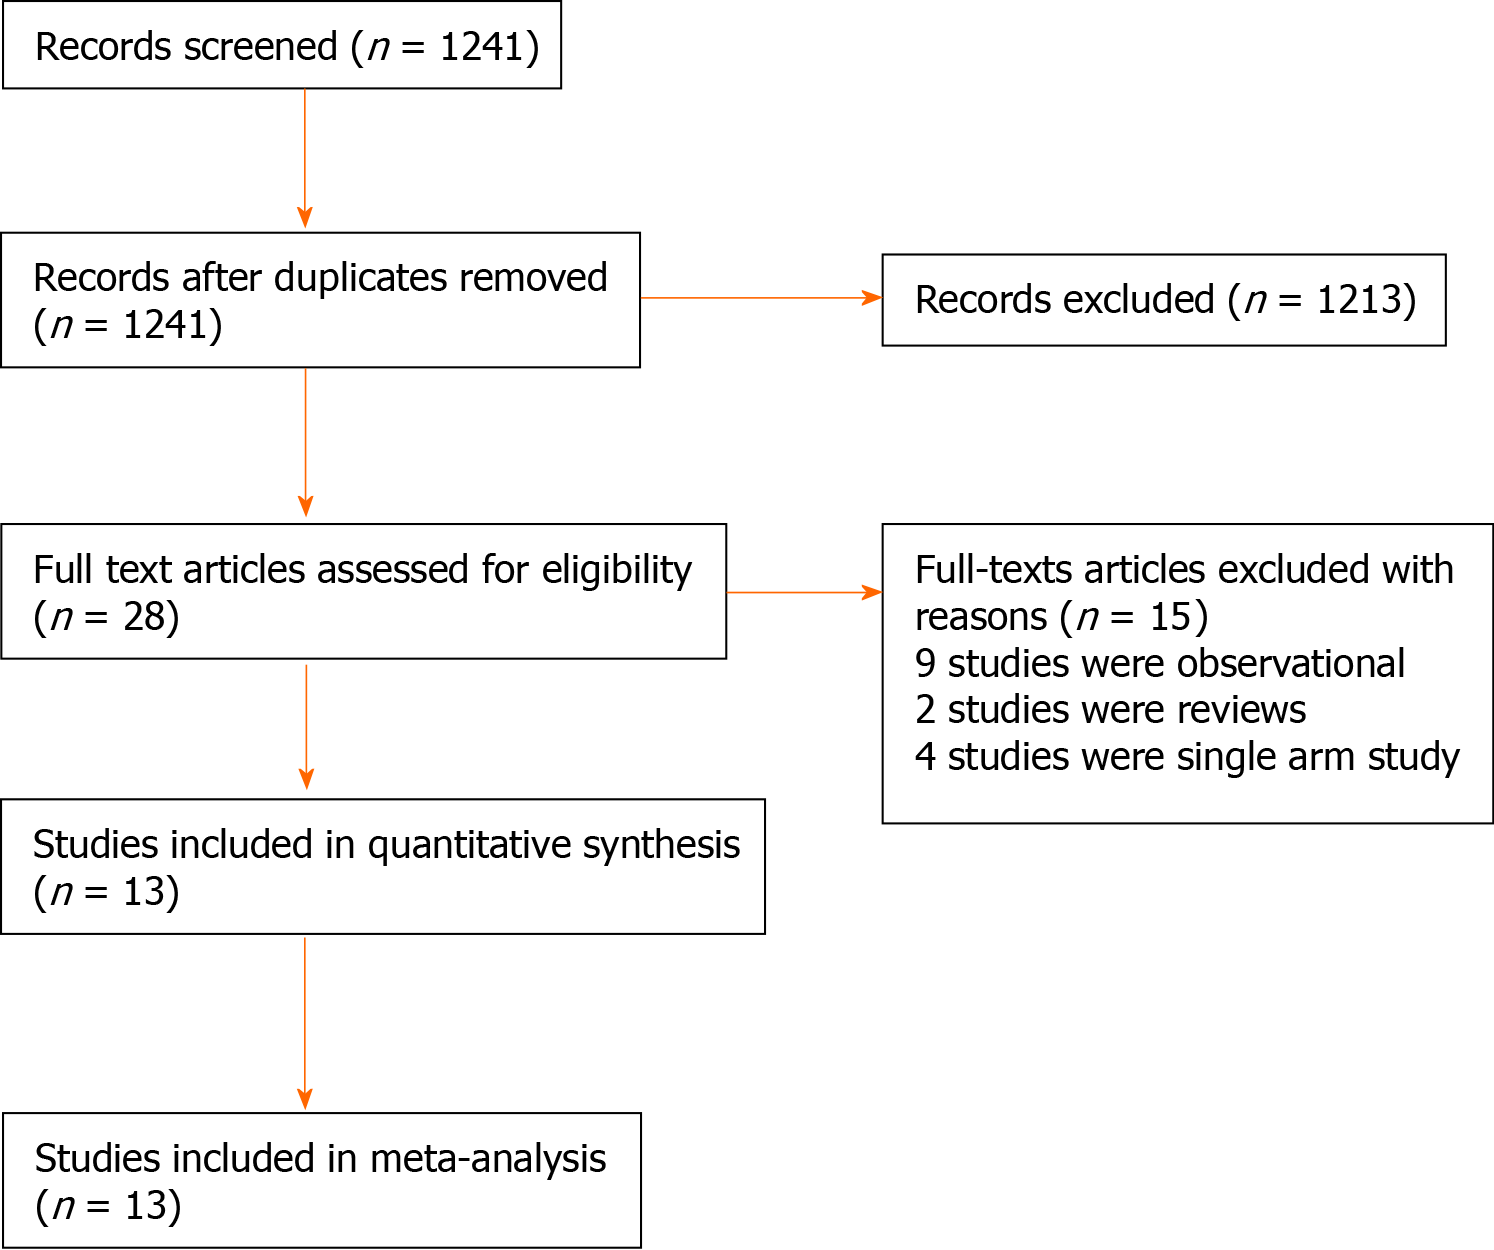
Figure 1 Study flow diagram.
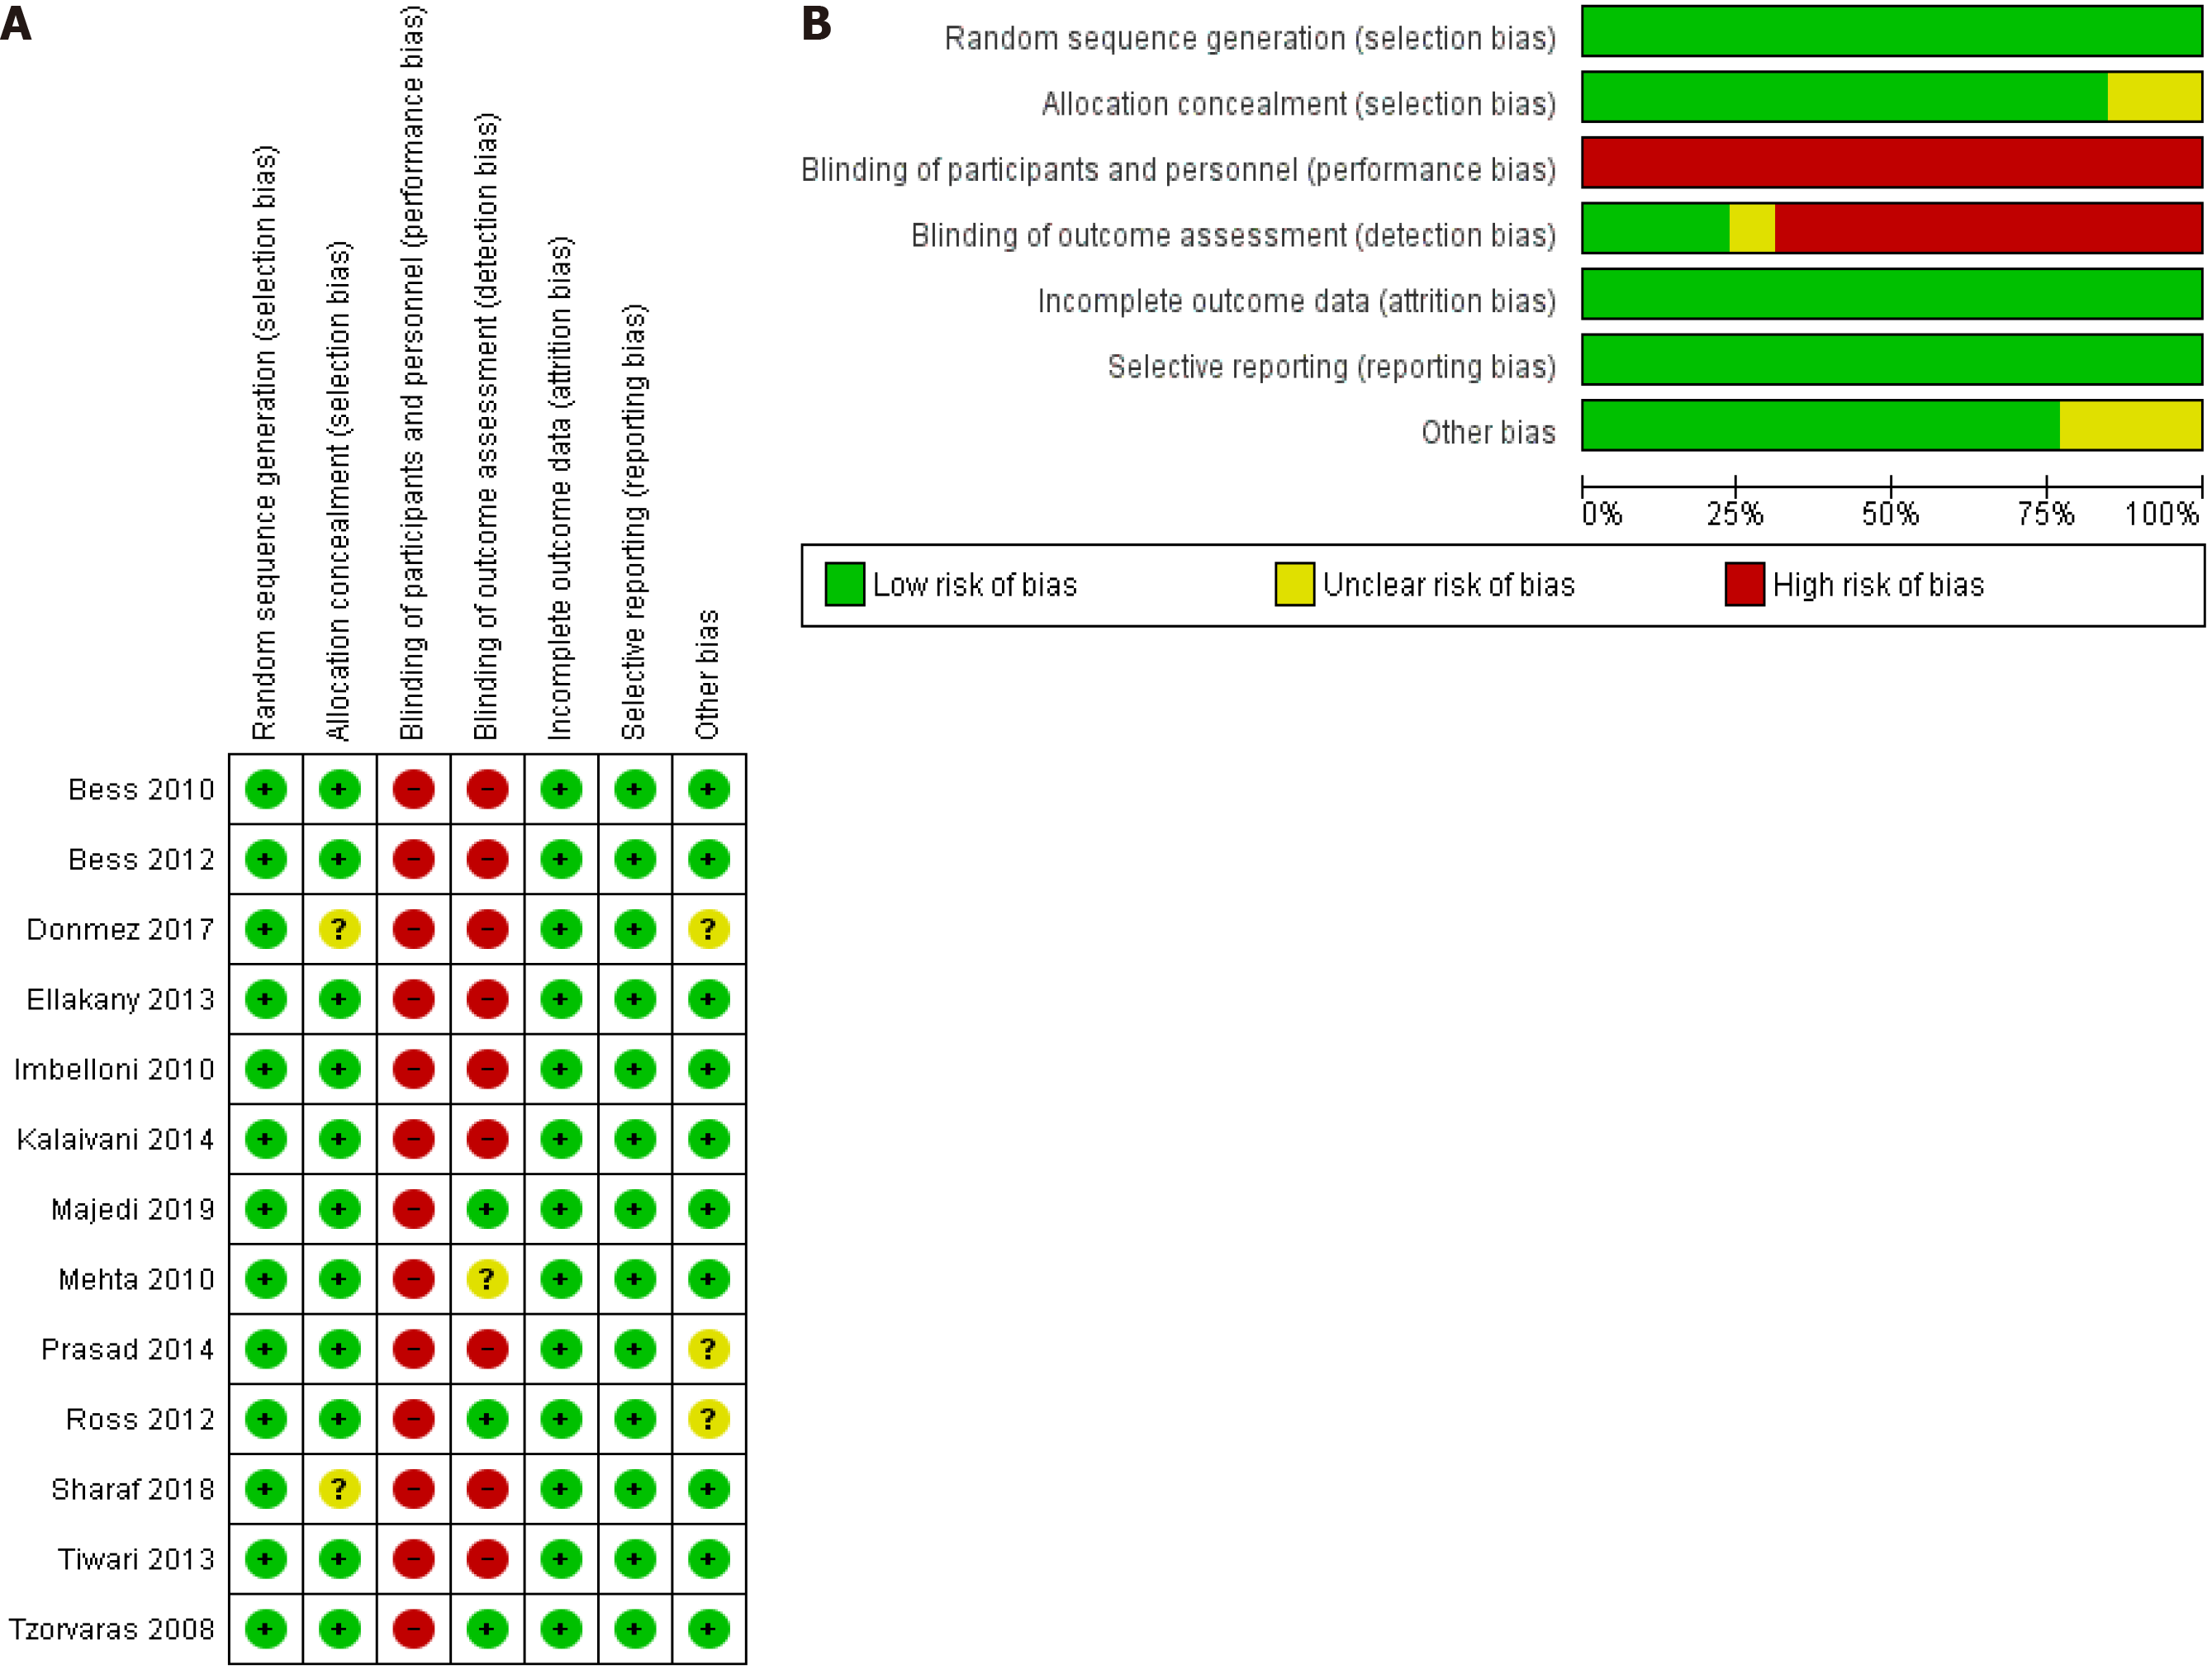
Figure 2 Risk of bias summary and graph showing authors’ judgments about each risk of bias item.
A: Risk of bias summary; B: Risk of bias graph.
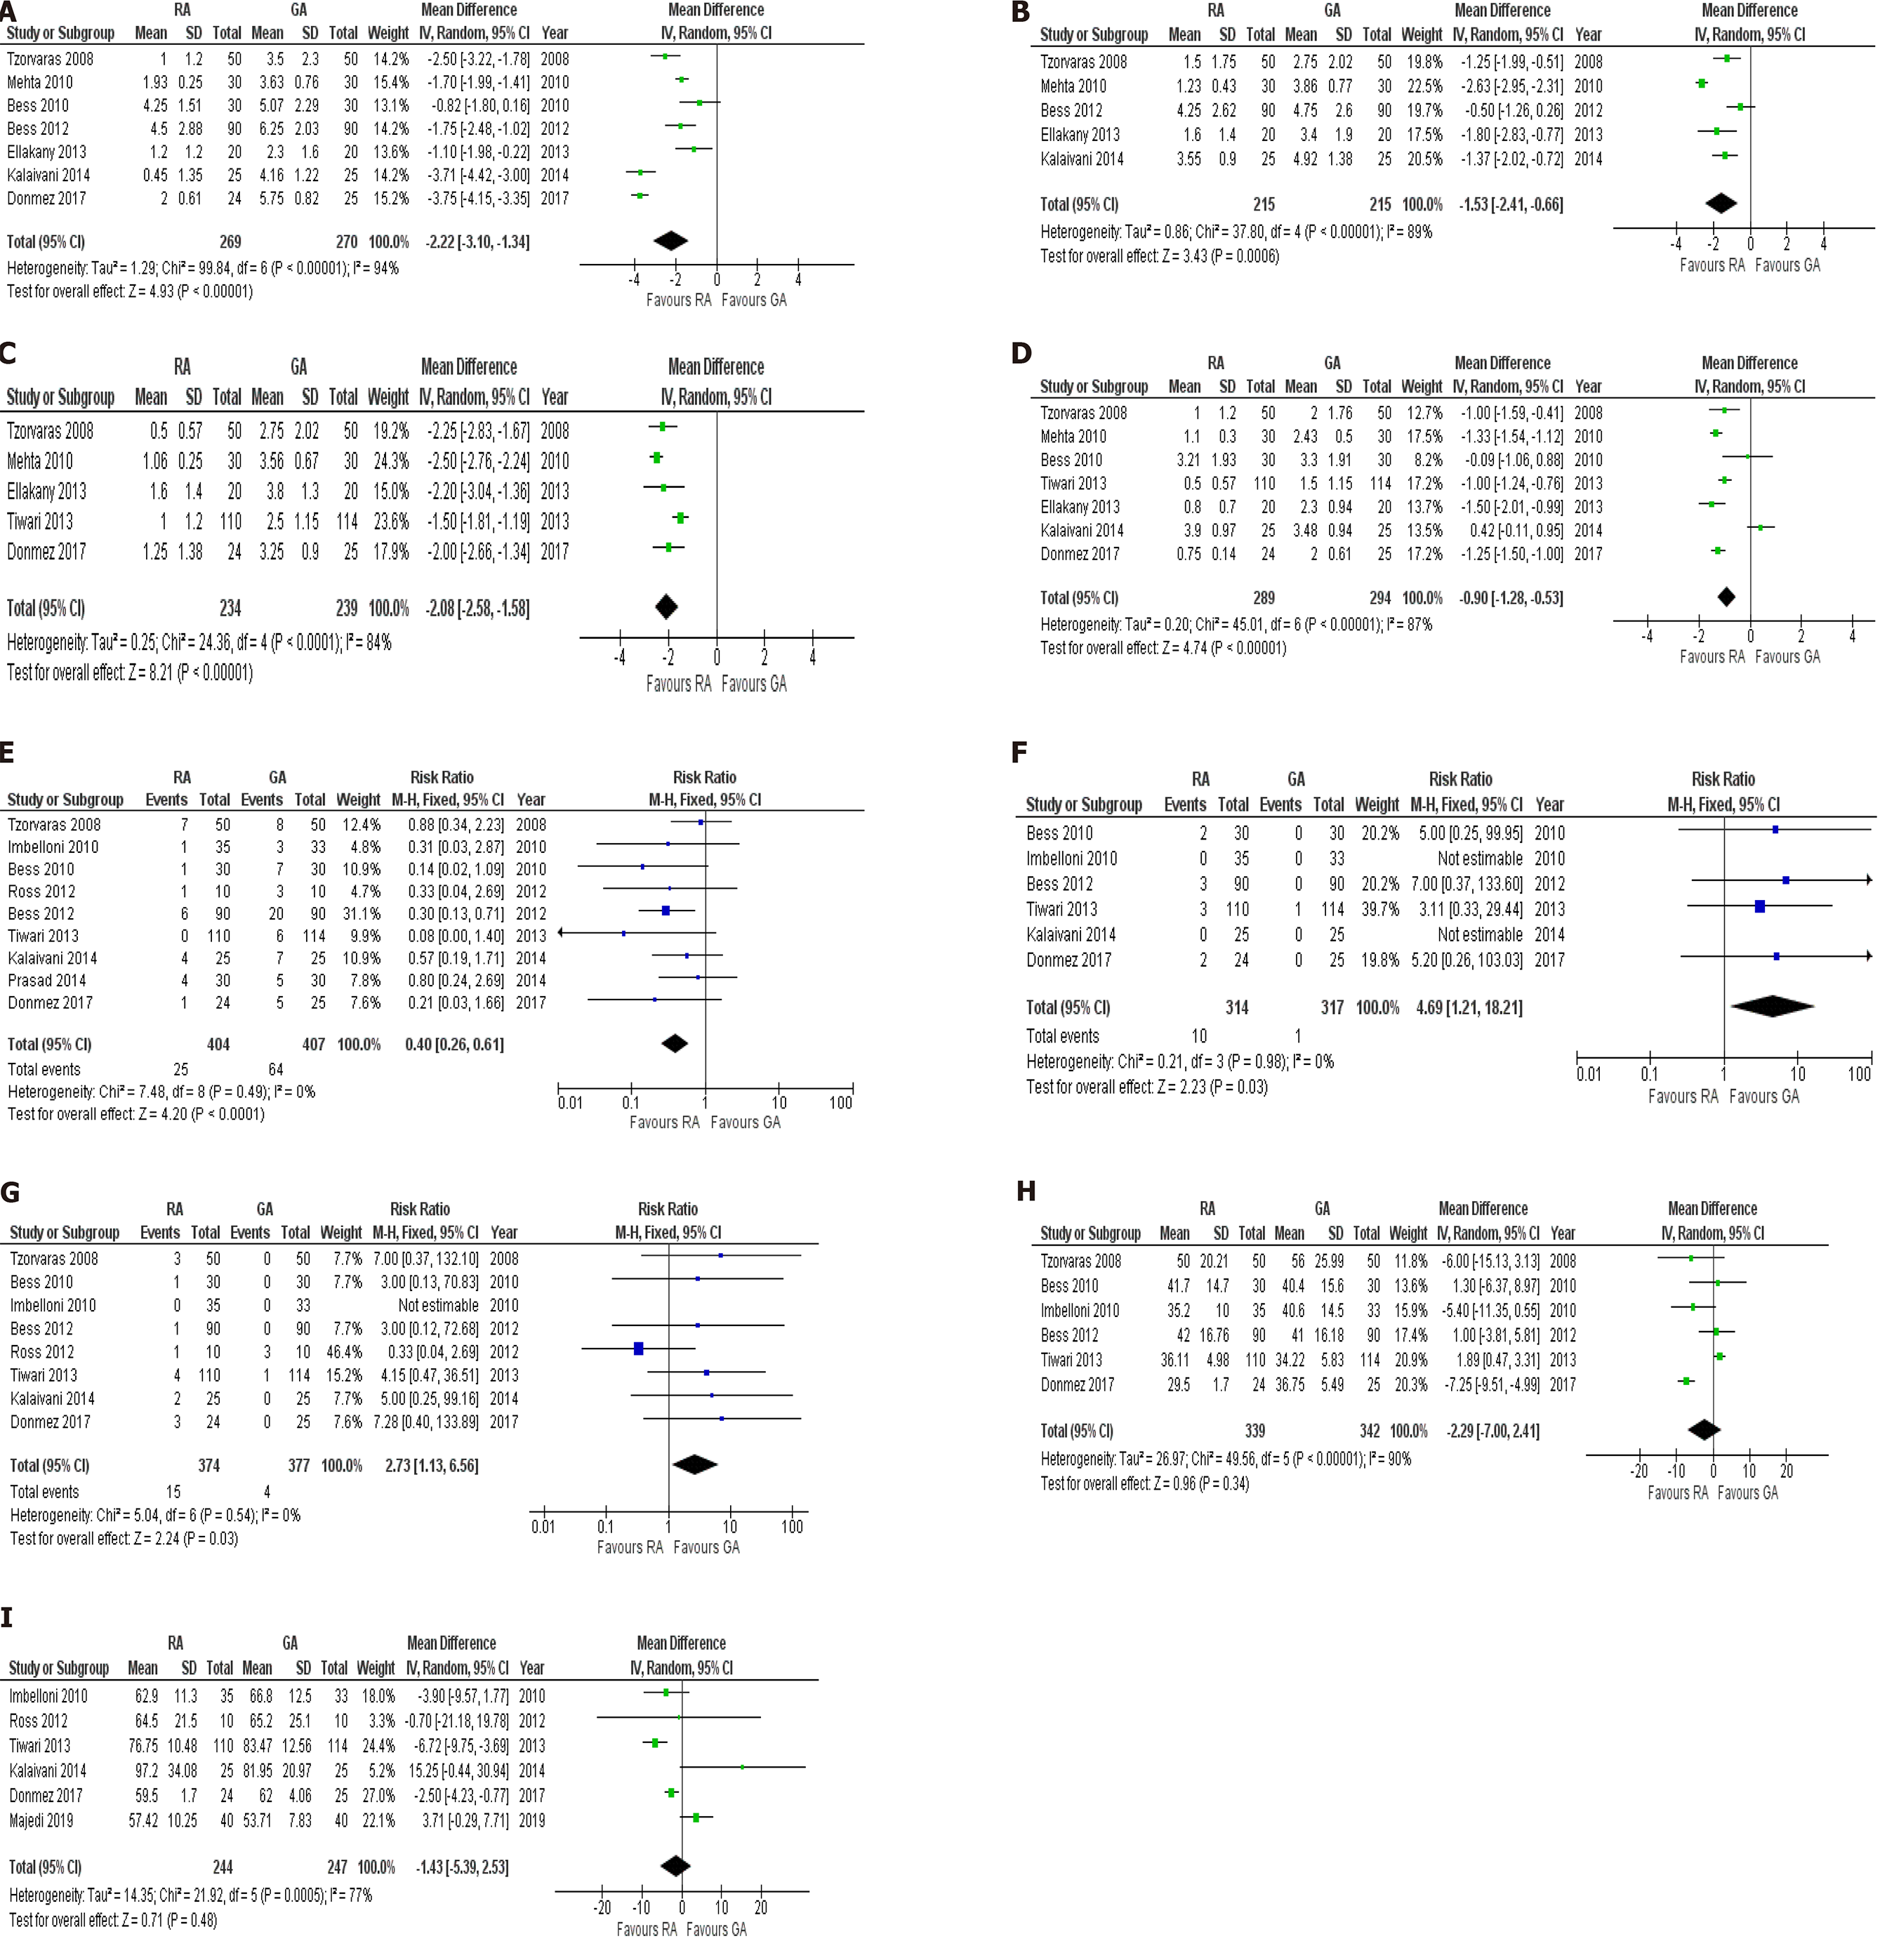
Figure 3 Forest plots of comparison.
A: Visual analogue scale (VAS) at 4 h; B: VAS at 8 h; C: VAS at 12 h; D: VAS at 24 h; E: Nausea and vomiting; F: Headache; G: Urinary retention; H: Operative time; I: Total operative and anesthetic. The solid squares denote the risk ratios or mean difference. The horizontal lines represent the 95% confidence intervals, and the diamond denotes the pooled effect size. M-H: Mantel Haenszel test; RA: Regional anesthesia; GA: General anesthesia; CI: Confidence interval; SD: Standard deviation.
Figure 4 Results of trial sequential analysis.
A: Visual analogue scale (VAS) at 4 h; B: VAS at 8 h; C: VAS at 12 h; D: VAS at 24 h; E: Nausea and vomiting; F: Headache; G: Urinary retention; H: Operative time; I: Total operative and anesthetic time. The red inward-sloping dashed lines make up the trial sequential monitoring boundaries. To the right, the outward sloping red dashed lines make up the futility region. The solid blue line is the cumulative Z curve. The solid green line presents penalised Z value.
- Citation: Asaad P, O’Connor A, Hajibandeh S, Hajibandeh S. Meta-analysis and trial sequential analysis of randomized evidence comparing general anesthesia vs regional anesthesia for laparoscopic cholecystectomy. World J Gastrointest Endosc 2021; 13(5): 137-154
- URL: https://www.wjgnet.com/1948-5190/full/v13/i5/137.htm
- DOI: https://dx.doi.org/10.4253/wjge.v13.i5.137


